91- 6303239042
 CAT WhatsApp Group



 Preferred Source

 Google Discover

CAT Data Interpretation PYQs with Video Solutions
Data Interpretation (DI) is an important part of the DILR section in CAT. Unlike direct formula-based questions, CAT Data Interpretation PYQs test your ability to analyse numerical information, identify patterns and solve problems using tables, charts, graphs and caselets. The main challenge is not always the calculations, but understanding how different pieces of information are connected.
Practising CAT Data Interpretation previous year questions with solutions helps aspirants understand the difficulty level, frequently tested concepts and calculation techniques required in the actual exam. Most DI questions involve Arithmetic concepts such as percentages, ratios, averages and comparisons, but the questions often require multiple steps of reasoning.
For students preparing for CAT 2026, solving CAT DI PYQs regularly can improve calculation speed, accuracy and set selection skills.
CAT Data Interpretation Previous Year Questions PDF Download
Practising CAT Data Interpretation previous year questions PDF is one of the most effective ways to revise important DI concepts and become familiar with the actual CAT question patterns.
The CAT DI PYQs PDF includes data-based questions involving tables, charts, graphs and analytical caselets. These questions help aspirants understand how numerical information is presented and how different calculations are combined within a single set.
Students can access CAT previous year papers, download questions and check detailed solutions through Cracku's previous papers collection.
CAT Data Interpretation PYQs: Year-Wise Analysis
Analysing CAT Data Interpretation previous year questions helps aspirants identify recurring set formats, changes in difficulty and the reasoning skills tested across different years.
Although the number of DI-oriented sets varies across slots, the fundamental concepts of data analysis, calculation and logical interpretation remain important.
CAT Exam Year | Total DILR Questions | General DI Trend |
|---|---|---|
CAT 2025 | 22 | Data comparisons, conditional calculations and integrated reasoning |
CAT 2024 | 22 | Numerical interpretation and reasoning-based data sets |
CAT 2023 | 20 | Multi-step calculations and data relationships |
CAT 2022 | 20 | Caselets, numerical arrangements and analytical interpretation |
CAT 2021 | 20 | Data comparison, charts and calculation-intensive sets |
Note: The figures represent total DILR questions per slot, not DI questions alone. DI set distribution and difficulty varied across slots.
An important observation from CAT DI previous year papers is that Data Interpretation is not limited to reading graphs or tables. Recent CAT papers have included sets where numerical information is combined with conditions, rankings or logical relationships.
Therefore, while solving CAT DILR PYQs, students should practise both traditional calculation-based DI and reasoning-intensive DI sets.
Also Read: CAT DILR PYQ Analysis 2026, Difficulty, Repeated Topics
Most Common CAT Data Interpretation Question Types from Previous Years
CAT Data Interpretation previous year questions cover different data formats. Understanding these question types helps aspirants identify the information required and choose an appropriate solving method.
CAT DI Question Type | What It Tests | Recommended Approach |
|---|---|---|
Table-Based DI | Comparing data across rows and columns | Organise values and identify relationships |
Bar Graphs | Comparing quantities across categories | Check units, scales and differences |
Line Graphs | Understanding trends and changes | Focus on growth rates and comparisons |
Pie Charts | Analysing proportions and percentages | Convert shares into actual values |
DI Caselets | Interpreting numerical information in paragraphs | Convert statements into tables |
Missing Data DI | Finding unknown values using conditions | Form equations and eliminate possibilities |
Mixed Graph DI | Connecting information from multiple representations | Identify common variables |
Among these, table-based DI, caselets and reasoning-based data sets deserve particular attention because they can involve several connected calculations.
For example, a DI set may provide the revenues and expenses of five companies over three years. Instead of directly asking for revenue, the questions might require students to calculate profit percentages, compare growth rates and identify the company with the largest relative improvement.
For more topic-wise practice, students can explore CAT 2026 DILR topic-wise questions PDF covering different DI and LR set types.
Also Read: DILR Important Topics CAT 2026: Topic-Wise Weightage Trends
How to Solve CAT Data Interpretation PYQs?
Solving CAT DI previous year questions requires a combination of numerical ability, logical reasoning and efficient data organisation. Simply calculating faster is not enough if the given information is not interpreted correctly.
Understand the data before calculating
Read the instructions and identify the variables, units and conditions. Determine what each row, column or graph represents before attempting the questions.
Organise the information
For caselets and complex DI sets, create a simple table or diagram. This reduces confusion and makes relationships easier to identify.
Use efficient calculation techniques
Practise fraction-to-percentage conversions, approximations, ratios and averages. For example, recognising that 12.5% equals one-eighth can save time during repeated calculations.
Identify the right question order
Not every question within a DI set needs to be solved sequentially. Start with questions that require direct calculations before attempting those involving multiple conditions.
Review the complete solution
After solving each CAT DI PYQ, compare your approach with the detailed solution. Check whether a simpler calculation or better representation could have reduced the time required.
One important technique is to avoid calculating every possible value immediately. First, identify what the questions actually require and calculate only the necessary information.
Also Read: CAT DILR Marathon Questions 2026 PDF with Video Solutions
How to Practise CAT Data Interpretation PYQs for CAT 2026?
A structured practice strategy helps students improve both accuracy and speed in CAT Data Interpretation. Instead of solving random questions, aspirants should gradually move from understanding individual DI formats to attempting mixed DILR sets under timed conditions.
Preparation Stage | Suggested Practice Target | Main Focus |
|---|---|---|
Concept Building | 1–2 DI sets daily | Understanding tables, graphs and calculations |
Accuracy Building | 2–3 DI sets daily | Data organisation and reducing calculation errors |
Timed Practice | 3–4 sets per session | Speed, accuracy and set selection |
Mock Test Stage | Full DILR sectional practice | Time management and exam strategy |
These are suggested practice targets and can be adjusted according to preparation level.
Start with easier CAT DI previous year questions before moving to more complicated reasoning-based sets. Once you can consistently solve questions accurately, introduce time limits.
Students should also practise CAT mock tests to understand how DI sets appear alongside Logical Reasoning questions in the actual exam.
During mock analysis, identify whether you lost time because of lengthy calculations, incorrect data interpretation or poor set selection. This is important because choosing the wrong set can affect your overall DILR score even when your calculation skills are strong.
Regular CAT sectional tests can help improve performance under the 40-minute DILR sectional time limit.
Maintain a simple DI practice log recording the set type, time taken, questions attempted, accuracy and reason for mistakes. This will help you identify recurring weaknesses and prioritise revision before CAT 2026.
Also Read: 25+ Most Important DILR Sets for CAT 2026 (Most Expected)
CAT Data Interpretation PYQ Questions
Practising CAT Data Interpretation PYQ questions is one of the best ways to understand the complexity and structure of actual CAT DI sets. These previous year questions test important concepts such as percentages, ratios, averages, data comparisons and multi-step reasoning.
Below are some important CAT Data Interpretation previous year questions with detailed solutions. Try solving each DI set independently before checking the answers. Pay attention to how the given information is organised, which calculations are necessary and whether a faster approach is available. This will help improve your accuracy and set-solving speed for CAT 2026.
Instruction for set :
The Sustainability Index (SI) of a country at a point in time is an integer between 1 and 100. This question is related to SI of six countries - A, B, C, D, E, and F - at three different points in time - 2016, 2020, and 2024. The plot represents the exact changes in their SI, with X-coordinate representing % increase in 2020 from 2016, i.e., (SI in 2020 minus SI in 2016) / (SI in 2016), and Y-coordinate representing % increase in 2024 from 2020. At any point in time, the country with highest SI is ranked 1, while the country with the lowest SI is ranked 6. The following additional facts are known.
1. In 2016, B, C, E, and A had ranks 1, 2, 3, and 4 respectively.
2. F had lower SI than any other country in 2016, 2020, and 2024.
3. In 2024, E was the only country with SI of 90.
4. The range of SI of the six countries was 60 in 2016 as well as in 2024.
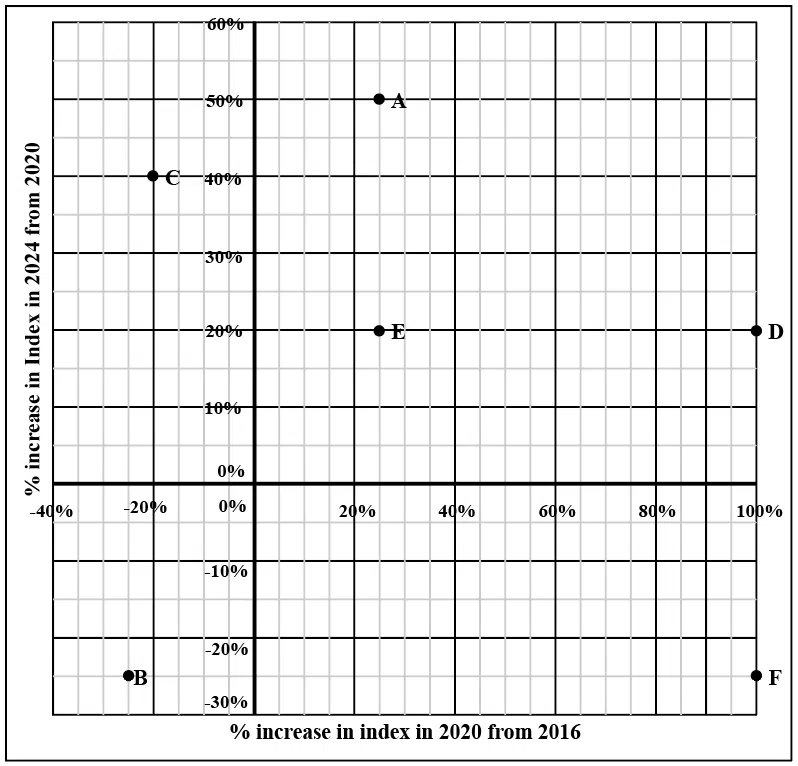
Question 1
What was the SI of E in 2016?
correct answer:- 60
The Sustainability Index (SI) of a country at a point in time is an integer between 1 and 100. This question is related to SI of six countries - A, B, C, D, E, and F - at three different points in time - 2016, 2020, and 2024. The plot represents the exact changes in their SI, with X-coordinate representing % increase in 2020 from 2016, i.e., (SI in 2020 minus SI in 2016) / (SI in 2016), and Y-coordinate representing % increase in 2024 from 2020. At any point in time, the country with highest SI is ranked 1, while the country with the lowest SI is ranked 6. The following additional facts are known.
1. In 2016, B, C, E, and A had ranks 1, 2, 3, and 4 respectively.
2. F had lower SI than any other country in 2016, 2020, and 2024.
3. In 2024, E was the only country with SI of 90.
4. The range of SI of the six countries was 60 in 2016 as well as in 2024.
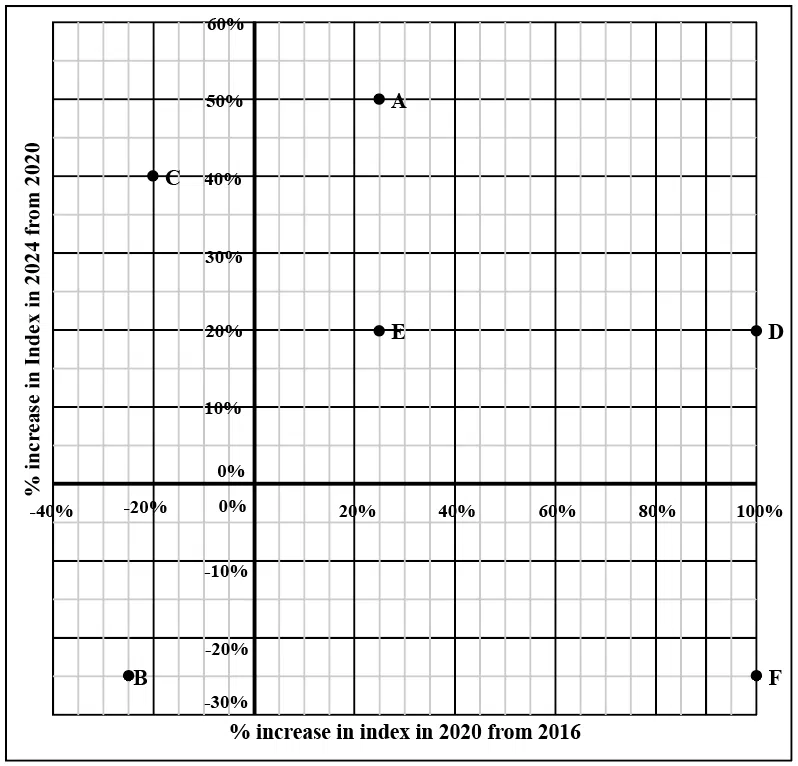
Question 2
What was the SI of F in 2020?
correct answer:- 40
The Sustainability Index (SI) of a country at a point in time is an integer between 1 and 100. This question is related to SI of six countries - A, B, C, D, E, and F - at three different points in time - 2016, 2020, and 2024. The plot represents the exact changes in their SI, with X-coordinate representing % increase in 2020 from 2016, i.e., (SI in 2020 minus SI in 2016) / (SI in 2016), and Y-coordinate representing % increase in 2024 from 2020. At any point in time, the country with highest SI is ranked 1, while the country with the lowest SI is ranked 6. The following additional facts are known.
1. In 2016, B, C, E, and A had ranks 1, 2, 3, and 4 respectively.
2. F had lower SI than any other country in 2016, 2020, and 2024.
3. In 2024, E was the only country with SI of 90.
4. The range of SI of the six countries was 60 in 2016 as well as in 2024.
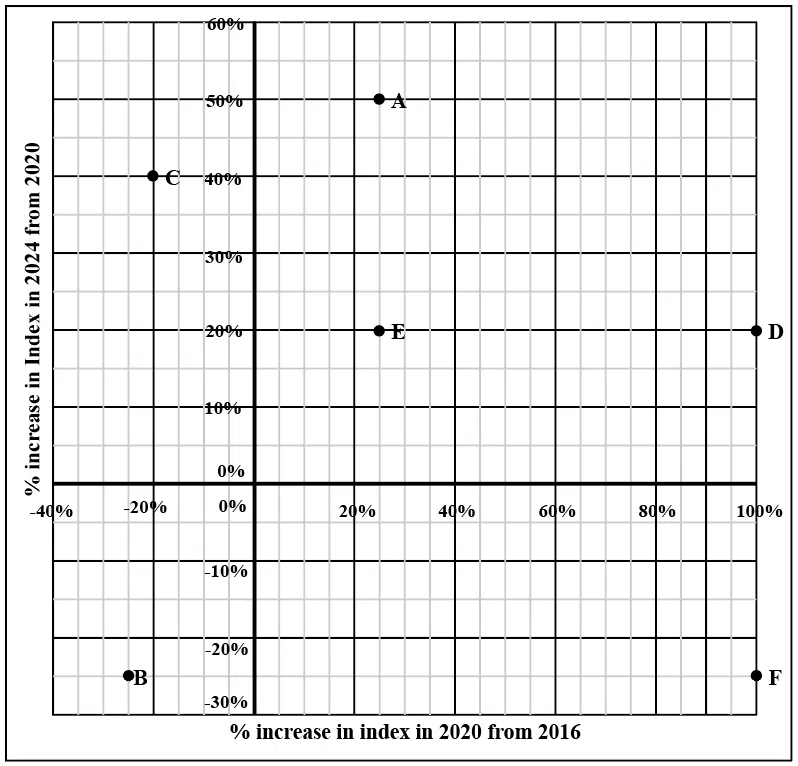
Question 3
What was the SI of C in 2024?
correct answer:- 84
An online e-commerce firm receives daily integer product ratings from 1 through 5 given by buyers. The daily average is the average of the ratings given on that day. The cumulative average is the average of all ratings given on or before that day. The rating system began on Day 1, and the cumulative averages were 3 and 3.1 at the end of Day 1 and Day 2, respectively. The distribution of ratings on Day 2 is given in the figure below.
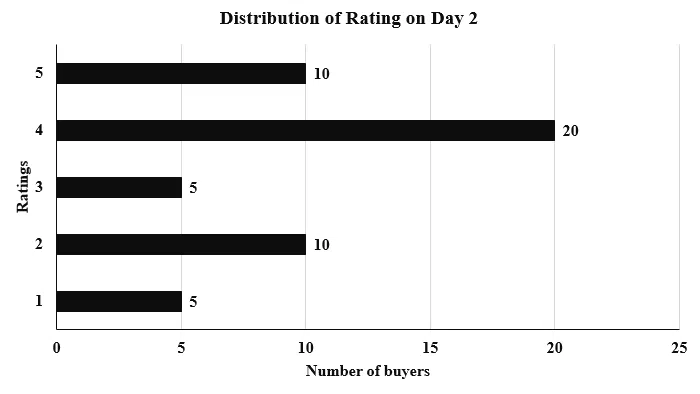
The following information is known about ratings on Day 3.
1. 100 buyers gave product ratings on Day 3.
2. The modes of the product ratings were 4 and 5.
3. The numbers of buyers giving each product rating are non-zero multiples of 10.
4. The same number of buyers gave product ratings of 1 and 2, and that number is half the number of buyers who gave a rating of 3.
Question 4
How many buyers gave ratings on Day 1?
correct answer:- 150
The two plots below give the following information about six firms A, B, C, D, E, and F for 2019 and 2023.
PAT: The firm’s profits after taxes in Rs. crores,
ES: The firm’s employee strength, that is the number of employees in the firm, and
PRD: The percentage of the firm’s PAT that they spend on Research and Development (R&D;).
In the plots, the horizontal and vertical coordinates of point representing each firm gives their ES and PAT values respectively. The PRD values of each firm are proportional to the areas around the points representing each firm. The areas are comparable between the two plots, i.e., equal areas in the two plots represent the same PRD values for the two years.
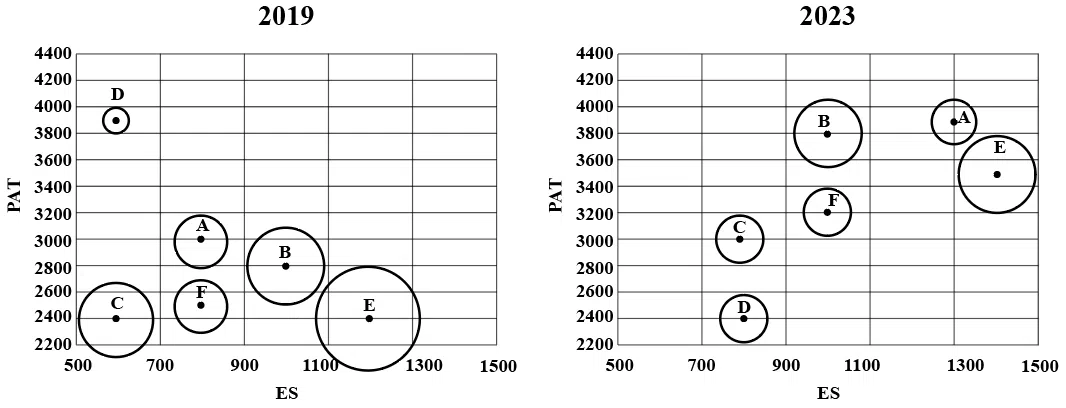
Question 5
Assume that the annual rate of growth in PAT over the previous year (ARG) remained constant over the years for each of the six firms. Which among the firms A, B, C, and E had the highest ARG?
correct answer:- 3

The two plots below give the following information about six firms A, B, C, D, E, and F for 2019 and 2023.
PAT: The firm’s profits after taxes in Rs. crores,
ES: The firm’s employee strength, that is the number of employees in the firm, and
PRD: The percentage of the firm’s PAT that they spend on Research and Development (R&D;).
In the plots, the horizontal and vertical coordinates of point representing each firm gives their ES and PAT values respectively. The PRD values of each firm are proportional to the areas around the points representing each firm. The areas are comparable between the two plots, i.e., equal areas in the two plots represent the same PRD values for the two years.
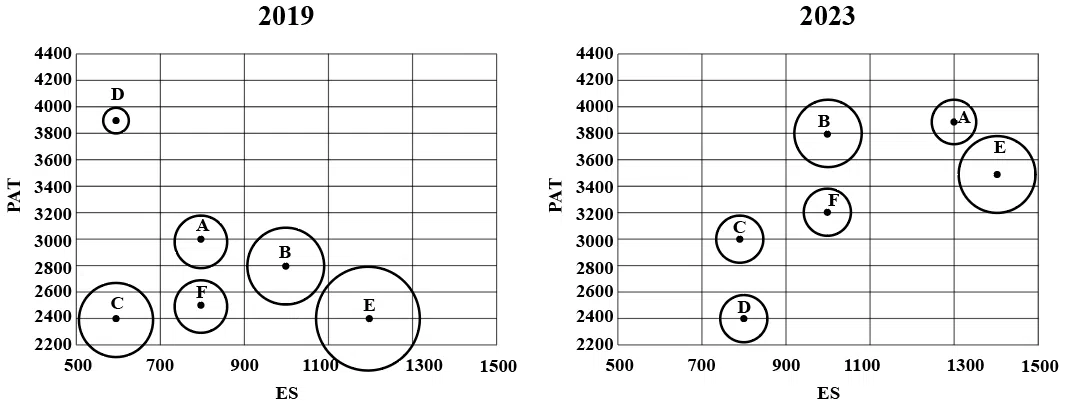
Question 6
The ratio of the amount of money spent by Firm C on R&D; in 2019 to that in 2023 is closest to
correct answer:- 4
An air conditioner (AC) company has four dealers - D1, D2, D3 and D4 in a city. It is evaluating sales performances of these dealers. The company sells two variants of ACs - Window and Split. Both these variants can be either Inverter type or Non-inverter type. It is known that of the total number of ACs sold in the city, 25% were of Window variant, while the rest were of Split variant. Among the Inverter ACs sold, 20% were of Window variant.
The following information is also known:
1. Every dealer sold at least two window ACs.
2. D1 sold 13 inverter ACs, while D3 sold 5 Non-inverter ACs.
3. A total of six Window Non-inverter ACs and 36 Split Inverter ACs were sold in the city.
4. The number of Split ACs sold by D1 was twice the number of Window ACs sold by it.
5. D3 and D4 sold an equal number of Window ACs and this number was one-third of the number of similar ACs sold by D2.
6. D2 and D3 were the only ones who sold Window Non-inverter ACs. The number of these ACs sold by D2 was twice the number of these ACs sold by D3.
7. D3 and D4 sold an equal number of Split Inverter ACs. This number was half the number of similar ACs sold by D2.
Question 7
What percentage of ACs sold were of Non-inverter type?
correct answer:- 3
Five restaurants, coded R1, R2, R3, R4 and R5 gave integer ratings to five gig workers -
Ullas, Vasu, Waman, Xavier and Yusuf, on a scale of 1 to 5.
The means of the ratings given by R1, R2, R3, R4 and R5 were 3.4, 2.2, 3.8, 2.8 and 3.4 respectively.
The summary statistics of these ratings for the five workers is given below.
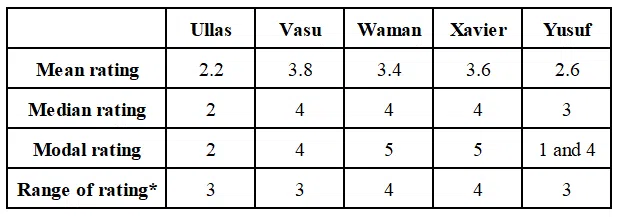
* Range of ratings is defined as the difference between the maximum and minimum ratings awarded to a worker.
The following is partial information about ratings of 1 and 5 awarded by the restaurants to the workers.
(a) R1 awarded a rating of 5 to Waman, as did R2 to Xavier, R3 to Waman and Xavier, and R5 to Vasu.
(b) R1 awarded a rating of 1 to Ullas, as did R2 to Waman and Yusuf, and R3 to Yusuf.
Question 8
How many individual ratings cannot be determined from the above information?
correct answer:- 0
Five restaurants, coded R1, R2, R3, R4 and R5 gave integer ratings to five gig workers -
Ullas, Vasu, Waman, Xavier and Yusuf, on a scale of 1 to 5.
The means of the ratings given by R1, R2, R3, R4 and R5 were 3.4, 2.2, 3.8, 2.8 and 3.4 respectively.
The summary statistics of these ratings for the five workers is given below.
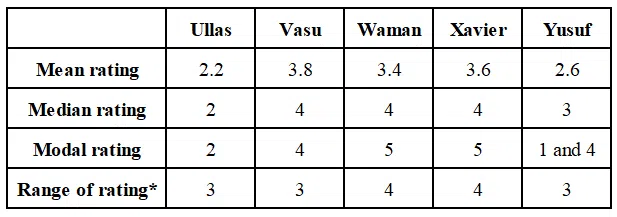
* Range of ratings is defined as the difference between the maximum and minimum ratings awarded to a worker.
The following is partial information about ratings of 1 and 5 awarded by the restaurants to the workers.
(a) R1 awarded a rating of 5 to Waman, as did R2 to Xavier, R3 to Waman and Xavier, and R5 to Vasu.
(b) R1 awarded a rating of 1 to Ullas, as did R2 to Waman and Yusuf, and R3 to Yusuf.
Question 9
To how many workers did R2 give a rating of 4?
correct answer:- 0
In the following, a year corresponds to 1st of January of that year.
A study to determine the mortality rate for a disease began in 1980. The study chose 1000 males and 1000 females and followed them for forty years or until they died, whichever came first. The 1000 males chosen in 1980 consisted of 250 each of ages 10 to less than 20, 20 to less than 30, 30 to less than 40, and 40 to less than 50. The 1000 females chosen in 1980 also consisted of 250 each of ages 10 to less than 20, 20 to less than 30, 30 to less than 40,and 40 to less than 50.
The four figures below depict the age profile of those among the 2000 individuals who were still alive in 1990, 2000, 2010, and 2020. The blue bars in each figure represent the number of males in each age group at that point in time, while the pink bars represent the number of females in each age group at that point in time. The numbers next to the bars give the exact numbers being represented by the bars. For example, we know that 230 males among those tracked and who were alive in 1990 were aged between 20 and 30.
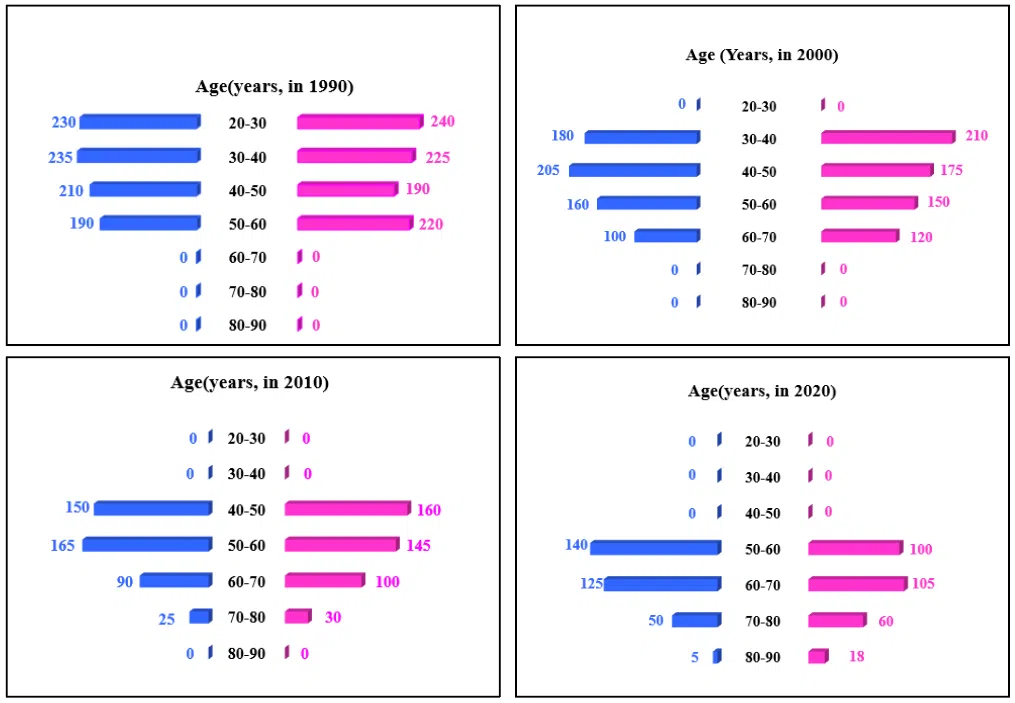
Question 10
In 2000, what was the ratio of the number of dead males to dead females among those being tracked?
correct answer:- 1

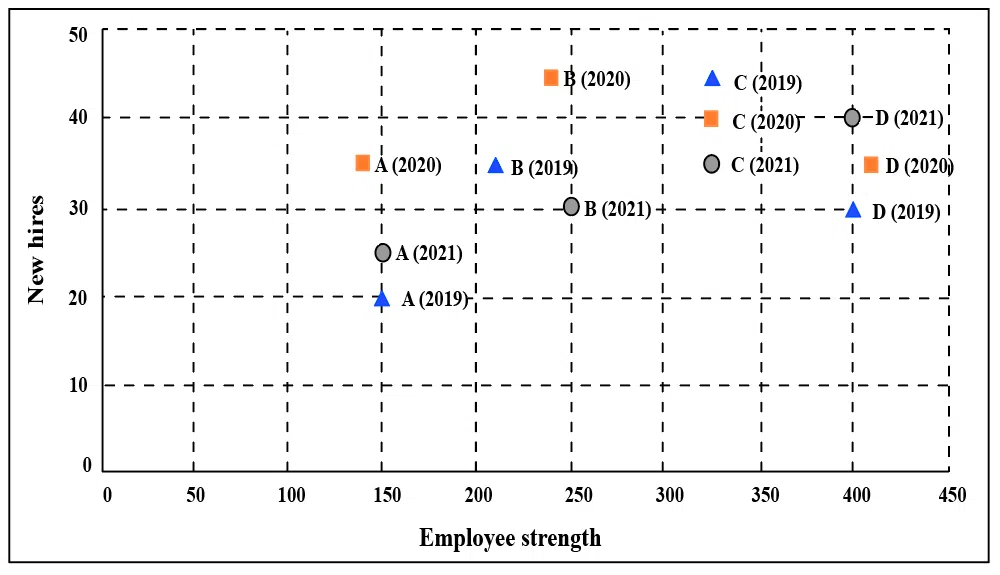
The two plots below show data for four companies code-named A, B, C, and D over three years - 2019, 2020, and 2021.
The first plot shows the revenues and costs incurred by the companies during these years. For example, in 2021, company C earned Rs.100 crores in revenue and spent Rs.30 crores. The profit of a company is defined as its revenue minus its costs
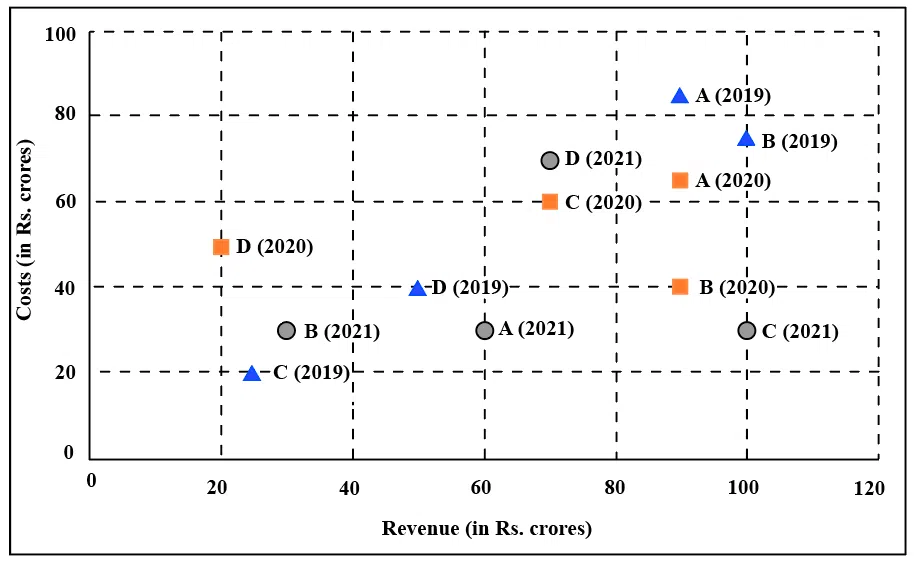
The second plot shows the number of employees employed by the company (employee strength) at the start of each of these three years, as well as the number of new employees hired each year (new hires). For example, Company B had 250 employees at the start of 2021, and 30 new employees joined the company during the year.
Question 11
Considering all three years, which company had the highest annual profit?
correct answer:- 4
There are 15 girls and some boys among the graduating students in a class. They are planning a get-together, which can be either a 1-day event, or a 2-day event, or a 3-day event. There are 6 singers in the class, 4 of them are boys. There are 10 dancers in the class, 4 of them are girls. No dancer in the class is a singer.
Some students are not interested in attending the get-together. Those students who are interested in attending a 3-day event are also interested in attending a 2-day event; those who are interested in attending a 2-day event are also interested in attending a 1-day event.
The following facts are also known:
1. All the girls and 80% of the boys are interested in attending a 1-day event. 60% of the boys are interested in attending a 2-day event.
2. Some of the girls are interested in attending a 1-day event, but not a 2-day event; some of the other girls are interested in attending both.
3. 70% of the boys who are interested in attending a 2-day event are neither singers nor dancers. 60% of the girls who are interested in attending a 2-day event are neither singers nor dancers.
4. No girl is interested in attending a 3-day event. All male singers and 2 of the dancers are interested in attending a 3-day event.
5. The number of singers interested in attending a 2-day event is one more than the number of dancers interested in attending a 2-day event.
Question 12
How many boys are there in the class?
correct answer:- 50
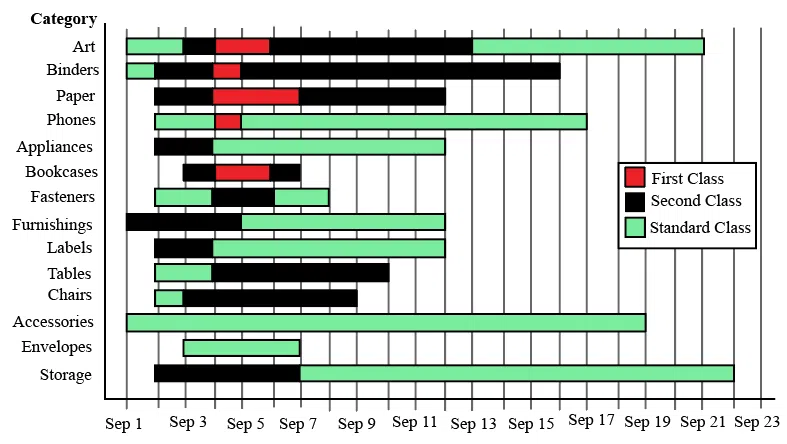
The different bars in the diagram above provide information about different orders in various categories (Art, Binders, ….) that were booked in the first two weeks of September of a store for one client. The colour and pattern of a bar denotes the ship mode (First Class / Second Class / Standard Class). The left end point of a bar indicates the booking day of the order, while the right end point indicates the dispatch day of the order. The difference between the dispatch day and the booking day (measured in terms of the number of days) is called the processing time of the order. For the same category, an order is considered for booking only after the previous order of the same category is dispatched. No two consecutive orders of the same category had identical ship mode during this period.
For example, there were only two orders in the furnishing category during this period. The first one was shipped in the Second Class. It was booked on Sep 1 and dispatched on Sep 5. The second order was shipped in the Standard class. It was booked on Sep 5 (although the order might have been placed before that) and dispatched on Sep 12. So the processing times were 4 and 7 days respectively for these orders.
Question 13
How many days between Sep 1 and Sep 14 (both inclusive) had no booking from this client considering all the above categories?
correct answer:- 6
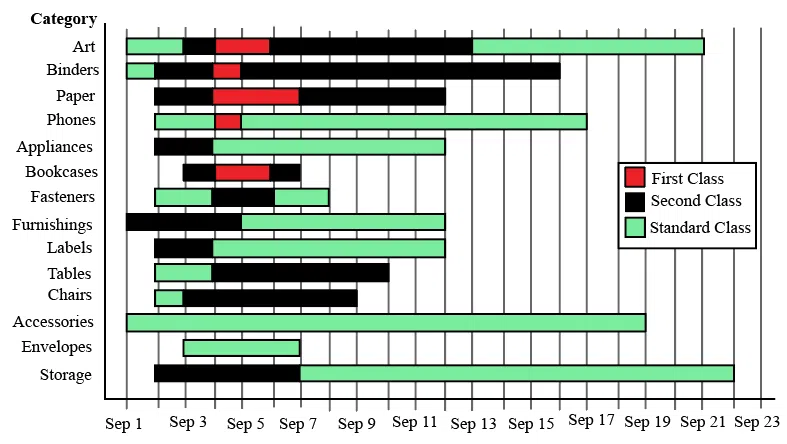
The different bars in the diagram above provide information about different orders in various categories (Art, Binders, ….) that were booked in the first two weeks of September of a store for one client. The colour and pattern of a bar denotes the ship mode (First Class / Second Class / Standard Class). The left end point of a bar indicates the booking day of the order, while the right end point indicates the dispatch day of the order. The difference between the dispatch day and the booking day (measured in terms of the number of days) is called the processing time of the order. For the same category, an order is considered for booking only after the previous order of the same category is dispatched. No two consecutive orders of the same category had identical ship mode during this period.
For example, there were only two orders in the furnishing category during this period. The first one was shipped in the Second Class. It was booked on Sep 1 and dispatched on Sep 5. The second order was shipped in the Standard class. It was booked on Sep 5 (although the order might have been placed before that) and dispatched on Sep 12. So the processing times were 4 and 7 days respectively for these orders.
Question 14
What was the average processing time of all orders in the categories which had only one type of ship mode?
correct answer:- 11
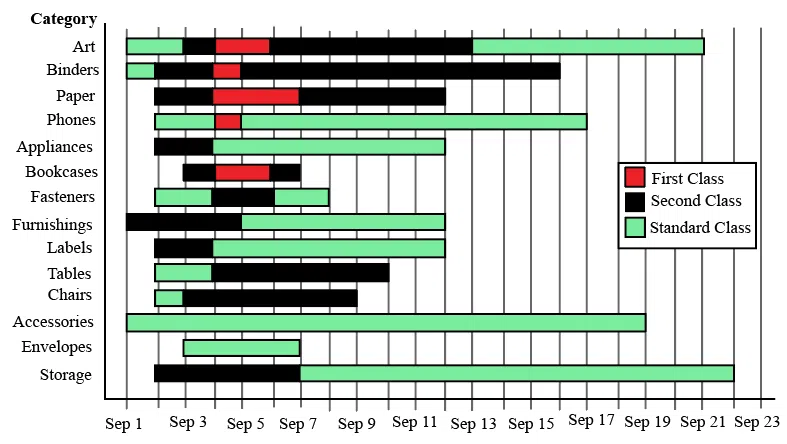
The different bars in the diagram above provide information about different orders in various categories (Art, Binders, ….) that were booked in the first two weeks of September of a store for one client. The colour and pattern of a bar denotes the ship mode (First Class / Second Class / Standard Class). The left end point of a bar indicates the booking day of the order, while the right end point indicates the dispatch day of the order. The difference between the dispatch day and the booking day (measured in terms of the number of days) is called the processing time of the order. For the same category, an order is considered for booking only after the previous order of the same category is dispatched. No two consecutive orders of the same category had identical ship mode during this period.
For example, there were only two orders in the furnishing category during this period. The first one was shipped in the Second Class. It was booked on Sep 1 and dispatched on Sep 5. The second order was shipped in the Standard class. It was booked on Sep 5 (although the order might have been placed before that) and dispatched on Sep 12. So the processing times were 4 and 7 days respectively for these orders.
Question 15
The sequence of categories -- Art, Binders, Paper and Phones -- in decreasing order of average processing time of their orders in this period is:
CAT Data Interpretation PYQs with Solutions: Conclusion
Practising CAT Data Interpretation PYQs with solutions is an important part of CAT 2026 DILR preparation. Previous year questions help aspirants understand actual exam-level difficulty, commonly tested DI formats and the calculation techniques required to solve complex data sets. Regular practice improves numerical reasoning, accuracy and confidence when approaching unfamiliar questions.
For effective preparation, combine CAT Data Interpretation previous year questions PDF practice with timed sectional tests and mock analysis. Focus on understanding the structure of each set, reducing unnecessary calculations and learning when to skip difficult questions. Improving set selection and calculation efficiency can make a significant difference to your overall DILR performance.
correct answer:- 2