Sign in
Please select an account to continue using cracku.in
↓ →
In the following, a year corresponds to 1st of January of that year.
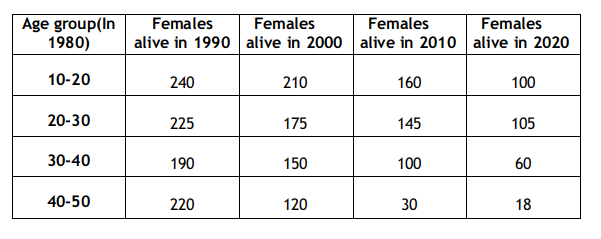
A study to determine the mortality rate for a disease began in 1980. The study chose 1000 males and 1000 females and followed them for forty years or until they died, whichever came first. The 1000 males chosen in 1980 consisted of 250 each of ages 10 to less than 20, 20 to less than 30, 30 to less than 40, and 40 to less than 50. The 1000 females chosen in 1980 also consisted of 250 each of ages 10 to less than 20, 20 to less than 30, 30 to less than 40,and 40 to less than 50.
The four figures below depict the age profile of those among the 2000 individuals who were still alive in 1990, 2000, 2010, and 2020. The blue bars in each figure represent the number of males in each age group at that point in time, while the pink bars represent the number of females in each age group at that point in time. The numbers next to the bars give the exact numbers being represented by the bars. For example, we know that 230 males among those tracked and who were alive in 1990 were aged between 20 and 30.
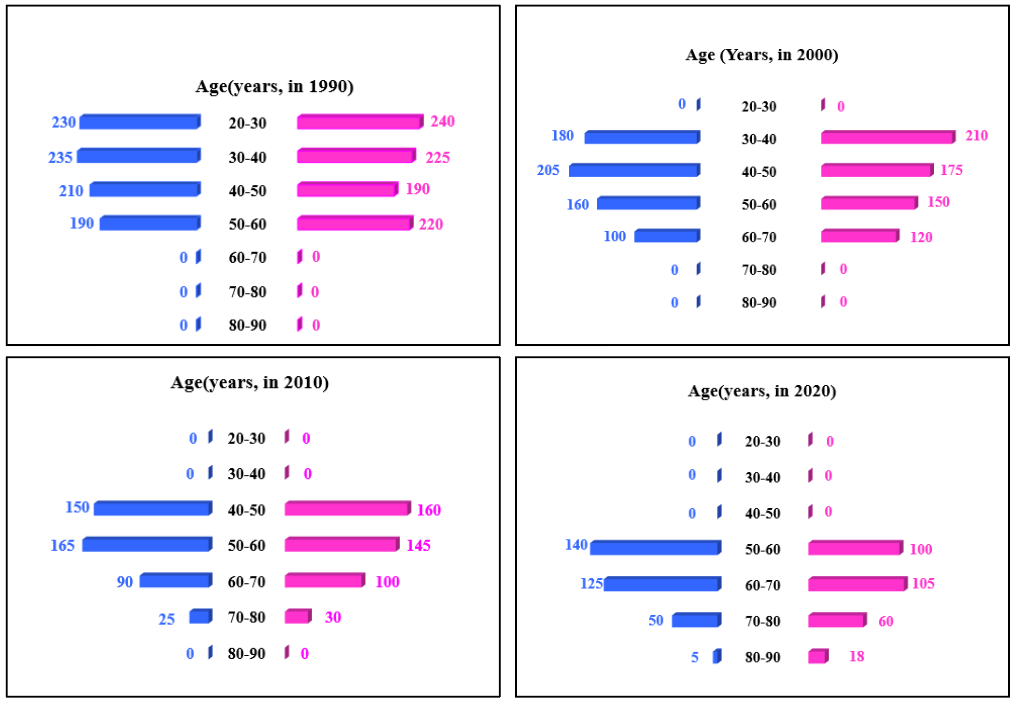
In 2000, what was the ratio of the number of dead males to dead females among those being tracked?

The total number of male and female test cases in 1980 = 1000
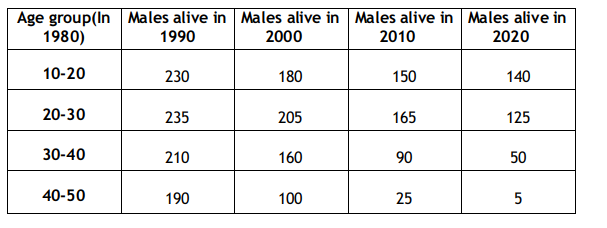
The total number of males alive in 2000 = 180 + 205 + 160 + 100 = 645
Thus, the number of dead males in 2000 = 1000 - 645 = 355
Similarly, the total number of dead females in 2000 = 1000 - (210 + 175 + 150 + 120) = 1000 - 655 = 345
Thus, the required ratio = 355 : 345 = 71 : 69.
Thus, the correct option is A.

Click on the Email ☝️ to Watch the Video Solution
Create a FREE account and get:
Book Free CAT Mentorship
Get personalized CAT strategy from a 99%iler
500+ students mentored
OTP Verification
Enter the 6-digit code sent to your phone
Booking Summary
Enter OTP
Didn't receive the OTP?

Educational materials for CAT preparation

Ask our AI anything

AI can make mistakes. Please verify important information.
AI can make mistakes. Please verify important information.


