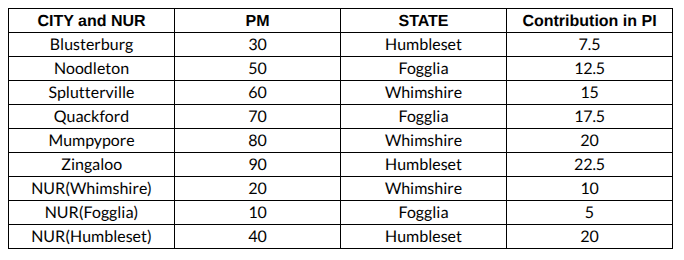
We are given that the PMs of the six cities, Blusterburg, Noodleton, Splutterville, Quackford, Mumpypore, and Zingaloo, are in increasing order.
We are also told there exists a single pair of NUR and city such that the PM of NUR is greater than the city and the NUR, city of the pair belongs to Humbleset. So, we can conclude that PMs of NURs of Whimshire and Fogglia are 10 and 20 in some order.
We also know that out of all the cities, Blusterburg has the lowest PM. So, the PM of Blusterberg has to be 30, and the PM of NUR of Humbleset has to be 40 for the above condition to be satisfied, and we can also conclude that Blusterberg is a city of Humbleset.
We can also conclude that the PMs of Noodleton, Splutterville, Quackford, Mumpypore, and Zingaloo are 50, 60, 70, 80, and 90, respectively.
We are given that in the PI calculation, cities have a contribution of 25% and NUR has a contribution of 50%. So, we can calculate the contribution of each city in the calculation of PI by dividing their PI value by 4, and the contribution of NUR can be calculated by dividing the PM value by 2.

We are given that all the PI values are unique integers, and Humbleset has the highest PI value, while Fogglia has the lowest.
For the PI value to be an integer, the cities with decimal contributions must be paired with another city with decimal contributions. Since all the decimals are 0.5, when two cities with 0.5 are added, the sum becomes 1, making the PI an integer.
The cities Splutterville and Mumpypoe must be from the same state; both have integral contributions towards the PI, and if they are added to a decimal, then the result will be a decimal, which should not be the case. These two cities have to belong to either the state of Whimshire or Fogglia, but their combined contribution towards PI is 15 + 20 = 35.
We already know that for the state of Humbleset, the PI is highest, and the two contributions towards the PI are 7.5 and 20, totalling 27.5.
There are three possibilities for the other city of Humbleset, which are Noodleton, Quackford and Zingaloo.
CASE 1: Noodleton
If the other city of Humbleset is Noodleton, then its PI would be 27.5 + 12.5 = 40.
We already obtained the sum of the PIs of one of the other 2 states to be 35 without including the PI of NUR. We know that the NUR contribution for that city would be either 5 or 10. If it is 5, then the PI of that state would be 40, and if it is 10, then the PI of that state would be 45.
However, we are told that the PI values are unique, and Humblest has the highest PI value; in either case, this condition is not satisfied.
So, we can eliminate the case of Noodleton being the second city of Humbleset.
CASE 2: Quackford
If the other city of Humbleset is Quackford, then its PI would be 27.5 + 17.5 = 45.
We already obtained the sum of the PIs of one of the other 2 states to be 35 without including the PI of NUR. We know that the NUR contribution for that city would be either 5 or 10. If it is 5, then the PI of that state would be 40, and if it is 10, then the PI of that state would be 45.
However, we are told that the PI values are unique, and Humblest has the highest PI value. So, we can eliminate the case of PI of NUR being 10 for the other state.
So, for Humbleset, the PI is 7.5 + 17.5 + 20 = 45.
For one of the other 2 states, the PI is 15 + 20 + 5 = 40
The PI of the other state can be calculated by adding all the leftover PIs, which is 12.5 + 22.5 + 10 = 45.
We can see that PI of Humbleton and one of the other two states is 45, which violates one of the conditions given.
So, we can eliminate the case of Quackford being the second city of Humbleset.
CASE 3: Zingaloo
If the other city of Humbleset is Zingaloo, then its PI would be 27.5 + 22.5 = 50.
We already obtained the sum of the PIs of one of the other 2 states to be 35 without including the PI of NUR. We know that the NUR contribution for that city would be either 5 or 10. If it is 5, then the PI of that state would be 40, and if it is 10, then the PI of that state would be 45.
If the PI of the other state is 40,
Then, for Humbleset, the PI is 7.5 + 22.5 + 20 = 50.
For one of the other 2 states, the PI is 15 + 20 + 5 = 40
The PI of the other state can be calculated by adding all the leftover PIs, which is 12.5 + 17.5 + 10 = 40.
We can see that PI of the other two states is 40, which violates one of the conditions given.
If the PI of the other state is 45,
Then, for Humbleset, the PI is 7.5 + 22.5 + 20 = 50.
For one of the other 2 states, the PI is 15 + 20 + 10 = 45
The PI of the other state can be calculated by adding all the leftover PIs, which is 12.5 + 17.5 + 5 = 35.
We can see that all the conditions are satisfied in this case, and we can conclude that Zingaloo is the second city of Humbleset, and also we know that PI is the least for Fogglia. So, the PI of Fogglia is 35, and the PI of Whimshire is 45.
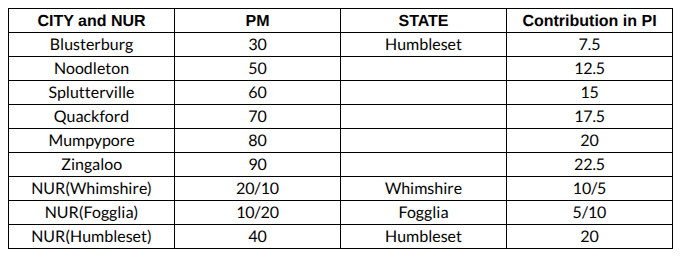
We can now assign the cities and the NURs, the states, and the PM values uniquely based on our calculations. After assigning the table looks like,

We can see that for all 6 cities and 3 NURs, the PMs and the city to which they belong can be identified uniquely. So, in total, we can identify the values uniquely for all 9 of them.
Hence, the correct answer is 9.