Sign in
Please select an account to continue using cracku.in
↓ →
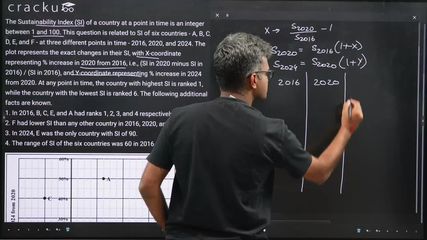
The Sustainability Index (SI) of a country at a point in time is an integer between 1 and 100. This question is related to SI of six countries - A, B, C, D, E, and F - at three different points in time - 2016, 2020, and 2024. The plot represents the exact changes in their SI, with X-coordinate representing % increase in 2020 from 2016, i.e., (SI in 2020 minus SI in 2016) / (SI in 2016), and Y-coordinate representing % increase in 2024 from 2020. At any point in time, the country with highest SI is ranked 1, while the country with the lowest SI is ranked 6. The following additional facts are known.
1. In 2016, B, C, E, and A had ranks 1, 2, 3, and 4 respectively.
2. F had lower SI than any other country in 2016, 2020, and 2024.
3. In 2024, E was the only country with SI of 90.
4. The range of SI of the six countries was 60 in 2016 as well as in 2024.

Let us assume the values of A, B, C, D, E and F to be a, b, c, d, e and f in 2016.
For A:
Value in 2020 = increased by 25% from 2016 = $$\left(1\ +\ \dfrac{25}{100}\right)a$$ = $$\dfrac{5}{4}a$$
Value in 2024 = increased by 50% from 2020 = $$\left(1\ +\ \dfrac{50}{100}\right)\times\ \dfrac{5a}{4}$$ = $$\dfrac{15}{8}a$$
For B:
Value in 2020 = decreased by 25% from 2016 = $$\left(1\ -\ \dfrac{25}{100}\right)b$$ = $$\dfrac{3}{4}b$$
Value in 2024 = decreased by 25% from 2020 = $$\left(1\ -\ \dfrac{25}{100}\right)\times\ \dfrac{3b}{4}$$ = $$\dfrac{9}{16}b$$
For C:
Value in 2020 = decreased by 20% from 2016 = $$\left(1\ -\ \dfrac{20}{100}\right)c$$ = $$\dfrac{4}{5}c$$
Value in 2024 = increased by 40% from 2020 = $$\left(1\ +\ \dfrac{40}{100}\right)\times\ \dfrac{4c}{5}$$ = $$\dfrac{28}{25}c$$
For D:
Value in 2020 = increased by 100% from 2016 = $$\left(1\ +\ \dfrac{100}{100}\right)d$$ = $$2d$$
Value in 2024 = increased by 20% from 2020 = $$\left(1\ +\ \dfrac{20}{100}\right)\times\ 2d$$ = $$\dfrac{12}{5}d$$
For E:
Value in 2020 = increased by 25% from 2016 = $$\left(1\ +\ \dfrac{25}{100}\right)e$$ = $$\dfrac{5}{4}e$$
Value in 2024 = increased by 20% from 2020 = $$\left(1\ +\ \dfrac{20}{100}\right)\times\ \dfrac{5e}{4}$$ = $$\dfrac{3}{2}e$$
For F:
Value in 2020 = increased by 100% from 2016 = $$\left(1\ +\ \dfrac{100}{100}\right)f$$ = $$2f$$
Value in 2024 = decreased by 25% from 2020 = $$\left(1\ -\ \dfrac{25}{100}\right)\times\ 2f$$ = $$\dfrac{3}{2}f$$
We are given that the value of E is 90 in 2024. We can calculate the value of e as,
$$\dfrac{3e}{2}\ =\ 90$$
$$e\ =\ 60$$
The value of E in 2016 is 60, and its value in 2020 can be calculated as,
$$\dfrac{5e}{4}\ =\ \dfrac{5}{4}\times\ 60\ =\ 75$$
We are given that B, C, E, and A had ranks 1, 2, 3, and 4, respectively, in 2016, and F has the lowest rank(6) in all the years.
Putting the values in the table, we get,

SI of E in 2016 is 60.
Hence, the correct answer is 60.
Click on the Email ☝️ to Watch the Video Solution
Create a FREE account and get:
Book Free CAT Mentorship
Get personalized CAT strategy from a 99%iler
500+ students mentored
OTP Verification
Enter the 6-digit code sent to your phone
Booking Summary
Enter OTP
Didn't receive the OTP?

Educational materials for CAT preparation

Ask our AI anything

AI can make mistakes. Please verify important information.
AI can make mistakes. Please verify important information.