Top 20+ XAT Charts Questions with Solutions PDF
XAT Chart-based questions are a critical part of the Data Interpretation section, focusing on a candidate's ability to analyze and interpret data presented in various chart formats such as bar graphs, line graphs, pie charts, scatter plots, and combination charts. These questions test a range of skills, including understanding trends, comparing values, calculating proportions, and drawing logical conclusions. To check similar important topics, checking with the XAT syllabus will help you understand better and plan your preparation accordingly.
Along with this, we recommend you to solve questions from XAT previous papers. This will help you in knowing the question types and various type of questions being asked in the actual exam. We've compiled all the questions with detailed solutions from previous exams to help you with your preparation. You could download them as PDF and solve them as per your convenience.
XAT 2020 Charts questions
Read the information given below and answer the 3 associated questions.
The following graph depicts sector-wise percentage contributions to the gross domestic product (GDP) of nine nations, labelled “Nation A”, “Nation B” and so on. It is known that these nations are Brazil, China, France, Germany, India, Japan, Russia, the UK and the USA, but not necessarily in the same order.

The following, however, are known:
i) The GDPs of the nine nations (in US $ trillion) are:

ii) China has the highest agriculture sector GDP, valued at US $1 trillion, followed respectively by the USA and India
iii) In terms of percentage contribution to the respective nations’ GDPs by their service sectors, the UK and France are respectively the first and the second
iv) Nation A, Nation B and Nation G have the same GDP
v) The GDP of India’s industry sector is lower than the GDP of Russia’s industry sector. However,it is larger than that of Brazil's industry sector
Question 1
Based on the given information, how many nations can be uniquely identified?
correct answer:-1
Instruction for set 1:
Read the information given below and answer the 3 associated questions.
The following graph depicts sector-wise percentage contributions to the gross domestic product (GDP) of nine nations, labelled “Nation A”, “Nation B” and so on. It is known that these nations are Brazil, China, France, Germany, India, Japan, Russia, the UK and the USA, but not necessarily in the same order.
The following, however, are known:
i) The GDPs of the nine nations (in US $ trillion) are:
ii) China has the highest agriculture sector GDP, valued at US $1 trillion, followed respectively by the USA and India
iii) In terms of percentage contribution to the respective nations’ GDPs by their service sectors, the UK and France are respectively the first and the second
iv) Nation A, Nation B and Nation G have the same GDP
v) The GDP of India’s industry sector is lower than the GDP of Russia’s industry sector. However,it is larger than that of Brazil's industry sector
Question 2
Based on the given information, which of the following CANNOT be ruled out?
correct answer:-4
Instruction for set 1:
Read the information given below and answer the 3 associated questions.
The following graph depicts sector-wise percentage contributions to the gross domestic product (GDP) of nine nations, labelled “Nation A”, “Nation B” and so on. It is known that these nations are Brazil, China, France, Germany, India, Japan, Russia, the UK and the USA, but not necessarily in the same order.
The following, however, are known:
i) The GDPs of the nine nations (in US $ trillion) are:
ii) China has the highest agriculture sector GDP, valued at US $1 trillion, followed respectively by the USA and India
iii) In terms of percentage contribution to the respective nations’ GDPs by their service sectors, the UK and France are respectively the first and the second
iv) Nation A, Nation B and Nation G have the same GDP
v) The GDP of India’s industry sector is lower than the GDP of Russia’s industry sector. However,it is larger than that of Brazil's industry sector
Question 3
Which of the following information, when considered in addition to the given information, does not allow us to completely identify the nine nations in the graph?
correct answer:-1
XAT 2019 Charts questions
The break-up of the students in a university by subject major is given in the polar pie-chart. The bar chart shows the number of students who major in physics by geographic location.


Question 1
How many students major in chemistry?
correct answer:-2
Instruction for set 1:
The break-up of the students in a university by subject major is given in the polar pie-chart. The bar chart shows the number of students who major in physics by geographic location.
Question 2
If the proportion of physics majors who are from Delhi is the same as the proportion of engineering majors who are from Delhi, how many engineering majors are from Delhi?
correct answer:-4
Instruction for set 1:
The break-up of the students in a university by subject major is given in the polar pie-chart. The bar chart shows the number of students who major in physics by geographic location.
Question 3
12% of all students are from Chennai. What is the largest possible percentage of economics students that can be from Chennai, rounded off to the nearest integer?
correct answer:-1
XAT 2018 Charts questions
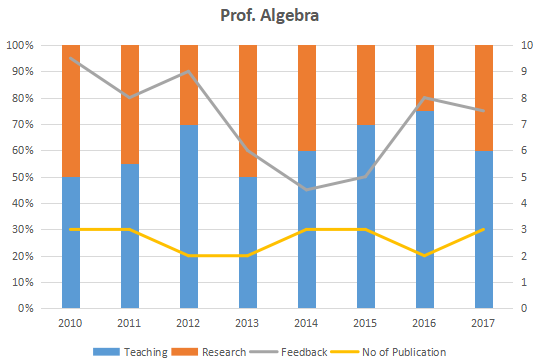
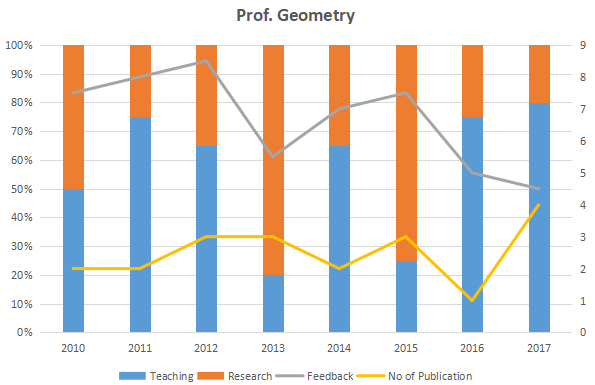
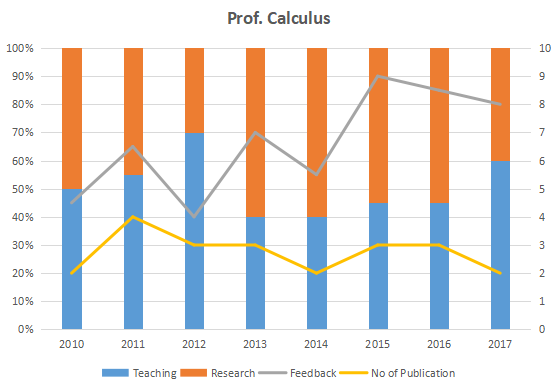
The graph below represent the performance of four professors, across years. measured on four variables: Percentage of time spent on research, teaching, feedback on (a scale of 10. right-hand side) and number of publications (right-hand side). Assume that the cumulative time spent per year on research and teaching activities are same for all four professors and each of them taught only one course of 90 classroom hours.
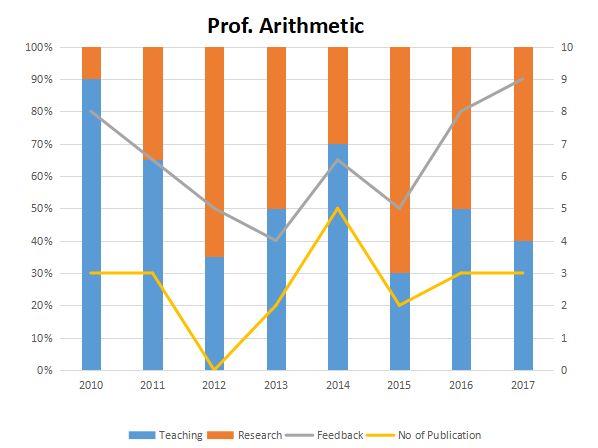
Question 1
Which of the following, shows the maximum year to year percentage growth in feedback?
correct answer:-3
Instruction for set 1:
The graph below represent the performance of four professors, across years. measured on four variables: Percentage of time spent on research, teaching, feedback on (a scale of 10. right-hand side) and number of publications (right-hand side). Assume that the cumulative time spent per year on research and teaching activities are same for all four professors and each of them taught only one course of 90 classroom hours.
Question 2
Count the number of instances in which "annual decreasing efforts in research" is accompanied with "annual increase in feedback"?
correct answer:-3
Instruction for set 1:
The graph below represent the performance of four professors, across years. measured on four variables: Percentage of time spent on research, teaching, feedback on (a scale of 10. right-hand side) and number of publications (right-hand side). Assume that the cumulative time spent per year on research and teaching activities are same for all four professors and each of them taught only one course of 90 classroom hours.
Question 3
Research efficiency is the ratio of cumulative number of publication for a period of 3 years to the cumulative number of hours spent on research activity in those 3 years. Which of the following professors is the least efficient researcher for the period 2015 to 2017?
correct answer:-1
XAT 2016 Charts questions
Study the graph below and answer the questions that follow:
This graph depicts the last eight years’ annual salaries (in Rs. lacs.) offered to student during campus placement. Every year 100 students go through placement process. However, at least one of them fails to get placed. The salaries of all unplaced students are marked zero and represented in the graph.

The bold line in the graph presents Mean salaries at various years.
Question 1
In which year were a maximum number of students offered salaries between Rs. 20 to Rs.30 lacs(both inclusive)?
correct answer:-5
Instruction for set 1:
Study the graph below and answer the questions that follow:
This graph depicts the last eight years’ annual salaries (in Rs. lacs.) offered to student during campus placement. Every year 100 students go through placement process. However, at least one of them fails to get placed. The salaries of all unplaced students are marked zero and represented in the graph.
The bold line in the graph presents Mean salaries at various years.
Question 2
Identify the years in which the annual median salary is higher by at least 60% than the average salary of the preceding year?
correct answer:-2
Instruction for set 1:
Study the graph below and answer the questions that follow:
This graph depicts the last eight years’ annual salaries (in Rs. lacs.) offered to student during campus placement. Every year 100 students go through placement process. However, at least one of them fails to get placed. The salaries of all unplaced students are marked zero and represented in the graph.
The bold line in the graph presents Mean salaries at various years.
Question 3
Identify the number of years in which the difference between the average salaries of the top 25% and the bottom 25% is more than Rs. 20 lacs:
correct answer:-5
Instruction for set 1:
Study the graph below and answer the questions that follow:
This graph depicts the last eight years’ annual salaries (in Rs. lacs.) offered to student during campus placement. Every year 100 students go through placement process. However, at least one of them fails to get placed. The salaries of all unplaced students are marked zero and represented in the graph.
The bold line in the graph presents Mean salaries at various years.
Question 4
If the average salary is computed excluding students with no offers, in how many years will the new average salary be greater than the existing median salary? Refer the table below for number of students without offers.

correct answer:-1
XAT 2014 Charts questions
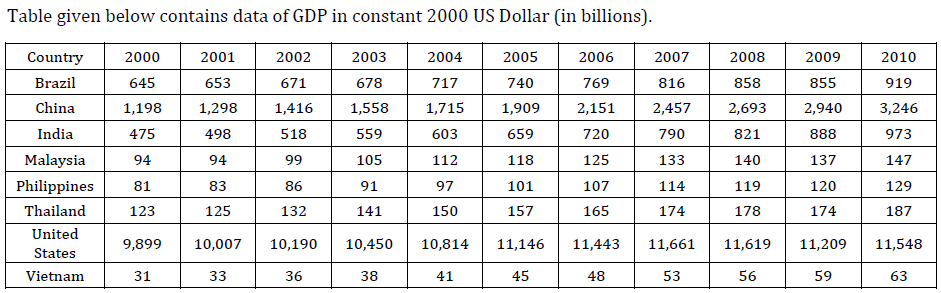
Answer the questions based on the following information given below.
The exhibit given below compares the countries (first column) on different economic indicators (first row), from 2000-2010. A bar represents data for one year and a missing bar indicates missing data. Within an indicator, all countries have same scale.
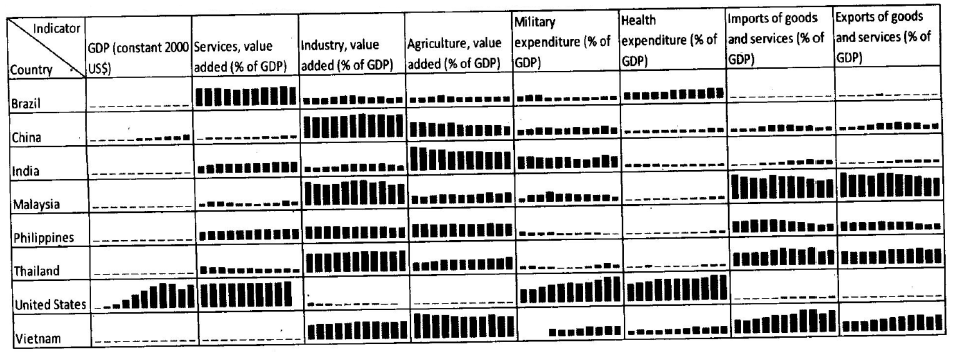
Question 1
Which of the following countries, after United States, has the highest spending on military as % of GDP, in the period 2000-2010?
correct answer:-3
Instruction for set 1:
Answer the questions based on the following information given below.
The exhibit given below compares the countries (first column) on different economic indicators (first row), from 2000-2010. A bar represents data for one year and a missing bar indicates missing data. Within an indicator, all countries have same scale.
Question 2
Which country (and which year) has witnessed maximum year-to-year decline in “industry as percentage of GDP”? Given that the maximum value of industry as percentage of GDP is 49.7% and the minimum value of industry as percentage of GDP is 20.02%, in the chart above.
correct answer:-4
Instruction for set 1:
Answer the questions based on the following information given below.
The exhibit given below compares the countries (first column) on different economic indicators (first row), from 2000-2010. A bar represents data for one year and a missing bar indicates missing data. Within an indicator, all countries have same scale.
Question 3
Which of the following countries has shown maximum increase in the “services, value added as % of GDP” from year 2000 to year 2010?
correct answer:-2
XAT 2012 Charts questions
based on the following information
The following graphs shows the revenue (in $ million) of three companies in their initial six years of operations, in an economy which is characterized by a persistent inflation.

Question 1
In 2010, which could be a valid statement about the revenues (adjusted for inflation) of these
three companies?
correct answer:-5
Instruction for set 1:
based on the following information
The following graphs shows the revenue (in $ million) of three companies in their initial six years of operations, in an economy which is characterized by a persistent inflation.
Question 2
The difference in the average percentage increase in revenues, from 4th to 6th year, of Yahoo and Facebook is:
correct answer:-2
Instruction for set 1:
based on the following information
The following graphs shows the revenue (in $ million) of three companies in their initial six years of operations, in an economy which is characterized by a persistent inflation.
Question 3
What would have been Facebook’s revenue (in $ million) in its sixth year of operation if the
company had matched Google’s percentage growth in revenues from the fifth to the sixth year?
Choose the option that is nearest to the answer.
correct answer:-1
Instruction for set 2:
The following pie chart shows the percentage distribution of runs scored by a batsman in a test innings.

Question 4
If the batsman has scored a total of 306 runs, how
many 4s and 6s did he hit?
correct answer:-5