Study the graph below and answer the questions that follow:
This graph depicts the last eight years’ annual salaries (in Rs. lacs.) offered to student during campus placement. Every year 100 students go through placement process. However, at least one of them fails to get placed. The salaries of all unplaced students are marked zero and represented in the graph.

The bold line in the graph presents Mean salaries at various years.
Identify the number of years in which the difference between the average salaries of the top 25% and the bottom 25% is more than Rs. 20 lacs:
Solution
Let's tabulate the information given in the graph,
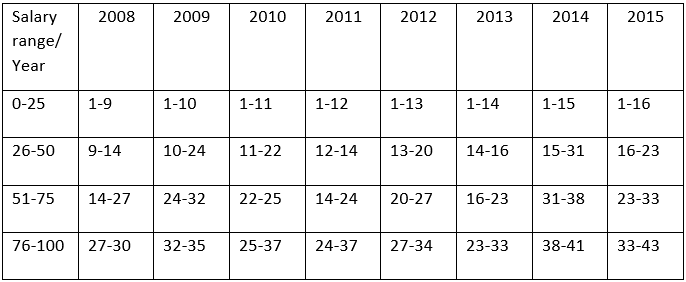
The number of years cannot be calculated with precision as the distribution pattern is unknown .
Hence E is the correct answer
Get AI Help
Create a FREE account and get:
- All Quant Formulas and shortcuts PDF
- 15 XAT previous papers with solutions PDF
- XAT Trial Classes for FREE

XAT Quant Questions | XAT Quantitative Ability
XAT DILR Questions | LRDI Questions For XAT
XAT Verbal Ability Questions | VARC Questions For XAT
Free XAT DILR Questions
Book Free CAT Mentorship
Get personalized CAT strategy from a 99%iler
500+ students mentored
OTP Verification
Enter the 6-digit code sent to your phone
Booking Summary
Enter OTP
Didn't receive the OTP?