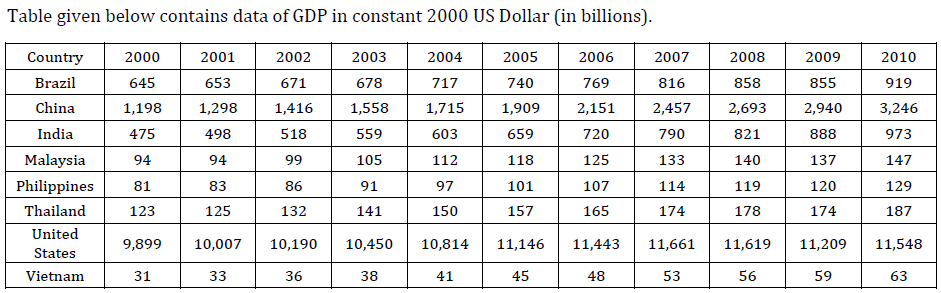
Answer the questions based on the following information given below.
The exhibit given below compares the countries (first column) on different economic indicators (first row), from 2000-2010. A bar represents data for one year and a missing bar indicates missing data. Within an indicator, all countries have same scale.
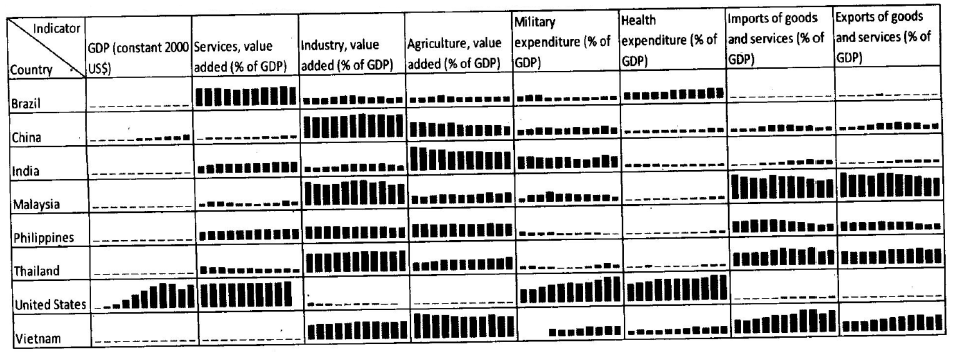
Which of the following countries has shown maximum increase in the “services, value added as % of GDP” from year 2000 to year 2010?
Solution
From the chart for “services, value-added as a % of GDP” we can see that every other country, except India, has a constant value or decrease from 2000-10, whereas India shows a slow but gradual increase.
Hence, option B is the answer.
Get AI Help
Video Solution
Click on the Email ☝️ to Watch the Video Solution
Create a FREE account and get:
- All Quant Formulas and shortcuts PDF
- 15 XAT previous papers with solutions PDF
- XAT Trial Classes for FREE

XAT Quant Questions | XAT Quantitative Ability
XAT DILR Questions | LRDI Questions For XAT
XAT Verbal Ability Questions | VARC Questions For XAT
Free XAT DILR Questions
Book Free CAT Mentorship
Get personalized CAT strategy from a 99%iler
500+ students mentored
OTP Verification
Enter the 6-digit code sent to your phone
Booking Summary
Enter OTP
Didn't receive the OTP?


