Top 15+ XAT Data Interpretation Questions with Solutions PDF
XAT Data Interpretation Questions are one of the common type of questions that keep appearing every year in the exam. These are close to CAT Data Interpretation sets where questions on bargraph, piechart, etc. are asked in the exam. To check some other common important sets that appear in XAT QA & DI section, checking with the XAT syllabus will help you further. To ace these kind of sets basic arithmetic skills are necessary and some prior experience will help.
We have compiled all the previously repeated questions with detailed solutions. You could also download them as PDF. We advise aspirants to take XAT mock tests and assessing where to focus further. These tests will help you in familiarizing with the kind of questions that are asked in the exam.
XAT 2023 Data Interpretation questions
Go through the information given below, and answer the THREE questions that follow.
Comprehension:
The table captures Age and Gender distribution of Covid Positive Cases in a country. However, a part of data is missing, represented through unknown categories.

*Includes <5 cases in age group 19-30 and 51 -60 who reported gender as Other/Transgender. * In unknown age category, the ratio of males (unknown age category) and females (unknown age catego1y) to total unknown cases (unknown age category) is same as the ratio of males (All) and females (All) to the total (Total Confirmed Covid Positive Cases).
Question 1
In unknown age category, the ratio of males (unknown age category) and females (unknown age category) to total unknown cases (unknown age category) is same as the ratio of males (All) and females (All) to the total (total confirmed covid positive cases). How many females were in the unknown age category (rounded to nearest integer)?
correct answer:-4
Instruction for set 1:
Go through the information given below, and answer the THREE questions that follow.
Comprehension:
The table captures Age and Gender distribution of Covid Positive Cases in a country. However, a part of data is missing, represented through unknown categories.
*Includes <5 cases in age group 19-30 and 51 -60 who reported gender as Other/Transgender. * In unknown age category, the ratio of males (unknown age category) and females (unknown age catego1y) to total unknown cases (unknown age category) is same as the ratio of males (All) and females (All) to the total (Total Confirmed Covid Positive Cases).
Question 2
In which age category, the percentage of female covid patients is the HIGHEST?
correct answer:-5
Instruction for set 1:
Go through the information given below, and answer the THREE questions that follow.
Comprehension:
The table captures Age and Gender distribution of Covid Positive Cases in a country. However, a part of data is missing, represented through unknown categories.
*Includes <5 cases in age group 19-30 and 51 -60 who reported gender as Other/Transgender. * In unknown age category, the ratio of males (unknown age category) and females (unknown age catego1y) to total unknown cases (unknown age category) is same as the ratio of males (All) and females (All) to the total (Total Confirmed Covid Positive Cases).
Question 3
Which of the following is true for “unknown gender Category”?
1. Unknown age group patients are less likely (percentage term) to provide information about gender than any other age category
2. Between 31 and 80, when age increases patients, in percentage terms, are less likely to provide information about gender
3. Elderly (81+) category patients are more likely to give information about gender than 0-18 age group
correct answer:-4
XAT 2022 Data Interpretation questions
Read the following scenario and answer the THREE questions that follow.
The enrolment of students (in 1000s) at each of the five universities named — MPU, JSU, LTU, PKU and TRU — during each of the eight years from 2014 to 2021 is represented in the following chart. The names of these universities are not shown in the chart, instead they are labelled Univ 1, Univ 2, Univ 3, Univ 4 and Univ 5.
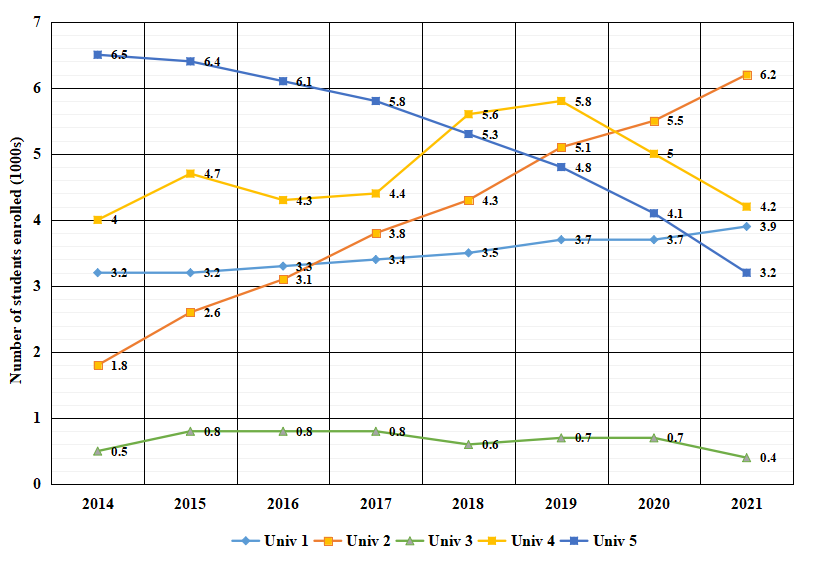
However, these four pieces of information are available:
W: The magnitudes of TRU's and MPU's net change in enrolment between 2014 and 2021 are the closest among any two universities.
X: LTU had the same enrolment in consecutive years at least twice between 2014 and 2021.
Y: The increase in JSU's enrolment from 2015 to 2019 is about 50% of TRU's total enrolment in 2020.
Z: The enrolment in one of LTU and PKU had a steady decline between 2014 and 2021, while the enrolment in the other had no decline between any two consecutive years in the same period.
Question 1
Which of the five universities can Univ 4 possibly be?
correct answer:-4
Instruction for set 1:
Read the following scenario and answer the THREE questions that follow.
The enrolment of students (in 1000s) at each of the five universities named — MPU, JSU, LTU, PKU and TRU — during each of the eight years from 2014 to 2021 is represented in the following chart. The names of these universities are not shown in the chart, instead they are labelled Univ 1, Univ 2, Univ 3, Univ 4 and Univ 5.
However, these four pieces of information are available:
W: The magnitudes of TRU's and MPU's net change in enrolment between 2014 and 2021 are the closest among any two universities.
X: LTU had the same enrolment in consecutive years at least twice between 2014 and 2021.
Y: The increase in JSU's enrolment from 2015 to 2019 is about 50% of TRU's total enrolment in 2020.
Z: The enrolment in one of LTU and PKU had a steady decline between 2014 and 2021, while the enrolment in the other had no decline between any two consecutive years in the same period.
Question 2
Which Univ’s enrolment was around twice that of LTU in 2014?
correct answer:-2
Instruction for set 1:
Read the following scenario and answer the THREE questions that follow.
The enrolment of students (in 1000s) at each of the five universities named — MPU, JSU, LTU, PKU and TRU — during each of the eight years from 2014 to 2021 is represented in the following chart. The names of these universities are not shown in the chart, instead they are labelled Univ 1, Univ 2, Univ 3, Univ 4 and Univ 5.
However, these four pieces of information are available:
W: The magnitudes of TRU's and MPU's net change in enrolment between 2014 and 2021 are the closest among any two universities.
X: LTU had the same enrolment in consecutive years at least twice between 2014 and 2021.
Y: The increase in JSU's enrolment from 2015 to 2019 is about 50% of TRU's total enrolment in 2020.
Z: The enrolment in one of LTU and PKU had a steady decline between 2014 and 2021, while the enrolment in the other had no decline between any two consecutive years in the same period.
Question 3
Which amongst the pieces of information mentioned below, if removed, will notprevent us from uniquely identifying the five universities?
correct answer:-3
Instruction for set 2:
Read the following scenario and answer the THREE questions that follow.
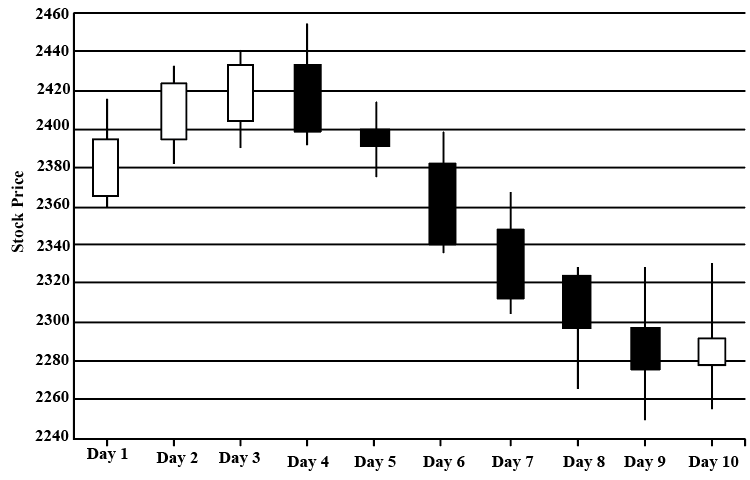
The given candlestick chart depicts the prices of a particular stock over 10 consecutive days. A candlestick comprises of a rectangular box pieced by a line. The top and bottom ends of the line respectively indicate the maximum and minimum prices of the stock on that day, while the horizontal edges of the rectangle correspond to the stock's opening and closing prices. If the rectangle is white, the opening price is lower than the closing price, but if the rectangle is black, then it is the other way around.
Using the above information, answer the questions that follow:
Question 4
Which day saw the maximum percentage increase in the stock price at closing from the opening?
correct answer:-3
Instruction for set 2:
Read the following scenario and answer the THREE questions that follow.
The given candlestick chart depicts the prices of a particular stock over 10 consecutive days. A candlestick comprises of a rectangular box pieced by a line. The top and bottom ends of the line respectively indicate the maximum and minimum prices of the stock on that day, while the horizontal edges of the rectangle correspond to the stock's opening and closing prices. If the rectangle is white, the opening price is lower than the closing price, but if the rectangle is black, then it is the other way around.
Using the above information, answer the questions that follow:
Question 5
What is the highest magnitude of change over two consecutive days (for example,Day 1 → Day 3 or Day 5 → Day 7), in the maximum price touched by the stock during the 10-day period (choose the closest amongst the options given)?
correct answer:-2
Instruction for set 2:
Read the following scenario and answer the THREE questions that follow.
The given candlestick chart depicts the prices of a particular stock over 10 consecutive days. A candlestick comprises of a rectangular box pieced by a line. The top and bottom ends of the line respectively indicate the maximum and minimum prices of the stock on that day, while the horizontal edges of the rectangle correspond to the stock's opening and closing prices. If the rectangle is white, the opening price is lower than the closing price, but if the rectangle is black, then it is the other way around.
Using the above information, answer the questions that follow:
Question 6
On which day is the ratio of the maximum price to the opening price, the highest across the ten days?
correct answer:-3
XAT 2021 Data Interpretation questions
Read the following scenario and answer the three questions that follow.
The following plot describes the height (in cm), weight (in kg), age (in years) and gender (F for female, M for male) of 20 patients visiting a hospital.

A person’s body mass index (BMI) is calculated as weight (in kg) divided by squared height (measured in square metres). For example, a person weighing 100 kg and of height 100 cm (1m) will have a BMI of 100. A person with BMI less than or equal to 18.5 is considered as underweight, above 18.5 but less than or equal to 25 as normal weight, above 25 but less than or equal to 30 as overweight, and above 30 as obese.
Question 1
The average age of the female patients who weigh 50 kg or above is approximately
correct answer:-1
Instruction for set 1:
Read the following scenario and answer the three questions that follow.
The following plot describes the height (in cm), weight (in kg), age (in years) and gender (F for female, M for male) of 20 patients visiting a hospital.
A person’s body mass index (BMI) is calculated as weight (in kg) divided by squared height (measured in square metres). For example, a person weighing 100 kg and of height 100 cm (1m) will have a BMI of 100. A person with BMI less than or equal to 18.5 is considered as underweight, above 18.5 but less than or equal to 25 as normal weight, above 25 but less than or equal to 30 as overweight, and above 30 as obese.
Question 2
The highest BMI among all patients is approximately
correct answer:-4
Instruction for set 1:
Read the following scenario and answer the three questions that follow.
The following plot describes the height (in cm), weight (in kg), age (in years) and gender (F for female, M for male) of 20 patients visiting a hospital.
A person’s body mass index (BMI) is calculated as weight (in kg) divided by squared height (measured in square metres). For example, a person weighing 100 kg and of height 100 cm (1m) will have a BMI of 100. A person with BMI less than or equal to 18.5 is considered as underweight, above 18.5 but less than or equal to 25 as normal weight, above 25 but less than or equal to 30 as overweight, and above 30 as obese.
Question 3
The BMI of the oldest person considered as normal weight is approximately
correct answer:-1
Instruction for set 2:
Read the following scenario and answer the three questions that follow.
A quick survey at the end of a purchase at buyagain.com asks the following three questions to each shopper:
1. Are you shopping at the website for the first time? (YES or NO)
2. Specify your gender: (MALE or FEMALE)
3. How satisfied are you? (HAPPY, NEUTRAL or UNHAPPY)
240 shoppers answer the survey, among whom 65 are first time shoppers. Furthermore:
i. The ratio of the numbers of male to female shoppers is 1 : 2 while the ratio of the numbers of unhappy, happy and neutral shoppers is 3 : 4 : 5
ii. The ratio of the numbers of happy first-time male shoppers, happy returning male shoppers, unhappy female shoppers, neutral male shoppers, neutral female shoppers and happy female shoppers is 1 : 1 : 4 : 4 : 6 : 6
iii. Among the first-time shoppers, the ratio of the numbers of happy male, neutral male, unhappy female and the remaining female shoppers is 1 : 1 : 1 : 2, while the number of happy first-time female shoppers is equal to the number of unhappy first-time male shoppers
Question 4
What is the number of happy male shoppers?
correct answer:-4
Instruction for set 2:
Read the following scenario and answer the three questions that follow.
A quick survey at the end of a purchase at buyagain.com asks the following three questions to each shopper:
1. Are you shopping at the website for the first time? (YES or NO)
2. Specify your gender: (MALE or FEMALE)
3. How satisfied are you? (HAPPY, NEUTRAL or UNHAPPY)
240 shoppers answer the survey, among whom 65 are first time shoppers. Furthermore:
i. The ratio of the numbers of male to female shoppers is 1 : 2 while the ratio of the numbers of unhappy, happy and neutral shoppers is 3 : 4 : 5
ii. The ratio of the numbers of happy first-time male shoppers, happy returning male shoppers, unhappy female shoppers, neutral male shoppers, neutral female shoppers and happy female shoppers is 1 : 1 : 4 : 4 : 6 : 6
iii. Among the first-time shoppers, the ratio of the numbers of happy male, neutral male, unhappy female and the remaining female shoppers is 1 : 1 : 1 : 2, while the number of happy first-time female shoppers is equal to the number of unhappy first-time male shoppers
Question 5
Which among the following is the lowest?
correct answer:-1
Instruction for set 2:
Read the following scenario and answer the three questions that follow.
A quick survey at the end of a purchase at buyagain.com asks the following three questions to each shopper:
1. Are you shopping at the website for the first time? (YES or NO)
2. Specify your gender: (MALE or FEMALE)
3. How satisfied are you? (HAPPY, NEUTRAL or UNHAPPY)
240 shoppers answer the survey, among whom 65 are first time shoppers. Furthermore:
i. The ratio of the numbers of male to female shoppers is 1 : 2 while the ratio of the numbers of unhappy, happy and neutral shoppers is 3 : 4 : 5
ii. The ratio of the numbers of happy first-time male shoppers, happy returning male shoppers, unhappy female shoppers, neutral male shoppers, neutral female shoppers and happy female shoppers is 1 : 1 : 4 : 4 : 6 : 6
iii. Among the first-time shoppers, the ratio of the numbers of happy male, neutral male, unhappy female and the remaining female shoppers is 1 : 1 : 1 : 2, while the number of happy first-time female shoppers is equal to the number of unhappy first-time male shoppers
Question 6
Which among the following cannot be determined uniquely?
correct answer:-3