Read the following scenario and answer the THREE questions that follow.
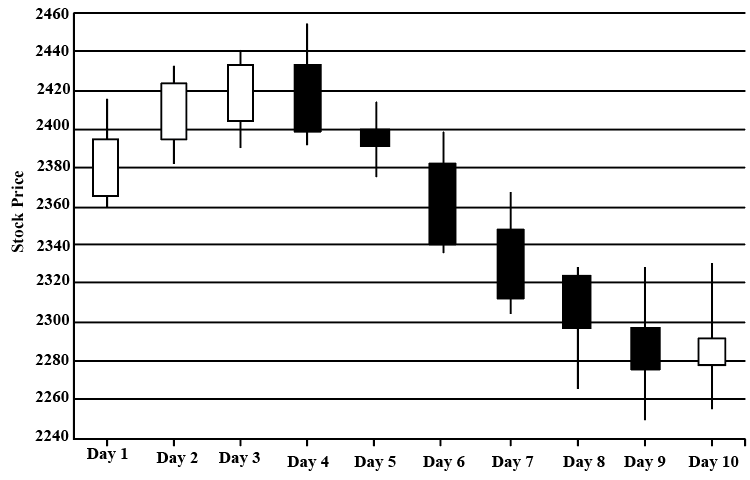
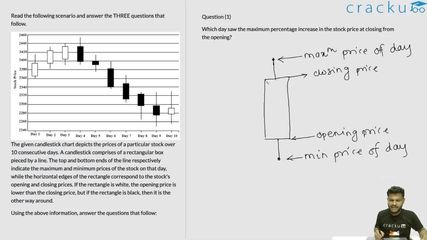
The given candlestick chart depicts the prices of a particular stock over 10 consecutive days. A candlestick comprises of a rectangular box pieced by a line. The top and bottom ends of the line respectively indicate the maximum and minimum prices of the stock on that day, while the horizontal edges of the rectangle correspond to the stock's opening and closing prices. If the rectangle is white, the opening price is lower than the closing price, but if the rectangle is black, then it is the other way around.
Using the above information, answer the questions that follow:
Which day saw the maximum percentage increase in the stock price at closing from the opening?
Solution
Going by the cases in the option for the five days :
Day 1 : (Opening price, Closing Price ) : (2365, 2395)
Day 2 : (Opening price, Closing Price ) : ( 2395, 2425 )
Day 6 : (Opening price, Closing Price ) : ( Closing price is lower than the opening price )
Day 7 : (Opening price, Closing Price ) : ( Closing price is lower than the opening price )
Day 10 : (Opening price, Closing Price ) : (2277.5, 2292.5)
The percentage increase for day 1 : $$\frac{\left(2395-2365\right)}{\left(2365\right)}\cdot100\ =\ 1.26\ \%$$
The percentage increase for day 2 : $$\frac{\left(2425-2395\right)}{\left(2395\right)}\cdot100\ =\ 1.252\ \%$$
The percentage increase for day 10 : $$\frac{\left(2492.5-2377.5\right)}{\left(2377.5\right)}\cdot100\ =\ 0.65\%$$
Hence Day 1 is the highest
Get AI Help
Video Solution
Click on the Email ☝️ to Watch the Video Solution
Create a FREE account and get:
- All Quant Formulas and shortcuts PDF
- 15 XAT previous papers with solutions PDF
- XAT Trial Classes for FREE

XAT Quant Questions | XAT Quantitative Ability
XAT DILR Questions | LRDI Questions For XAT
XAT Verbal Ability Questions | VARC Questions For XAT
Free XAT Quant Questions
Book Free CAT Mentorship
Get personalized CAT strategy from a 99%iler
500+ students mentored
OTP Verification
Enter the 6-digit code sent to your phone
Booking Summary
Enter OTP
Didn't receive the OTP?