Read the following scenario and answer the THREE questions that follow.
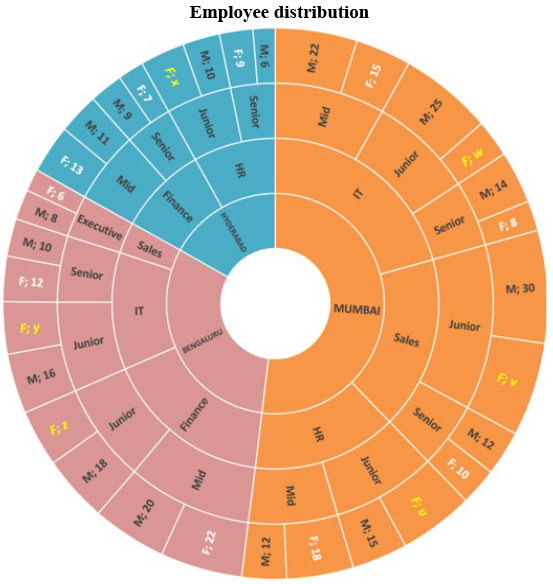
Light Chemicals is an industrial paint supplier with presence in three locations: Mumbai, Hyderabad and Bengaluru. The sunburst chart below shows the distribution of the number of employees of different departments of Light Chemicals. There are four departments: Finance, IT, HR and Sales. The employees are deployed in four ranks: junior, mid, senior and executive. The chart shows four levels: location, department, rank and gender (M: male, F: female). At every level, the number of employees at any location/department/rank/gender are proportional to the corresponding area of the region represented in the chart.
Due to some issues with the software, the data on junior female employees have gone missing. Notice that there are junior female employees in Mumbai HR, Sales and IT departments, Hyderabad HR department, and Bengaluru IT and Finance departments: the corresponding missing numbers are marked u, v, w, x, y and z in the diagram, respectively.
It is also known that:
a) Light Chemicals has a total of 210 junior employees.
b) Light Chemicals has a total of 146 employees in the IT department.
c) Light Chemicals has a total of 77 employees in the Hyderabad office.
d) In the Mumbai office, the number of junior female employees is 55.