Top XAT DI with connected data sets Questions with Solutions PDF
XAT Data Interpretation (DI) section often features questions based on connected data sets, which require analyzing information presented across multiple formats such as tables, graphs, charts, or passages. These questions demand the ability to identify relationships and dependencies between different data points. For example, a connected data set might include a pie chart detailing a company’s revenue distribution across regions, alongside a table showing yearly sales growth percentages.
These type of questions usually do not appear in the CAT but are common in the XAT. Checking with the XAT syllabus will help you in knowing similar kind of questions that are not very common in other entrance tests. We at Cracku are committed to help our students both pre and post examination with our resources and tools. Another important post-exam recommendation we'd like to make is to check our XAT score calculator that'll help you to know to your expected scores and percentiles after the exam.
XAT 2013 DI with connected data sets questions
The BIG and Colourful Company
You are running "BIG and Colourful (BnC)" company that sells books to customers through three retail formats:
a. You can buy books from bookstores,
b. You can buy books from supermarket,
c. You can order books over the Internet (Online).
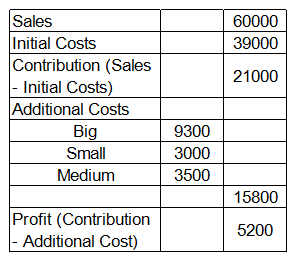
Your manager has an interesting way of classifying expenses: some of the expenses are classified in terms of size: Big, Small and Medium; and others are classified in terms of the colors, Red, Yellow, Green and Violet. The company has a history of categorizing overall costs into initial costs and additional costs. Additional costs are equal to the sum of Big, Small and Medium expenses. There are two types of margins, contribution (sales minus initial costs) and profit (contribution minus additional costs). Given below is the data about sales and costs of BnC:
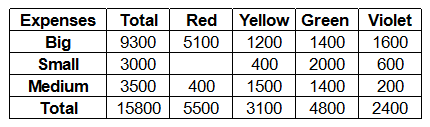
Each of the Big, Small and Medium cost is categorized by the manager into Red, Yellow, Green and Violet costs. Breakdown of the additional costs under these headings is shown in the table below:
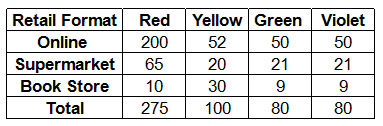
Red, Yellow, Green and Violet costs are allocated to different retail formats. These costs are apportioned in the ratio of number of units consumed by each retail format. The number of units consumed by each retail format is given in the table below:
Question 1
Read the following statements:
Statement I. Online store accounted for 50% of the sales at BnC and the ratio of supermarket sales and book store sales is 1:2.
Statement II. Initial Cost is allocated in the ratio of sales. If you want to calculate the profit/loss from the different retail formats, then
correct answer:-3
Instruction for set 1:
The BIG and Colourful Company
You are running "BIG and Colourful (BnC)" company that sells books to customers through three retail formats:
a. You can buy books from bookstores,
b. You can buy books from supermarket,
c. You can order books over the Internet (Online).
Your manager has an interesting way of classifying expenses: some of the expenses are classified in terms of size: Big, Small and Medium; and others are classified in terms of the colors, Red, Yellow, Green and Violet. The company has a history of categorizing overall costs into initial costs and additional costs. Additional costs are equal to the sum of Big, Small and Medium expenses. There are two types of margins, contribution (sales minus initial costs) and profit (contribution minus additional costs). Given below is the data about sales and costs of BnC:
Each of the Big, Small and Medium cost is categorized by the manager into Red, Yellow, Green and Violet costs. Breakdown of the additional costs under these headings is shown in the table below:
Red, Yellow, Green and Violet costs are allocated to different retail formats. These costs are apportioned in the ratio of number of units consumed by each retail format. The number of units consumed by each retail format is given in the table below:
Question 2
What is the profit/loss from "online" sales? (Use data from previous question if needed)
correct answer:-4
Instruction for set 1:
The BIG and Colourful Company
You are running "BIG and Colourful (BnC)" company that sells books to customers through three retail formats:
a. You can buy books from bookstores,
b. You can buy books from supermarket,
c. You can order books over the Internet (Online).
Your manager has an interesting way of classifying expenses: some of the expenses are classified in terms of size: Big, Small and Medium; and others are classified in terms of the colors, Red, Yellow, Green and Violet. The company has a history of categorizing overall costs into initial costs and additional costs. Additional costs are equal to the sum of Big, Small and Medium expenses. There are two types of margins, contribution (sales minus initial costs) and profit (contribution minus additional costs). Given below is the data about sales and costs of BnC:
Each of the Big, Small and Medium cost is categorized by the manager into Red, Yellow, Green and Violet costs. Breakdown of the additional costs under these headings is shown in the table below:
Red, Yellow, Green and Violet costs are allocated to different retail formats. These costs are apportioned in the ratio of number of units consumed by each retail format. The number of units consumed by each retail format is given in the table below:
Question 3
Which retail format is least profit making for BnC?
correct answer:-2
Instruction for set 1:
The BIG and Colourful Company
You are running "BIG and Colourful (BnC)" company that sells books to customers through three retail formats:
a. You can buy books from bookstores,
b. You can buy books from supermarket,
c. You can order books over the Internet (Online).
Your manager has an interesting way of classifying expenses: some of the expenses are classified in terms of size: Big, Small and Medium; and others are classified in terms of the colors, Red, Yellow, Green and Violet. The company has a history of categorizing overall costs into initial costs and additional costs. Additional costs are equal to the sum of Big, Small and Medium expenses. There are two types of margins, contribution (sales minus initial costs) and profit (contribution minus additional costs). Given below is the data about sales and costs of BnC:
Each of the Big, Small and Medium cost is categorized by the manager into Red, Yellow, Green and Violet costs. Breakdown of the additional costs under these headings is shown in the table below:
Red, Yellow, Green and Violet costs are allocated to different retail formats. These costs are apportioned in the ratio of number of units consumed by each retail format. The number of units consumed by each retail format is given in the table below:
Question 4
Which retail format gives the highest profit for BnC?
correct answer:-1