Read the following scenario and answer the three questions that follow.
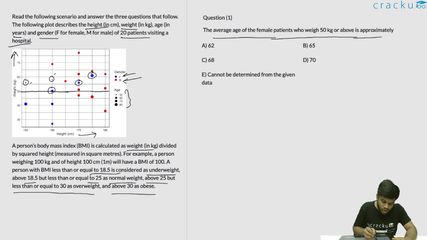
The following plot describes the height (in cm), weight (in kg), age (in years) and gender (F for female, M for male) of 20 patients visiting a hospital.

A person’s body mass index (BMI) is calculated as weight (in kg) divided by squared height (measured in square metres). For example, a person weighing 100 kg and of height 100 cm (1m) will have a BMI of 100. A person with BMI less than or equal to 18.5 is considered as underweight, above 18.5 but less than or equal to 25 as normal weight, above 25 but less than or equal to 30 as overweight, and above 30 as obese.
Solution
The BMI of 1st oldest person= $$\frac{40}{\left(1.5\right)^2}=\ 17.77$$
The BMI of next oldest person = $$\frac{61}{\left(1.75\right)^2}=19.9$$
Get AI Help
Video Solution
Click on the Email ☝️ to Watch the Video Solution
Create a FREE account and get:
- All Quant Formulas and shortcuts PDF
- 15 XAT previous papers with solutions PDF
- XAT Trial Classes for FREE

XAT Quant Questions | XAT Quantitative Ability
XAT DILR Questions | LRDI Questions For XAT
XAT Verbal Ability Questions | VARC Questions For XAT
Free XAT Quant Questions
Book Free CAT Mentorship
Get personalized CAT strategy from a 99%iler
500+ students mentored
OTP Verification
Enter the 6-digit code sent to your phone
Booking Summary
Enter OTP
Didn't receive the OTP?