Read the information given below and answer the 3 associated questions.
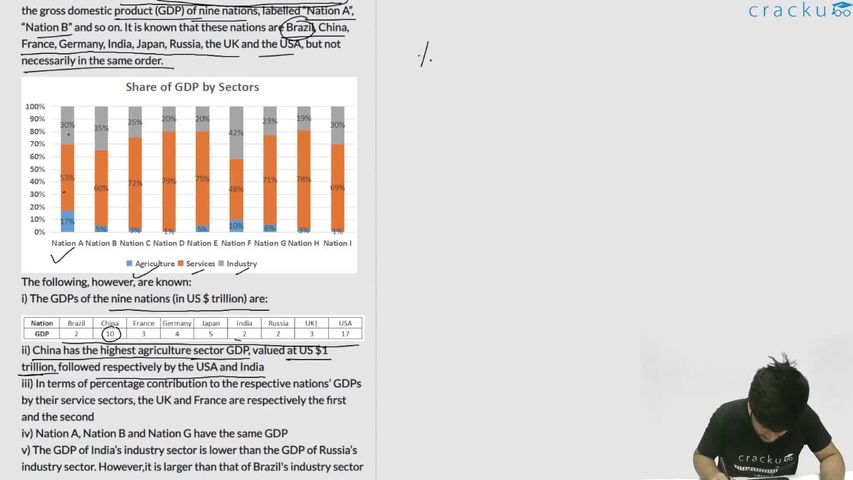
The following graph depicts sector-wise percentage contributions to the gross domestic product (GDP) of nine nations, labelled “Nation A”, “Nation B” and so on. It is known that these nations are Brazil, China, France, Germany, India, Japan, Russia, the UK and the USA, but not necessarily in the same order.

The following, however, are known:
i) The GDPs of the nine nations (in US $ trillion) are:

ii) China has the highest agriculture sector GDP, valued at US $1 trillion, followed respectively by the USA and India
iii) In terms of percentage contribution to the respective nations’ GDPs by their service sectors, the UK and France are respectively the first and the second
iv) Nation A, Nation B and Nation G have the same GDP
v) The GDP of India’s industry sector is lower than the GDP of Russia’s industry sector. However,it is larger than that of Brazil's industry sector
Based on the given information, which of the following CANNOT be ruled out?
Solution
FRom ii, China is F.
FRom iv and v, India must be A, Brazil must be G and Russia must be B.
India's GDP due to agriculture = 17% of 2 trillion =0.34 trillion.
FRom i, USA GDP due to agriculture> 0.34 trillion and <1 trillion i.e. it's percentage must be >2% and less than 5.8%
So, USA can be C/E/H.
From point 3, UK must be D and France must be H=> U.S.A must be C/E.
Now, Germany and Japan can be C or I or E.
.'. Everything except option D can be ruled out.
Get AI Help
Video Solution
Click on the Email ☝️ to Watch the Video Solution
Create a FREE account and get:
- All Quant Formulas and shortcuts PDF
- 15 XAT previous papers with solutions PDF
- XAT Trial Classes for FREE

XAT Quant Questions | XAT Quantitative Ability
XAT DILR Questions | LRDI Questions For XAT
XAT Verbal Ability Questions | VARC Questions For XAT
Free XAT DILR Questions
Book Free CAT Mentorship
Get personalized CAT strategy from a 99%iler
500+ students mentored
OTP Verification
Enter the 6-digit code sent to your phone
Booking Summary
Enter OTP
Didn't receive the OTP?