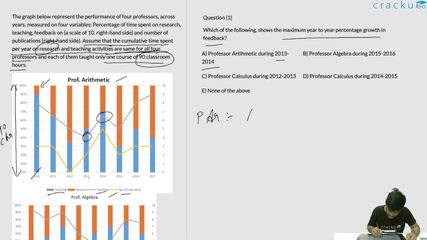
The graph below represent the performance of four professors, across years. measured on four variables: Percentage of time spent on research, teaching, feedback on (a scale of 10. right-hand side) and number of publications (right-hand side). Assume that the cumulative time spent per year on research and teaching activities are same for all four professors and each of them taught only one course of 90 classroom hours.
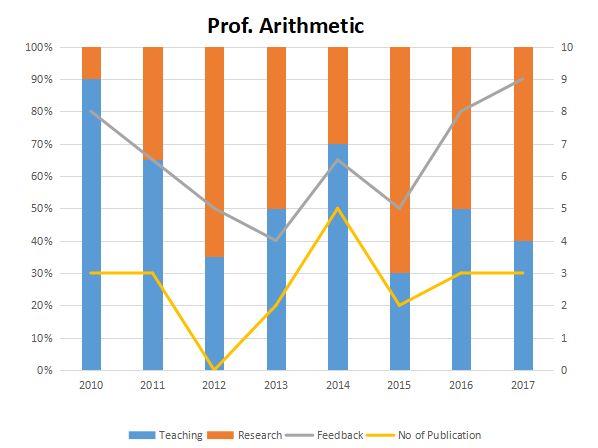
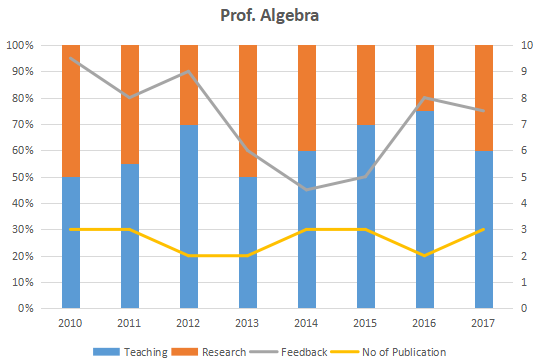
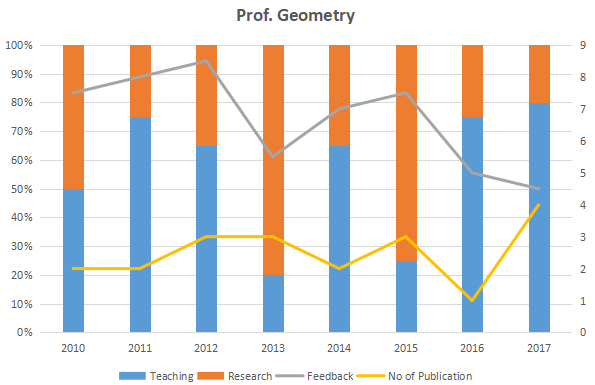
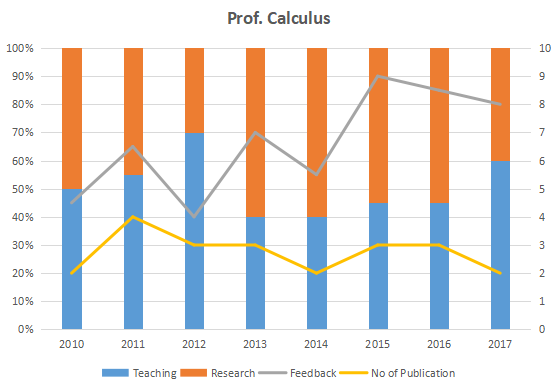
Which of the following, shows the maximum year to year percentage growth in feedback?
Solution
Let the required percentage be P.
Option A: PA = (6.5 - 4) * 100/ 4 = 62.5%
Option B: PB = (8 - 5) * 100/ 5 = 60%
Option C: PC = (7 - 4) * 100/ 4 = 75%
Option D: PD = (9 - 5.5) * 100/ 5.5 = 63.63%
Thus, option C shows the maximum year-on-year growth and is the answer.
Get AI Help
Video Solution
Click on the Email ☝️ to Watch the Video Solution
Create a FREE account and get:
- All Quant Formulas and shortcuts PDF
- 15 XAT previous papers with solutions PDF
- XAT Trial Classes for FREE

XAT Quant Questions | XAT Quantitative Ability
XAT DILR Questions | LRDI Questions For XAT
XAT Verbal Ability Questions | VARC Questions For XAT
Free XAT DILR Questions
Book Free CAT Mentorship
Get personalized CAT strategy from a 99%iler
500+ students mentored
OTP Verification
Enter the 6-digit code sent to your phone
Booking Summary
Enter OTP
Didn't receive the OTP?


