How does the passage characterize the historical perception of anchovies?
SRCC GBO Sample Paper 2026
Read the passage carefully and answer the following questions
To the physician Tobias Venner, in his 'Via recta ad vitam longam' of 1620, they were ‘Anchovas, the famous meat of drunkards’... The association with alcohol has been a durable one. In Spain, tapas - often anchovy-based and formerly offered free - have long been a staple of the taberna.
What makes the anchovy so special? ... Arguably, it can be reduced to one word: umami. Anchovies, however they are preserved, have some of the highest levels of umami - really, an amino acid called glutamate - of any food on the planet. It’s an addictive pleasure.
Although both the Phoenicians and Greeks discovered the anchovy’s pleasures, it was the Romans who put it on the food map through their fish sauces, of which garum is the best known. The sauces were probably all produced using the same method... Its potency proved ambivalent: Horace called it a ‘table delicacy’; he also said ‘It stinks’...
Either way, it was big business: the garum workshops in Tróia, on the Portuguese coast, produced some 35,000 litres annually. Where Rome went, garum went, too: traces of it have been found everywhere from Hadrian’s Wall to Salzburg, from Switzerland to Palestine. Academics disagree on the fish used in the sauce, but then so do classical authorities. The assumption has long been that garum, supposedly an elite food, was made from suitably expensive fish, such as mackerel. But Beckman argues that archaeological evidence from Pompeii - according to Pliny the Elder an important production centre in the ancient world - suggests otherwise. In Pompeii, anchovies predominated.
Any history of food is always also a history of class, and anchovies have long been subject to crashing condescension. Few have been as blunt as the Italian doctor Alessandro Petronio, who wrote in 1592 that they were ‘food for the poor’ and ‘for rough people, accustomed to exertion’. [...]
Anchovies have also been markers of political identity. Anthimus, a sixth-century Byzantine exile, banished garum from the royal diet in his medical treatise. Perhaps the recommendation reflected a personal antipathy, but perhaps it also symbolised a political rejection of Roman culture among the coming peoples of northern Europe. South of the Alps the Lombards, originally from southern Scandinavia but now identifying with the might of the old empire, went the other way, buying and selling garum along the river Po and using it as part payment for its army officers.
Beckman doggedly traces the love affair with the anchovy from the streets of Pompeii to the wood-fired ovens of California’s Spago and Chez Panisse. After a survey of its role in food culture from ancient Rome through to medieval Europe, subsequent chapters trace the same arc through French, British, Spanish, Italian and American culinary history. His practice of trawling through century after century of each country’s cookery books does become repetitive, although it also proves an effective way of tracking changes in taste and fashion. But like all stories about food, the anchovy’s tale is ultimately about how what we eat powerfully underpins our sense of identity, security and comfort.
Solution
Evaluation of options
Option A: While the passage mentions anchovies in high-end cuisine, it doesn't suggest experts throughout history primarily appreciated them.
Option B: The passage shows anchovies' status changing over time and cultures, from "food for the poor" to ingredients in elite Roman sauces and modern restaurants. This accurately represents how the passage characterised historical perception of Anchovies
Option C: Although Mediterranean cuisines are mentioned, the passage indicates varied use and perception across different cultures and time periods.
Option D: The passage does mention anchovies as "food for the poor," but also discusses their use in elite contexts, so this option is too narrow.
Therefore, Option B is the correct answer.
What does the passage suggest about the evolution of garum from ancient Rome to the early medieval period?
Solution
Evaluation of options:
Option A: While some evidence suggests garum may have lost prominence in certain areas, the passage highlights its persistence in regions like Lombard-controlled areas, indicating its popularity was not uniformly declining. Instead, it shows variability based on cultural and political factors.
Option B:. The passage indicates that garum's cultural significance was more complex, as seen in its adoption by some groups (e.g., Lombards) and rejection by others (e.g., Anthimus's recommendation against its use).
Option C: The passage explicitly discusses how garum's use or rejection often mirrored broader political or cultural affiliations. For example, Anthimus's rejection of garum symbolized a break from Roman culture, while the Lombards' use of garum underscored their alignment with Roman traditions.
Option D: While the passage mentions the wide geographical spread of garum, there is no specific indication that it was adapted or modified to local preferences. The focus is more on its cultural symbolism and class associations rather than culinary adaptations.
Therefore, Option C is the correct answer.
What does the author's treatment of garum suggest about the study of food history?
Solution
Evaluation of options:
Option A: The passage talks about garum being used by different classes, not just elites. For example, it mentions anchovies, which were considered a "poor person's food."
Option B: The passage repeatedly connects the history of garum to political identity, cultural affiliations, and class distinctions, showing that food history is intertwined with broader societal and cultural narratives. Examples include garum's rejection by Anthimus as a political statement and its use by the Lombards to align with Roman traditions.
Option C:The passage mentions umami but focuses more on cultural and social meanings of food, not just its nutrition.
Option D: The passage highlights changes and differences in how garum and anchovies were used, not just their continued presence.
Therefore, Option B is the correct answer.

How does the passage characterize umami in relation to anchovies?
Solution
Evaluation of options:
Option A: The passage does mention the scientific basis of umami (glutamate), but it focuses on its role in anchovies' historical and cultural appeal, not as a recent discovery.
Option B: While umami may have contributed to their popularity, the passage attributes ancient consumption to other factors, such as their use in fish sauces like garum and their widespread availability.
Option C: The passage highlights umami as a defining quality of anchovies, making them addictive and appealing across cultures and historical periods, despite differing opinions about their class associations or political meanings.
Option D: The passage discusses umami as a general quality of anchovies, regardless of preparation or geographic origin.
The passage shows that umami is a key reason why anchovies have remained popular over time, transcending cultural and social differences. This makes C the best answer.
Please select a suitable word from the given choices which stands closest in meaning to the word 'doggedly'
in the given passage.
Solution
Evaluation of options:
Option A: The passage describes how Beckman "doggedly traces the love affair with the anchovy," which implies that he follows this historical exploration with unwavering effort and determination. "tenaciously" best matches this sense of relentless focus.
Option B: "Casually" conveys a relaxed or informal approach, which is the opposite of the focused and determined effort described in the passage.
Option C: "Indifferently" suggests a lack of interest or enthusiasm, which contradicts the sense of dedication conveyed by "doggedly."
Option D: While "elegantly" denotes style and grace, it does not align with the sense of determination and persistence that "doggedly" implies.
Therefore, Option A is the correct answer.
For the following questions answer them individually
The following questions have three blanks which are to be filled with the correct form of words. Choose the words that fit the blanks to make it grammatically and contextually correct. (Note: Options are given in the respective orders)
The sudden increase in fuel prices has ________ many households to reconsider their budgets, as the rising costs are ________ their monthly savings.
Solution
Option A: Incorrect because "encouraged" means a positive motivation, which doesn’t match the context of struggling households.
Option B: Correct because "forced" aligns with the necessity of revisiting budgets due to financial strain, and "affecting" fits the negative impact on savings.
Option C: Incorrect because "boosting" suggests an increase in savings, contrary to the context of rising costs reducing savings.
Option D: Incorrect because "allowed" and "improving" mean positive outcomes, which are inconsistent with the sentence's negative tone.

Fill in the blank with an appropriate word from the given options:
The politician’s speech was so ___________ that it failed to inspire any real change among the crowd.
Solution
The sentence says the speech didn’t inspire any real change, so we need a word that means dull or uninspiring. "Lackluster" fits perfectly because it means something that’s not exciting or impressive.
The other options don’t work because:
"Galvanizing" means something that gets people excited.
"Captivating" means something that grabs attention.
"Dynamic" means energetic or lively, which would have inspired the crowd.
So, "lackluster" is the best choice.
The following questions have three blanks which are to be filled with the correct form of words. Choose the words that fit the blanks to make it grammatically and contextually correct. (Note: Options are given in the respective orders)
In the era of rapid technological advancement, it is ________ to acknowledge that certain industries are ________ by innovation, while others ________ to adopt even the most basic technological tools.
Solution
Option A: Incorrect because "prudent" means caution rather than inevitability, and "resist" does not align with the implied difficulty or inability to adopt tools.
Option B: Incorrect because "overshadowed" suggests being appeared more important, which doesn't fit the context of industries benefiting from innovation.
Option C: Correct because "inevitable" suits the unstoppable nature of progress, "driven" fits industries influenced by innovation, and "struggle" captures the difficulty faced by some.
Option D: Incorrect because "hampered" implies obstruction rather than innovation, and "hesitate" does not reflect the context of ongoing challenges.
Fill in the blanks with an appropriate word from the given options:
The group ______________ ideas for the presentation when their leader encouraged them to think ______________ for a creative solution.
Solution
In the sentence, we're using the past continuous tense ("was brainstorming") because it describes an action happening in the past when something else occurred. The group was in the middle of brainstorming ideas when their leader gave them a suggestion. The past continuously helps us focus on the action already in progress.
The phrase "think outside the box " means to think creatively or look at things from a new perspective. When leaders say this, they encourage the group to move beyond conventional ideas and develop something unique or innovative. It's a common phrase used in brainstorming or problem-solving contexts.

Select the part of the sentence that is grammatically incorrect. If there is no error in the sentence, select (5) No error.
While some critics argue that /(1) literature reflects social norms accurately, /(2) others insist it has the power of /(3) shaping cultural values instead. (4) No error
Solution
The correct phrase should be "the power to shape" because "power" is typically followed by the infinitive form of a verb (e.g., "the power to change," "the power to inspire").
Using "of shaping" means a different structure, which is not appropriate here.
Correct sentence: While some critics argue that literature reflects social norms accurately, others insist it has the power to shape cultural values instead.
Choose the option that best replaces the phrase in bold without changing the meaning of the sentence below:
His explanation left us all in the lurch during the meeting.
Solution
In this sentence, the phrase "left us in the lurch" means that the explanation was unclear or left the group in a difficult situation where they were uncertain about what to do next. It's an idiom that refers to being abandoned or left without help, especially in a confusing or challenging situation.
So, the best choice here is "confused and uncertain" because it captures the feeling of being left in a tough spot without understanding or clarity. The other options, like "highly impressed" or "deeply motivated," don't fit the context of being left in a confusing or difficult situation.
Select the most appropriate option that can substitute the underlined segment in the given sentence.
The speaker’s motivational talk kindled the flame of interest among the young entrepreneurs attending the seminar.
Solution
The phrase "kindled the flame" is somewhat correct in tone but not the most appropriate in this context.
The phrase "ignited the spark" better conveys the idea of inspiring interest, which is more commonly associated with motivational talks.

Match the words with their correct meanings:
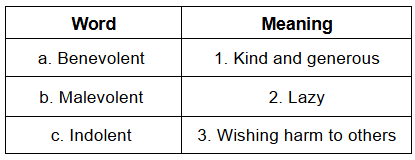
Solution
a. Benevolent: "Benevolent" means kind and charitable.
b. Malevolent: "Malevolent" means wanting to harm others.
c. Indolent: "Indolent" means lazy.
In the sentence, which word-segment could mean 'skating on thin ice'?
Even though Rahul knew the unpredictable nature of the stock market, he realized he was skating on thin ice by investing heavily in volatile shares.
Solution
Skating on thin ice" is basically an idiom meaning which means to be in a precarious or risky situation.
The other options do not hint at the sense of danger or risk that is present in the sentence.
Select the grammatically correct sentences.
1. Despite the rain, they decided to go for a hike in the mountains.
2. The manager along with his team are attending the conference next week.
3. The car, which was parked outside the restaurant, needs to be repaired.
4. Neither the teacher nor the students was ready for the surprise test.
5. The book on the shelf belong to my cousin.
Solution
1: Correct.
2: The subject "The manager" is singular, so the correct verb should be "is" instead of "are."
3: Correct
4: When "neither... nor" is used, the verb agrees with the noun closest to it, so "were" should be used: "Neither the teacher nor the students were ready."
5: The subject "book" is singular, so the verb should be "belongs" rather than "belong."

The following sentences, when arranged in the correct order, form a coherent paragraph. Find the correct order.
A) As the world moves towards automation, many fear that the rise of machines may lead to widespread job losses and economic instability.
B) While technological advancement has always led to shifts in the job market, it has also historically created new opportunities for human labour.
C) However, such fears are often rooted in an oversimplified view of technology’s impact, ignoring the potential for innovation to drive growth.
D) Understanding this interplay between automation and job creation requires a nuanced perspective, one that considers not just losses but the potential for new industries to emerge.
Solution
Sentence A introduces the topic with a commonly discussed concern about automation.
Sentence C follows by questioning this fear and suggesting that it is based on a limited understanding.
Sentence B then brings historical evidence to refute the fear, showing that technological change has always spurred job creation.
Sentence D concludes by highlighting the importance of a nuanced view that factors in both challenges and opportunities.
Correct Order: ACBD
Select the most appropriate option to fill in the blank.
The new manager promised to _________ changes to the outdated policies and introduce more efficient practices.
Solution
"Bring about" means to cause something to happen, which fits the context of implementing changes.
Here, the manager is implementing the changes where the old policies will be replaced by the updated ones.
In the following question, out of the four alternatives, select the one which best expresses the meaning of the given word.
Ubiquitous
Solution
The word "ubiquitous" means something that is present, appearing, or found everywhere. It refers to something widespread or commonly encountered, so "widespread" is the most suitable synonym. Other options, like "rare," "distinct," and "unknown," contradict the meaning of "ubiquitous," making them incorrect choices.
Choose the option that best replaces the phrase in bold without changing the meaning of the sentence below:
The manager decided to throw in the towel after the project failed despite all the efforts.
Solution
The phrase "throw in the towel" means to give up or admit defeat, especially after trying hard without success. It comes from boxing, where a trainer throws in the towel to stop the fight.
So, "admit defeat" (Option C) is the best choice because it matches the idea of giving up after a failed effort. "Stopping the project" (Option A) is close but doesn't fully capture the idea of admitting defeat, which is why it’s not the best fit.
Select the option which best captures the meaning of the idiom in bold.
After months of planning, the team’s grand proposal was rejected, leaving them to go back to the drawing board.
Solution
The idiom "back to the drawing board" means to starting over, typically after a failure or an unsuccessful attempt.
Find the odd one out:
Solution
If you look at the words "benevolent," "compassionate," and "altruistic," they all describe positive qualities related to kindness, caring for others, or helping people without expecting anything in return.
However, "malicious" means wanting to cause harm or do something bad, which is the complete opposite of the other words. So, it stands out as the odd one out here.
Four sentences are given below. Of these, three sentences, when arranged properly, make a meaningful and coherent paragraph. Identify the odd one out.
A: Renewable energy sources such as solar and wind are increasingly being adopted to combat climate change.
B: Countries around the world are setting ambitious targets to reduce carbon emissions and transition to greener energy solutions.
C: Fossil fuel consumption continues to rise in developing economies due to rapid industrialization and urbanization.
D: Innovations in battery technology are making renewable energy storage more efficient and accessible.
Solution
Sentences 1, 2, and 4 form a paragraph about renewable energy, its adoption, and technological advancements aiding the transition to greener solutions.
Sentence 3, while it is related to energy but focuses on fossil fuel consumption and industrialization, which is a different theme from the renewable energy narrative.
Select the most appropriate options to fill in the blanks.
The scientist worked tirelessly _______ the new invention, presenting it _______ the conference, and receiving praise _______ her peers.
Solution
Here, the first blank should appropriately link the verb with the object. "On" fills the blank correctly. Further, the second blank should refer to the location. Hence, "at" is the appropriate preposition. Lastly, "Receiving praise from" identifies the source of the recognition, i.e., her peers.
Choose the word which is most opposite in meaning to the word given below.
Obscure
Solution
Option B is the correct answer.
"Obscure" means something that is unclear, hidden, or difficult to understand, while "reveal" means to make something clear or known.
a) Unclear is similar in meaning to obscure.
c) Hidden is a synonym of obscure.
d) Cryptic also means something that is mysterious or obscure.
Choose the option which is a SYNONYM for the given word: PERNICIOUS
Solution
"Pernicious" means something that is harmful or destructive, often in a subtle way. So, "harmful" is the closest synonym. The other options like "beneficial," "inspiring," and "courageous" are the opposite or unrelated to the meaning of "pernicious."
In the question, four statements are given, followed by two conclusions, 1, 2 and 3. You have to consider the statements to be true even if they seem to be at variance from commonly known facts. You have to decide which of the given conclusions, if any, follows from the given statements.
Statement:
1) All phones are chargers
2) Some chargers are Speakers
3) Some phones are not pen drives.
4) All Speakers are monitors.
Conclusion:
1) Some speakers can be pen drives.
2) Some chargers that are not phones are pen drives.
3) All chargers can be pen drives.
Solution
Conclusion 1) Some speakers can be pendrives.
The only condition we have about pendrives, is 3)Some phones are not pendrives.
Otherthan this we have no exclusion for pendrives. So, some speakers can be pendrives.
Conclusion 2) Some chargers that are not phones are pendrives.
We are just told that some phone are not pendrives. But we don't have any information about what pendrives are exactly. So, we can't surely say some chargers are pendrives.
Conclusion 3) All chargers can be pendrives.
We know that some phones are not pendrives. We also know that all phones are chargers. Since, some phones are not pendrives, some part of chargers can't be pendrives. So, all chargers can't be pendrives.
In a certain language, the word CAB is coded as 25 and the word MAT is coded as 1089. What will be the word FIN coded as?
Solution
Alphabetical positions of C, A and B are 3, 1 and 2. The sum is 3 + 1 + 2 = 6 and $$\left(6\ -\ 1\right)^2\ =\ 25$$.
Alphabetical positions of M, A and T are 13, 1 and 20. The sum is 13 + 1 + 20 = 34 and $$\left(34\ -\ 1\right)^2\ =\ 1089$$.
Similarly, the Alphabetical positions of F, I and N are 6, 9 and 14. The sum is 6 + 9 + 14 = 29 and $$\left(29\ -\ 1\right)^2\ =\ 784$$.
The correct answer is option B.
Study the following figure and answer the question given below.
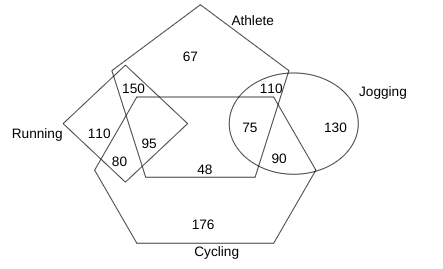
Which of the following statements is true?
I. There are 300 Athletes who don't practice running .
II. The Number of cyclists who don't practice running is 399.
Solution
Non running Athletes = 48+75+110+67 = 300
Number of cyclists how doesn't practice running = 48+75+90+176 = 389
BDF, CFI, EJO, GNU, ?
Solution
The first letter of each term are the letters in the prime numbered positions according to alphabetical order. So, the first letter is K.
The difference between second letter of each term has no pattern.(3, 4, 4)
So, let's check with the link between first and second letters.
BDF => B+2 = D
CFI => C+3 = F
EJO => E+5 = J
GNU => G+7 = N
So, it is addition of prime numbers.
K+11 = V
Similarly, checking for third letter and second letter.
BDF => D+2 = F
CFI => F+3 = I
EJO => J+5 = O
GNU => N+7 = U
In the same way V+11 = G
KVG is the answer.
A series is given with one term missing. Choose the correct alternative from the given options that will complete the series.
Series: 1, 4, 13, 40, 121, ?
Solution
The pattern in the series is multiplying the previous term by 3 and adding 1.
T(1)=1 (Initial term)
T(2) = 1 × 3 + 1 = 4
T(3) = 4 × 3 + 1= 13
T(4) = 13 × 3 + 1 = 40
T(5) = 40 × 3 + 1 = 121
T(6) = 121 × 3 + 1 = 364
Study the following information carefully to answer the given questions.
A, B, C, D, E, and F are arranged around a circular table.
* C and D are placed such that they are equidistant to A. They are also placed at an equal distance to B.
* E is placed second to the left of A.
* Only one pair of adjacent alphabets are seated opposite to each other.
Numbers from 1 to 6 are assigned starting from A in the clockwise direction.
Which of the following pairs are seated opposite to each other?
Solution
According to the first statement, A and B must be opposite each other for C and D to be equivalent to both A and B.
Since A and B are already adjacent to each other, the other pairs must not be adjacent to each other. It is also given that E is second to the left of A , and F has to be second to the right of A.
There is only one possible arrangement for C and D that satisfies the condition of adjacent letters not being opposite each other. This can be given by the figure below,
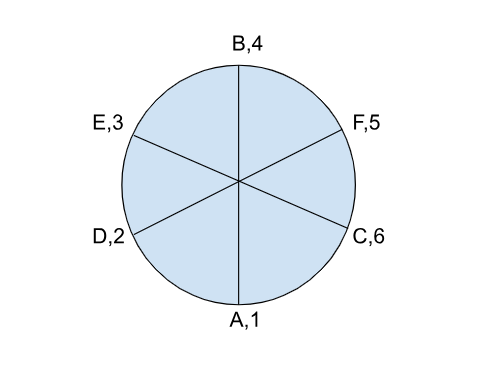
The only pairs from the options that are opposite to each other are C and E.
Hence, the correct answer is option D.
What is the number of factors of C * E * F?
Solution
According to the first statement, A and B must be opposite each other for C and D to be equivalent to both A and B.
Since A and B are already adjacent to each other, the other pairs must not be adjacent to each other. It is also given that E is second to the left of A , and F has to be second to the right of A.
There is only one possible arrangement for C and D that satisfies the condition of adjacent letters not being opposite each other. This can be given by the figure below,
The value of C * E * F = 6 * 3 * 5 = $$2\ \times\ 3^2\ \times\ \ 5$$The number of factors = (1 + 1) * (2 + 1) * (1 + 1) = 12
Hence, the correct answer is option C.
For the following questions answer them individually
There are 12 members between P and Q and 8 members between A and D, who is 5th to the left of Q. F, who is sitting 7th from the right end, is also 6th to the right of A. H is sitting third to the left of P, and there are 13 members to the left of P. How many members are in the row?
Solution
P _ _ _ _ _ _ _ _ _ _ _ _ Q or Q _ _ _ _ _ _ _ _ _ _ _ _ P
A _ _ _ _ _ _ _ _ D _ _ _ _ Q or D _ _ _ _ Q _ _ _ A
We are told that F is sitting 6th from the right of A and also 7th from the left end.
A _ _ _ _ _ F _ _ _ _ _ _
From this, we can infer that 13 is from the left end. So, the first arrangement of ADQ (A _ _ _ _ _ _ _ _ D _ _ _ _ Q) is not possible.
D _ _ _ _ Q _ _ _ A _ _ _ _ _ F _ _ _ _ _ _
Now, we have two cases.
i) D _ _ _ _ Q _ _ _ A _ _ _ _ _ F _ _ P _ _ _
ii) P _ _ _ _ _ _ _D _ _ _ _ Q _ _ _ A _ _ _ _ _ F _ _ _ _ _ _
We are told that H is sitting third to the left of P. In case i, F is sitting third to the left of P. So, only case 2 is possible.
We are told that there are 13 members to the left of P.
Now the total number of people is 13+30 = 43
Find the missing letters in the sequence given below:
a _ b c d _ _ f f g _ h _ _ j
Solution
The series follows the pattern: abbcddeffghhijj
The first segment: a (1x), b (2x), c (1x), d (2x), e (1x) and so on.
Correct answer: 3) b d e h i j
A clock is showing 12:00. After what time will the angle between the minute hand and the hour hand be $$90^o$$?
Solution
Angle = [(11 / 2) M - 30 H]
SInce the hour hand at 12, we put H = 0.
Let's find the value of M. 90 = (11/2)M
M = 180/11 = 16.36
16 min 21sec
Minutes and hours hand will be $$90^o$$ far when the angle between the is $$270^o$$.
270 = (11/2)M
M = 49.09
This is 49 min 5sec
Pointing to a photograph, A man said she is the daughter of my paternal grandfather's only son. How is the man relate to the person in the photograph?
Solution
The man's paternal grandfather's only son would be the man's father. And the girl in the photograph is the daughter of the man's father. So, she the man will be her brother.
AFGD : ZUTW : : BKMP:?
Solution
Each alphabet is paired with the other alphabet which make the sum to 27.
Using this logic BKMP:YPNK.
How many letters are followed by symbols in the below series?
N $ 7 k Q & t ∞ 1 f J 3 x Z 8 ≠ L w ¥ # V 9 t ± ∑ P 2 r € D 0 @ Y b π 5 n T ! g R 6 v %
Solution
N $ 7 k Q & t ∞ 1 f J 3 x Z 8 ≠ L w ¥ # V 9 t ± ∑ P 2 r € D 0 @ Y b π 5 n T ! g R 6 v %
There are 9 letters that are followed by symbols.
What was the day of the week on 15 Aug 2019, given that 1st Jan 2025 is a Wednesday?
Solution
Let's figure out the number of days between 15 Aug, 2019, and Jan 1st, 2025.
Let's find the number of days from 15 Aug 2019 to Jan 1st 2020.
Aug - 16, Sept - 30, Oct - 31, Nov - 30, Dec - 31. Their sum is 138.
2020 - 366
2021 - 365
2022 - 365
2023 - 365
2024 - 366
2025 - 1
The sum of these days = 1828.
Total 138+1828 = 1966 odd days.
1966% 7 = 6.
Six days back to Wednesday will be Thursday
So, the day is Thursday.
Choose the option which has the same relationship with the number as displayed by the first pair.
648 : 20: :16:?
Solution
648
Sum of digits is 18. Product of digits is 192. These two is not describing the relation. Let's try number of factors.
648 = $$2^3*3^4$$
Number of factors = 4*5 = 20
This is correct.
Number of factors for 16 = 5.
Two statements are provided in the question. Read the statements carefully and determine if the two statements are independent causes, effects of independent causes or a common cause.
Statement A: Many students performed poorly in the final exams despite preparing hard.
Statement B: There was a sudden increase in the difficulty level of the exams this year.
Solution
Statement A: Many students performed poorly in the final exams despite preparing hard.
Statement B: There was a sudden increase in the difficulty level of the exams this year.
Statement B is cause and Statement A is effect. The sudden increase in the difficulty level of the exams led to the poor performance of many students.
All the numbers of the below series follow a pattern except for one term of the series. Find the odd one out.
27, 75, 147, 243, 369, 507
Solution
The numbers of the series are following a pattern of $$\left(2k\ +\ 1\right)^2\times\ 3$$
First term of the series is $$=\ \left(2\times1\ +\ 1\right)^2\times\ 3\ =\ 3^2\times\ 3\ =\ 27$$
Second term of the series is $$=\ \left(2\times2\ +\ 1\right)^2\times\ 3\ =\ 5^2\times\ 3\ =\ 75$$
Third term of the series is $$=\ \left(2\times3\ +\ 1\right)^2\times\ 3\ =\ 7^2\times\ 3\ =\ 147$$
Fourth term of the series is $$=\ \left(2\times4\ +\ 1\right)^2\times\ 3\ =\ 9^2\times\ 3\ =\ 243$$
Fifth term of the series is $$=\ \left(2\times5\ +\ 1\right)^2\times\ 3\ =\ 11^2\times\ 3\ =\ 363$$
Sisth term of the series is $$=\ \left(2\times6\ +\ 1\right)^2\times\ 3\ =\ 13^2\times\ 3\ =\ 507$$
So, the odd term of the series is 369, as it should have been 363.
The correct answer is option C.
Raju walks 10 km north, then takes a right and travels for 5 more km. He then takes another right to travel for 15 km more, then takes another right to run for 10km. Finally, he takes another right and jogs for 17 km to reach a point. What is the shortest distance between the final point and the starting point, and also, which direction is Raju facing at the end?
Solution
The diagram looks like below according to the question,
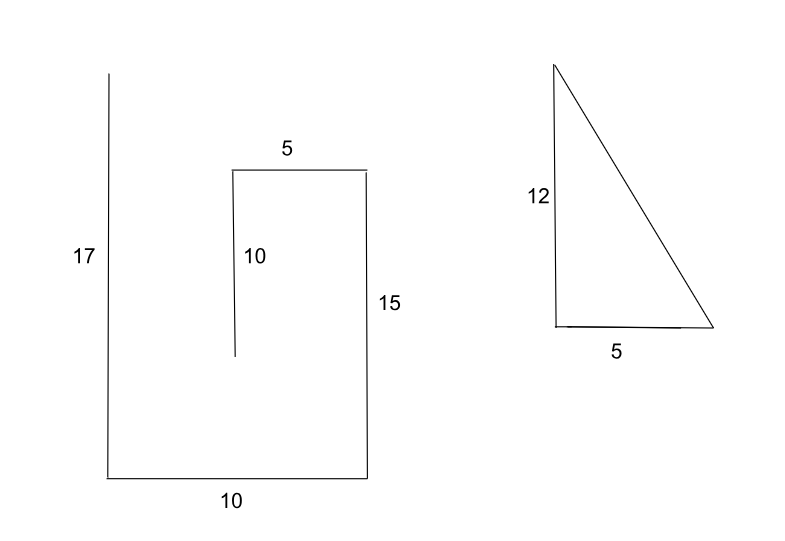
So, the distance between the starting and the finishing point is obtained using the Pythagoras theorem and is obtained as,
Distance $$=\ \sqrt{\ 12^2\ +\ 5^2}\ =\ \sqrt{\ 144\ +\ 25}\ =\ 13\ km$$
Raju is facing the North direction at the end.
The correct answer is Option C.
An input is given, and some mathematical operations are performed in each step to obtain the next step. Identify the operations and answer the questions
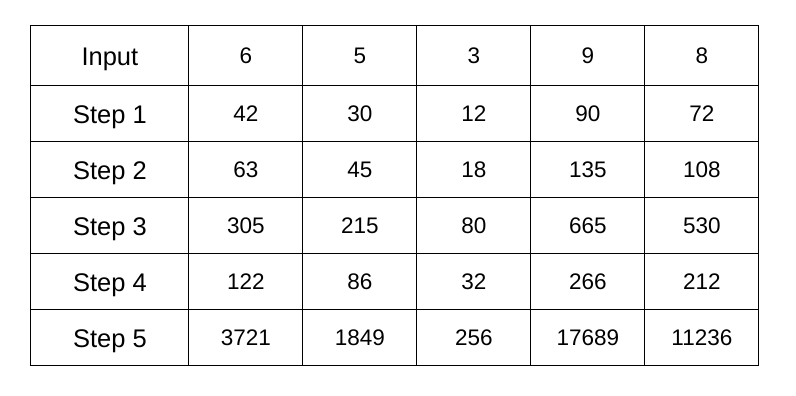
What is the output if the input is 7?
Solution
We see the following mathematical operations at each step:
Input = x
Step 1: Calculating the value of x(x + 1)
Step 2: Adding half of the above outcome to it, which is $$x\ (x+1)\ +\ \dfrac{x\ \left(x\ +\ 1\right)}{2}\ =\ \dfrac{3}{2}x\ \left(x\ +\ 1\right)$$
Step 3: Multiplying the outcome of the previous step with 5 and removing 10, which is $$\ \dfrac{15}{2}x\ \left(x\ +\ 1\right)-\ 10$$
Step 4: Multiplying the outcome of the previous step with $$\dfrac{2}{5}$$, which is $$\ 3x\ \left(x\ +\ 1\right)-\ 4$$
Step 5: Dividing the previous term by 2 and square the term which is $$\left(\dfrac{3x\ \left(x\ +\ 1\right)}{2}-\ 2\right)^{^2}$$
The input given is 7 and the output can be calculated as,
$$\ Output\ =\left(\dfrac{3\times\ 7\ \times\ 8}{2}-\ 2\right)^{^2}\ =\ 82^2\ =\ 6724\ $$
The correct answer is option A.
The average price of the three items is 150. The cost of the lowest price item is 140. Is the price of any item greater than 155? (There can be two items at the same price)
Statement 1: The cost of the other two items is greater than the average price.
Statement 2: The cost price of the other two items is not equal.
Solution
Given that the average price of three items is 150. So, the sum of the prices of the three items is 150 * 3 = 450.
We are given the cost of the lowest price item as 140. So, the sum of prices of the other two items can be given as 450 - 140 = 310.
Statement 1:
It is given that both the prices are greater than the average price. So, the prices of items can be anything from (151, 159) to (155, 155) as we are given that both the prices are greater than 150 and the sum of them has to be 310. We can see that in one case (155, 155), the highest price is not greater than 155, and in all the other cases, the highest price is greater than 155. So, we cannot determine whether the highest price is greater than 155 or not using this statement alone.
Statement 2:
It is given that the prices of the other two items are not equal. So, the prices of items can be anything from (141, 169) to (154, 156) as we are given that both the prices are not equal and the sum of them has to be 310. We can see that in all the cases, the highest price is greater than 155. So, we can determine that the highest price is greater than 155 if both prices are not equal.
Statement 2 alone is sufficient to answer the question, while Statement 1 alone is not.
The correct answer is option B.
In each question, a statement is followed by two arguments. You have to decide which of the following arguments are strong.
Statement: Should university professors in India be required to hold a doctorate degree?
Arguments:
I. Yes, professors with doctorate degrees can contribute significantly to academic research and innovation.
II. No, this requirement would exclude experienced professionals who may lack a doctorate but have practical knowledge and teaching skills.
Solution
Argument I: This is a valid argument. Having a doctorate often involves training in research methodologies, which is a key component of contributing to academic innovation. This point can be used to make a case for why holding a doctorate could be valuable.
Argument II: This argument is also valid, as it highlights the potential downside of requiring a doctorate degree. Practical experience and teaching skills can be equally valuable, and such a requirement may limit the pool of capable candidates.
Therefore, Option C is the correct answer.
Read the given statement followed by two courses of action numbered I and II. You have to assume everything in the statement to be true and based on the information given in the statement, decide which of the suggested courses of action logically follow(s) from the statement.
Statement: The rising number of cybercrimes, such as online fraud and identity theft, has created a sense of insecurity among internet users.
Courses of Action:
I. The government should establish a dedicated task force to monitor and investigate cybercrimes.
II. Citizens should be encouraged to use secure passwords and be educated on safe internet practices.
III. Internet access should be restricted to prevent misuse.
Solution
Course of Action I: This course of action logically follows. A specialized task force can proactively tackle the issue of cybercrimes by monitoring, investigating, and addressing these offenses.
Course of Action II: This course of action also follows. Educating citizens on cybersecurity and encouraging safer practices can significantly reduce the risk of falling victim to cybercrimes.
Course of Action III: This course of action does not logically follow. Restricting internet access is extreme and counterproductive, as it impacts legitimate usage and stifles the growth of digital literacy and innovation.
Therefore, Option B is the correct answer.
Read the given statements and select the most appropriate option. The statements may have a cause-and-effect relationship or may have independent causes or be the effects of independent causes.
Statements:
I. The unemployment rate in the country has been increasing steadily over the past five years.
II. The government has been launching various skill development programs during the same period.
Solution
Statement I: This indicates a trend where more people are unable to find jobs, possibly due to economic stagnation, automation, or other structural issues.
Statement II: This reflects an effort by the government to address unemployment or a lack of employable skills among the workforce.
Statement I directly aligns as the cause for Statement II. Governments typically respond to increasing unemployment rates by introducing or expanding programs aimed at improving employability. This sequence establishes a logical cause-and-effect relationship,p making Option C the correct answer.
Option A: Incorrect because skill development programs (Statement II) do not cause rising unemployment (Statement I). The relationship here works in the opposite direction.
Option B: While it's possible that rising unemployment (Statement I) and skill development programs (Statement II) may cause their own respective outcomes, this option does not align with the relationship between the two statements in this context.
Option D: Unlikely because no single overarching cause (like economic stagnation or automation) is explicitly mentioned to tie both statements together.
This question has a statement followed by two conclusions. Taking the statements to be true, decide which of the given conclusions definitely follows from the given statement.
Statement: A company has decided to implement a hybrid work model where employees can work both from home and from the office. The decision was made after surveys revealed that employee productivity was higher with flexible working arrangements.
Conclusions:
I. The hybrid work model was implemented solely to increase employee productivity.
II. Flexible working arrangements are beneficial for both employees and employers.
III. The company values employee preferences in its decision-making process.
Solution
Conclusion I: The statement specifies that higher employee productivity influenced the decision, but it does not claim it was the only factor. The word "solely" is overly restrictive and is not supported by the statement. Conclusion I does not follow.
Conclusion II: The statement mentions increased productivity (a benefit to the employer) but does not explicitly discuss benefits for employees. Conclusion II does not strictly follow.
Conclusion III: The statement mentions that the company conducted surveys, which likely captured employee preferences, before making its decision. This indicates that the company likely values and incorporates employee feedback into its decision-making process. Conclusion III follows.
Therefore, Option C is the correct answer.
Read the given statement and arguments carefully. Assuming that the information given in the statement is true, even if it appears to be at variance with commonly known facts, decide which of the given conclusions logically follow(s) from the statement.
Statement: A new study shows that students who use digital learning platforms perform better in exams compared to those who rely solely on traditional classroom teaching.
Conclusions:
I. Schools should replace traditional classroom teaching with digital learning platforms.
II. Students benefit from a blended approach that combines digital and traditional learning methods.
Solution
Conclusion I: This conclusion does not logically follow. While the study suggests that digital platforms can enhance performance, it does not imply that traditional methods should be completely replaced. A balanced approach might be more effective.
Conclusion II: This conclusion logically follows. The study highlights the benefits of digital platforms, and combining them with traditional methods could provide a more comprehensive learning experience.
Therefore, Option B is the correct answer.
The following charts represent the expenditure and sales of five companies that produce electric vehicles. The combined sales and expenditure of all five companies are 1.5 million dollars and 1 million dollars, respectively. The sales and expenditure data pertain exclusively to electric vehicles. The market share given in the below graph represents the number of vehicles sold by that company as a percentage of the total vehicles sold.
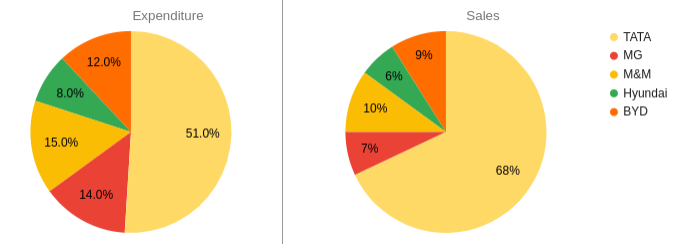
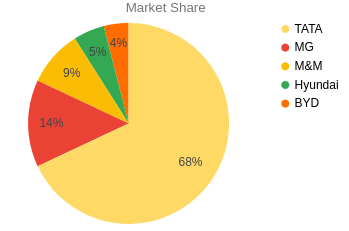
Based on this data answer the following questions.
Which company has highest profit per car?
Solution
Highest profit per car = $$\frac{\text{Total}\ \text{profit}}{\text{Market share}}$$

Profit is positive for TATA, Hyundai, BYD. Let 100x be the total number of cars sold.
TATA's profit per car = 7.5/x
Hyundai's profit per car = 2/x
BYD's profit per car = 3.75/x
So, this is highest for TATA.
Which company has highest profit percentage?
Solution
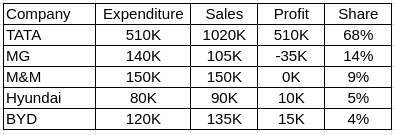
Only Tata, Hyundai and BYD are making a profit.
Profit % = Profit / Expenditure * 100%
TATA Profit % = 510/ 510 *100% = 100%
Hyundai = 10/80 *100% = 12.5%
BYD = 15k/120k *100% = 12.5%
Hence, answer is TATA.
For how many companies the profits are not positive?
Solution
Profits are not positive for MG and M&M. So, the answer is two.
What is the profit percentage of TATA?
Solution
Profit percentage = $$\dfrac{510}{510}\ \times\ 100\ =100$$
So, the profit is 100%.
Study the following graph carefully and answer the question below-
The table given below gives the percentage of total runs scored by a particular player in the match. The table also provides the boundary count of the players in the match. The total runs scored by a player is greater than or equal to the runs scored by the particular player by boundaries.
(Boundaries represent 4 runs, and there are no 6's in the match)
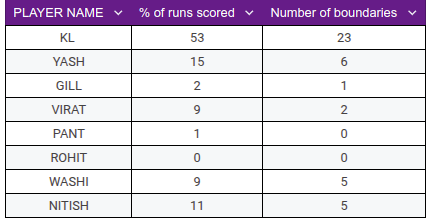
If the total runs scored by the team is 400, what percentage of the runs scored by KL is non-boundaries?
Solution
If the team total score is 400, then the runs scored by KL is given by $$\dfrac{53}{100}\ \times\ 400$$ = 212.
Runs scored by KL through boundaries = 23 * 4 = 92
Runs scored by KL without boundaries = 212 - 92 = 120
Percentage of runs scored by KL without boundaries = $$\dfrac{120}{212}\ \times\ 100$$ = $$56.6\%$$
The correct answer is option C.
If WASHI scored 36 runs in the match, how many runs did the team score without considering boundaries ?
Solution
We are given the score of WASHI as 36.
The percentage of runs scored by WASHI is 9%
$$\dfrac{9}{100}\ \times\ total\ score\ =\ 36$$
$$\ total\ score\ = 400$$
Number of boundaries scored by the whole team = 23 + 6 + 1 + 2 + 5 + 5 = 42
Score attained through boundaries = 42 * 4 = 168
The score without boundaries = 400 - 168 = 232
The correct answer is option A.
N is the minimum possible number of runs scored by the whole team. Which of the following is a multiple of N?
Solution
Runs scored by the players through boundaries are,
KL - 23 * 4 = 92
YASH - 6 * 4 = 24
GILL - 1 * 4 = 4
VIRAT - 2 * 4 = 8
PANT - 0 * 4 = 0
ROHIT - 0 * 4 = 0
WASHI - 5 * 4 = 20
NITISH - 5 * 4 = 20
We know that for a particular player, the runs scored must be greater than or equal to the runs he scored through boundaries. We also know that the combined runs of all the players together must be a multiple of 100 for individual player runs to be integers.
The minimum score cannot be 100 or 200 because, in the case of 100, runs scored by KL becomes $$\dfrac{53}{100}\ \times\ 100\ =\ 53$$, but we already know that KL scored 92 runs through boundaries. So, 100 does not satisfy the given conditions.
In the case of 200, the runs scored by WASHI can be calculated as $$\dfrac{9}{100}\ \times\ 200\ =\ 18$$, but we already know that he scored 20 runs through boundaries. So, 200 does not satisfy the given conditions.
So, the minimum score possible is 300 to satisfy all the given conditions.
Among the options, the multiple of 300 is 600. SO option A is the correct choice.
If GILL scored a total of 6 runs, What percent of the runs scored by YASH is with boundaries?
Solution
Given that the score of GILL is 6, the total number of runs scored can be calculated as,
$$\dfrac{2}{100}\ \times\ total\ =\ 6$$
$$\ total\ =\ 300$$
Runs scored by YASH can be calculated as,
$$\dfrac{15}{100}\ \times\ 300\ =\ 45$$
Runs scored by YASH through boundaries = 6 * 4 = 24
The percentage of runs scored through boundaries can be calculated as,
$$\dfrac{24}{45}\ \times\ 100\ =\ 53.334$$
The correct answer is option C.
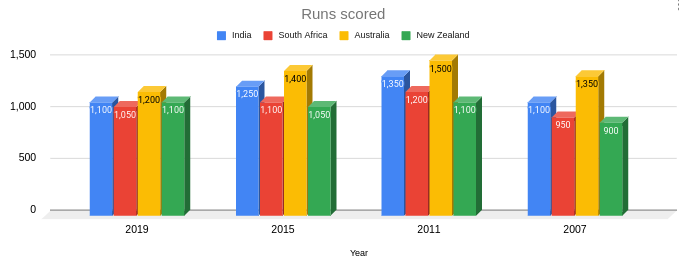
The following graph shows the number of runs scored by four teams in World Cup tournaments over four different years.
The graph below shows the number of matches played by four teams in past four year's World Cup tournament.
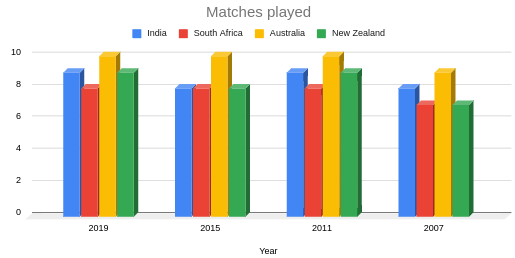
What is the ratio of average runs per match of South Africa in 2011 to Australia in 2007?
Solution
Average runs per match of South Africa in 2011 = $$\dfrac{1200}{8}$$ = 150
Average runs per match of Australia in 2007 = $$\dfrac{1350}{9}$$ = 150
150:150 = 1:1
Considering all four years, which team has the highest runs per match?
Solution
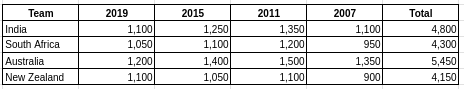
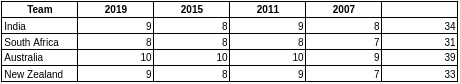
We have to find the highest among $$\frac{4800}{34}$$, $$\frac{4300}{31}$$, $$\frac{5450}{39}$$, $$\frac{4150}{33}$$.
The highest is $$\frac{4800}{34}$$. Hence, India is the answer.
By what percent did the average runs per match for South Africa increase in 2011 from 2007?
Solution
Average runs per match for South Africa in 2011 = $$\frac{1200}{8}$$ = 150
Average runs per match for South Africa in 2007 = $$\frac{950}{7}$$ = 135.71
The increase = $$\frac{\left(150-135.71\right)}{135.71}$$ = 10.5%
Considering all four years, which team has the second highest runs per match?
Solution
We have to find the second highest among $$\frac{4800}{34}$$, $$\frac{4300}{31}$$, $$\frac{5450}{39}$$, $$\frac{4150}{33}$$.
The second highest is $$\frac{5450}{39}$$=139.74. Hence, Australia is the answer.
A survey was conducted every year from 2001-2005 to find the sex ratio and the literacy of a village called Parbhani. The following table shows the findings of the survey:-
 In the table, 75% of the male population was literate in 2001 and 80% of the female population was literate.
How males of the village were illiterate in 2003?
Solution
The total population in 2001 is 3000 and the male population is 60%.
Thus, the male and the female population is 1800 and 1200 respectively.
75% of the males and 80% of the females are literate.
Thus, the number of male and female literates are 1350 and 960 respectively.
Similarly, the data for other years can also be calculated.
The given table is:-

Thus, the total illiterates males of the given village in 2003 = 1750-1400 = 350
Hence, option D is the correct answer.
The total literate females in the village in 2005 is
Solution
The total population in 2001 is 3000 and the male population is 60%.
Thus, the male and the female population is 1800 and 1200 respectively.
75% of the males and 80% of the females are literate.
Thus, the number of male and female literates are 1350 and 960 respectively.
Similarly, the data for other years can also be calculated.
Thus, the total literate females in the village in 2005 = 1134
Hence, option B is the correct answer.
What is the literacy of the village in 2004?
Solution
The total population in 2001 is 3000 and the male population is 60%.
Thus, the male and the female population is 1800 and 1200 respectively.
75% of the males and 80% of the females are literate.
Thus, the number of male and female literates are 1350 and 960 respectively.
Similarly, the data for other years can also be calculated.
Thus, the literacy of the village in 2004 = (1368+1482)*100/3800 = 2850/3800 =75%.
Hence, option C is the correct answer
In which year the literacy of the village was the highest?
Solution
The total population in 2001 is 3000 and the male population is 60%.
Thus, the male and the female population is 1800 and 1200 respectively.
75% of the males and 80% of the females are literate.
Thus, the number of male and female literates are 1350 and 960 respectively.
Similarly, the data for other years can also be calculated.
Thus, the literacy of the village was the highest in 2001.
Hence, option A is the correct answer.
In which year was the total number of literate male less than the total number of literate female?
Solution
The total population in 2001 is 3000 and the male population is 60%.
Thus, the male and the female population is 1800 and 1200 respectively.
75% of the males and 80% of the females are literate.
Thus, the number of male and female literates are 1350 and 960 respectively.
Similarly, the data for other years can also be calculated.
The given table is:-
As we can see for 2002, the total number of the literate female is greater than the total number of the literate male.
Hence, option B is the correct answer.
Answer the following questions using the pie chart given. Total runs scored by them all is 2600.
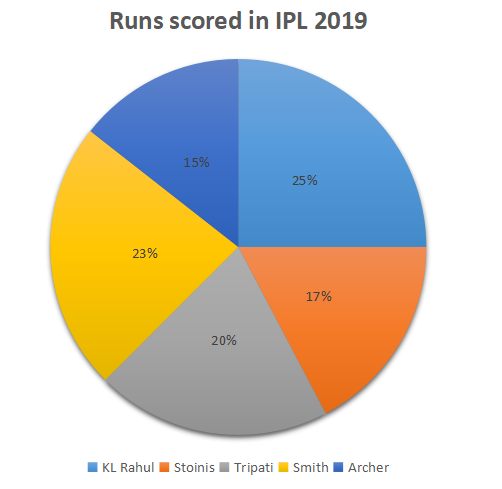
What is the approximate difference between the runs scored by top 3 run getters and bottom 3 run getters ?
Solution
Top 3 players scored 25%+23%+20%=68% of total runs
Bottom 3 players scored 15%+17%+20%=52% of total runs
Difference =68-52
=16%
Therefore 16% of 2600= 416 runs
What is the approximate central angle subtended by both Stoinis and Tripati in the pie diagram ?
Solution
Stoinis scored 17% of total runs
Tripati scored 20% of total runs
Total=37% of total runs
Therefore we have 360 degrees=100%
then 37%=360*37/100
=133.2 degrees
What is the average runs scored by the Smith and Archer ?
Solution
Smith scored 23% of the total runs and Archer scored 15% of total runs
So they both scored 38% of total runs between them and so average=19 % of 2600
=494 runs
If each of Rahul and Archer scored 20% and 10% more runs in the next season then what are the total runs scored by them in the next season ?
Solution
Rahul scored 25% of runs and increased by 20% and so total runs scored by him is (25/100)*(1.2)*2600=780 runs
Archer scored 15% of runs and increased by 10% and so total runs scored in the next
season =(15/100)*(1.1)*2600
=429 runs
Sum=780+429
=1209
Directions for the following five questions: Answer the questions based on the two graphs below.
Figure I (the chart on the top) shows the number of students studying in government and private schools in KPHB.
Figure 2 (the chart on the bottom) shows the number of boys studying in government and private schools in KPHB during the same period.
(The top graph includes the stats of both boys and girls, whereas the bottom graph includes the stats of only boys)
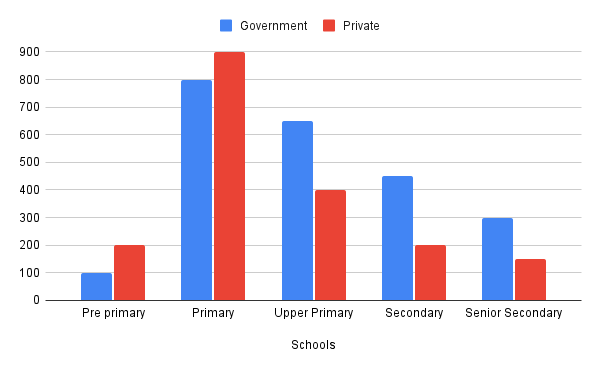
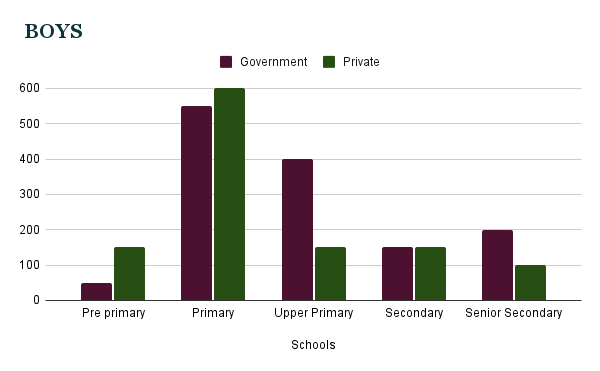
What is the ratio of the number of boys in pre-primary government schools to the total number of girls in all secondary schools?
Solution
From the given graphs, we can obtain the values as,
Boys and Girls
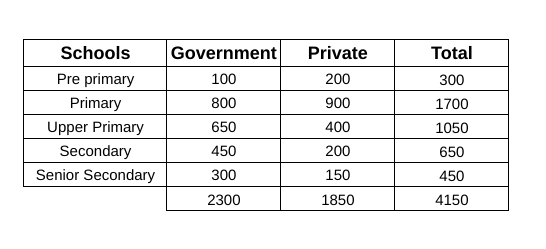
Boys
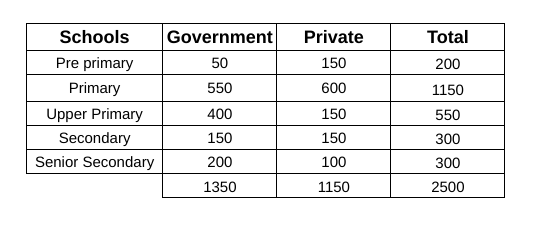
Girls
The ratio of the number of boys in pre-primary government schools to the number of girls in secondary schools is,
50 : 350 = 1 : 7
The correct answer is option B.
Among all students across all schools, what percentage are girls studying in private schools?
Solution
From the given graphs, we can obtain the values as,
Boys and Girls
Boys
Girls
Percentage = $$\dfrac{700}{4150}\ \times\ 100$$ = 16.86%
The correct answer is option B.
Which of the following has the same ratio as the ratio of private primary girls to private primary boys?
Solution
From the given graphs, we can obtain the values as,
Boys and Girls
Boys
Girls
The ratio of private primary girls to private primary boys is 300 : 600 = 1 : 2
Option A:
Government primary girls : Private senior secondary boys = 250 : 100 = 5 : 2
Option B:
Private secondary girls : Private secondary boys = 50 : 150 = 1 : 3
Option C:
Government primary girls : Private upper primary boys = 250 : 150 = 5 : 3
Option D:
Government pre-primary girls : Private senior secondary boys = 50 : 100 = 1 : 2
The correct answer is option D.
What is the percentage by which the number of students in government schools is greater than the number of students in private schools?
Solution
From the given graphs, we can obtain the values as,
Boys and Girls
Boys
Girls
Percentage = $$\dfrac{2300\ -\ 1850}{1850}\ \times\ 100$$ = 24.32%
The correct answer is option A.
For the following questions answer them individually
In a showroom, the ratio of number of Apple products to Samsung products 2:7 and the ratio of number of Xiaomi products to Vivo products is 5:11. If the ratio of number of Samsung products to Vivo products is 5:9, what is the minimum possible sum of all the four type of product?
Solution
We are given that the ratio of number of Apple products to Samsung products 2:7. Assume the number of Apple products = 2x and number of Samsung products = 7x.
Similarly, we are given that the ratio of number of Xiaomi products to Vivo products is 5:11 Assume the number of Xiaomi products = 5y and number of Vivo products = 11y.
We are also told that the ratio of number of Samsung products to Vivo products is 5:9.
The ratio of number of Samsung products to Vivo products = 7x:11y
We are told that 7x:11y = 5:9
For this to be true, x has to be a multiple of both 11 and 5. Similarly y has to be multiple of 7 and 9.
Since we are asked for the minimum value, x = 11*5 = 55 and y = 7*9 = 63
number of Apple products = 2x = 110
number of Samsung products = 7x = 385
number of Xiaomi products = 5y = 315
number of Vivo products = 11y = 693
Sum = 1503
A is a set of all integers between 1 and 100 ( both included ) that are multiples of 6. B is a set of all integers between 1 and 200( both included ) that are multiples of 8. How many elements are in the set C = B-(A$$\cap$$B)?
Solution
The set A consists of integers between 1 and 100 that are multiples of 6.
The set B consists of integers between 1 and 200 that are multiples of 8.
(A$$\cap$$B) is the set of multiples of LCM(6, 8) = 24, between 1 to 100.
(A$$\cap$$B) = {24, 48, 72, 96}
The size of B is 200/8 = 25.
So, the size of C = 25-4 = 21.
A cone of diameter of 28cm and height of 48cm is cut horizontally at the height of 24cm from the bottom, and the small cone obtained is attached to the other part in such a way that the centre of the base of the smaller cone touches the centre of the base of the frustum formed of the bigger cone. What is the total surface area of the figure formed?
(take $$\pi$$ as $$\dfrac{22}{7}$$)
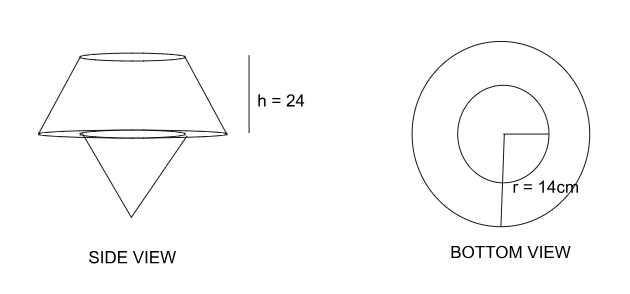
Solution
The total surface area of the bigger cone and the figure formed will be the same as the area in which the smaller cone closes on the base, the same as the area at the top of the other part. So, the total surface area of the figure can be calculated as,
Slant height l = $$\sqrt{\ r^2\ +\ h^2\ }\ =\ \sqrt{\ 14^2\ +\ 48^2}\ =\ \sqrt{\ 2500}\ =\ 50\ $$
Total surface area = $$\pi\ r\left(r\ +\ l\right)$$ = $$\dfrac{22}{7}\ \times\ 14\left(50\ +\ 14\right)\ $$ = $$22\ \times\ 2\ \times\ 64\ $$ = 2816
The correct answer is option D.
Rohit can finish 75% of a task in 24 days, while Shyam can complete 62.5% of the same task in 10 days. If Rohit and Shyam work together for 8 days, and Mohan completes the remaining task in 5 days, determine how long Mohan would take to complete 80% of the task on his own.
Solution
Rohit can finish 75% of a task in 24 days
Shyam can complete 62.5% of the same task in 10 days.
We know Rohit and Shyam have worked together for 8 days.
Therefore, work done by Rohit in 8 days =?
75% of a task in 24 days,
25% of a task in 8 days.
Thus, Rohit completes 25% of the task in 8 days.
Similarly, Shyam will complete work in 8 days =?
62.5% of the same task in 10 days.
6.25% of tasks in 1 day.
Therefore, 50% of tasks in 8 days.
Therefore, Rohit and Shyam complete 25%+50% = 75% of the task in 8 days.
Mohan completes the remaining task in 5 days
Thus, Mohan completes 25% of the task in 5 days.
Mohan completes 5% of tasks in 1 day.
Therefore, he will take 16 days to complete the 80% of the task.
In a 1000m race, B took 50% more time than C to finish the race, and B also took 25% more time than A. If all three started the race from the same point on a circular track of 1100m length, with A and B traveling clockwise and C traveling counterclockwise, what is the distance between the first meeting point of A and C and the meeting point of B and C?
Solution
We are told that B took 50% more time than C to finish the race, and B also took 25% more time than A.
So, $$1.5*T_c = T_b$$, $$ T_b=1.25T_a$$.
From this $$T_a = \frac{6}{5}T_c$$
Let's find the speeds of all three. $$S_c = \frac{1000}{T_c}$$, $$S_b = \frac{1000}{T_b} = \frac{1000}{1.5*T_c}$$, $$S_a=\frac{1000}{T_a}=\frac{1000}{\frac{6}{5}*T_c}=\frac{\left(5\cdot1000\right)}{6\cdot T_c}$$
The ratio of the speeds of A, B, C will be $$\frac{5}{6}:\frac{1}{1.5}:1=\frac{5}{6}:\frac{2}{3}:1=5:4:6$$.
The distance between the meeting points of A, C and B, C.
The ratio of the speeds of A and C is 5:6. Time taken for them to meet = $$\frac{1100}{5x+6x}=\frac{1100}{11x}=\frac{100}{x}$$
Distance C travelled = $$6x\cdot\frac{100}{x}$$ = 600m.
The ratio of the speeds of B and C is 4:6. Time taken for them to meet = $$\frac{1100}{4x+6x}=\frac{1100}{10x}=\frac{110}{x}$$
Distance C travelled = $$6x\cdot\frac{110}{x}$$ = 660m.
So, the distance between two meeting points = 60m
Ankur purchases 20 mobile phones and 10 laptops for a total of 14 lakhs. He increases the price of each mobile phone by 30% and each laptop by 20%, earning a profit of 3.5 lakhs. Calculate the total profit if he instead sells each mobile phone at a 40% increased price and each laptop at a 50% increased price.
Solution
Let the price at which Ankur purchases a mobile phone and a laptop be X and Y.
Therefore, the cost price of 20 mobile phones and 10 laptops = 20X+10Y = 14,00,000 ----equation (1)
Now, it is given that he sold a mobile phone at an increased price of 30% and a laptop for an increased price of 20%
Profit made = 3,50,000
Therefore, the Selling Price of 20 mobile phones and 10 laptops = 14,00,000+3,50,000 = 17,50,000
=> 20X*1.3+10Y*1.2 = 17,50,000
=> 26X+12y = 17,50,000 ----equation (2)
Solving equations (1) and (2), we get
X = 35,000 and Y = 70,000
Therefore, if he has sold each mobile phone at a 40% increased price and each laptop at a 50% increased price.
The profit will be 20*35,000*0.4 + 10*70,000*0.5 = 2,80,000+3,50,000 = Rs.6,30,000
The compound interest on ₹5,000 for 2 years is ₹4,800. Find the simple interest obtained if the principal, interest rate, and time remain the same.
Solution
Compound Interest on₹5,000 for 2 years will be at a rate of R will be $$5000\left(1+\frac{R}{100}\right)^2-5000=4800$$
$$5000\left(1+\frac{R}{100}\right)^2=9800$$
$$\left(1+\frac{R}{100}\right)^2=\frac{9800}{5000}=1.96$$
$$\left(1+\frac{R}{100}\right)=1.4$$
R = 40%
Simple interest = $$\frac{PTR}{100}$$
Simple interest for ₹ 5000 at 40% for 2 years will be $$\frac{5000*40\cdot2}{100}=4000$$
The concentration of milk in mixture A is 40%, and the concentration of milk in mixture B is 75%. In what ratio should they be mixed so that 5L of the resulting mixture C has 3L of milk?
Solution
It is given that the concentration of mixture A is 40% and the concentration of mixture B is 75%. The resulting mixture C has 3L of milk in 5L of the mixture. So, the concentration of the mixture is calculated as,
Concentration of milk in C = $$\dfrac{3}{5}\ \times\ 100\ =\ 60\%$$
Using the allegation method, we can calculate the ratio in which they are mixed to be as,
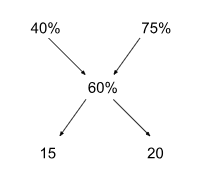
So, the ratio at which they must be mixed is 15:20 = 3:4.
The correct answer is option B.
25 distinct positive integers are arranged in ascending order. The average of first 12 is 30 while the average of last 16 is 60. What is the maximum possible average of 10th, 11th, and 12 th element in the series?
Solution
The 10th, 11th, and 12th elements in the series are the first three elements of the last 16. And the average of 16 numbers is 60. To maximize the first three of these 16, we should keep the numbers as close to 60 as possible. So, the numbers will be 52, 53, 54, 55, ..., 59,61, ...,65, 66, 67, 68.
The 10th, 11th, and 12th elements in the series are the last three elements of the first 12. Let us check if 52, 53, and 54 will satisfy the average or not.
The sum of the first 12 will be 30*12 = 360.
The sum of the first nine will be 360 - (52+53+54) = 201.
The sum of nine distinct positives can be 201.
So, 52, 53, and 54 will be the maximum possible values for the 10th, 11th, and 12th elements in the series. Their average will be 53.
What is the value of a - b if it is known that $$\sqrt{\ \dfrac{7\ +\ 4\sqrt{\ 3}}{3}}\ =\ a\ +\ b\sqrt{\ 3}$$? (where a and b are rational numbers)
Solution
We are given that,
$$\sqrt{\ \dfrac{7\ +\ 4\sqrt{\ 3}}{3}}\ =\ a\ +\ b\sqrt{\ 3}$$
LHS can be written as,
$$\sqrt{\ \dfrac{\left(7\ +\ 4\sqrt{\ 3}\right)\times\ 3}{3\ \times\ 3}}\ =\ \sqrt{\dfrac{21\ +\ 12\sqrt{\ 3}}{9}\ }=\ \ \sqrt{\dfrac{3^2\ +\ 2\times\ 3\times\ 2\sqrt{\ 3}\ +\ \left(2\sqrt{\ 3}\right)^2}{3^2}\ }\ =\ \sqrt{\left(\ \dfrac{3\ +\ 2\sqrt{\ 3}}{3}\right)^{^2}}\ =\ 1\ +\ \dfrac{2}{3}\sqrt{\ 3}$$
The value of a is 1, and b is $$\dfrac{2}{3}$$.
The value of $$a\ -\ b\ =\ 1\ -\ \dfrac{2}{3}\ =\ \dfrac{1}{3}$$
The correct answer is option C.
What is the value of 15x + 15y, where x and y are not equal to 0, such that x and y satisfy the equations given below?
$$\dfrac{3}{x}\ +\ \dfrac{4}{y\ }\ =\ 3$$
$$-\dfrac{2}{x}\ +\ \dfrac{1}{y\ }\ =\ -13$$
Solution
The equations given are,
$$\dfrac{3}{x}\ +\ \dfrac{4}{y\ }\ =\ 3$$
$$-\dfrac{2}{x}\ +\ \dfrac{1}{y\ }\ =\ -13$$
Let us assume the value of $$\dfrac{1}{x}$$ to be a and $$\dfrac{1}{y}$$ to be b. The above equations become,
3a + 4b = 3 ----(1)
-2a + b = -13 ----(2)
(1) * 2 + (2) * 3, we get,
(3a + 4b)*2 + (-2a + b)*3 = 3 * 2 + (-13) * 3
6a + 8b - 6a + 3b = 6 - 39
11b = -33
b = -3 and a = 5
We get the values x and y as,
$$\dfrac{1}{x}\ =\ 5$$
$$x\ =\ \dfrac{1}{5}$$
$$\dfrac{1}{y}\ =\ -3$$
$$y\ =\ -\dfrac{1}{3}$$
$$x\ +\ y\ =\ \dfrac{1}{5}-\dfrac{1}{3}\ =\ -\dfrac{2}{15}$$
$$15\left(x\ +\ y\right)\ =\ -\dfrac{2}{15}\ \times\ 15\ \ =\ -2$$
The correct answer is option C.
Given that a and b are the roots of the equation $$x^2\ -\ 13x\ +\ 42\ =\ 0$$. Which of the following is the equation with $$\dfrac{1}{a}$$ and $$\dfrac{1}{b}$$ as its roots?
Solution
Given that a and b are the roots of the equation $$x^2\ -\ 13x\ +\ 42\ =\ 0$$
Sum of the roots = a + b = $$-\dfrac{b}{a}$$ = $$-\dfrac{\left(-13\right)}{1}$$ = 13
Product of the roots = ab = $$\dfrac{c}{a}$$ = $$\dfrac{42}{1}$$ = 42
Let the new quadratic equation be $$x^2\ +\ cx\ +\ d\ =\ 0$$. For the new equation with roots as $$\dfrac{1}{a}$$ and $$\dfrac{1}{b}$$, the sum of the roots and product of the roots can be calculated as
Sum of the roots = $$\dfrac{1}{a}\ +\ \dfrac{1}{b}$$ = $$\dfrac{a\ +\ b}{ab}$$ = $$\dfrac{13}{42}$$ = -c
Product of the roots = $$\dfrac{1}{a}\times\ \dfrac{1}{b}$$ = $$\dfrac{1}{ab}$$ = $$\dfrac{1}{42}$$ = d
So, the new equation becomes,
$$x^2\ -\ \dfrac{13}{42}x\ +\ \dfrac{1}{42}\ =\ 0$$
Multiplying the whole equation by 42, we get,
$$42x^2\ -\ 13x\ +\ 1\ =\ 0$$
The correct answer is option A.
Find all the values of x that satisfy the inequality below.
$$\dfrac{\left(x\ -\ 3\right)^2\left(x\ ^2\ +\ 9x\ +\ 20\right)}{\left(x^2\ +\ 2x\ -\ 15\right)}\ \le\ 0$$
Solution
Given inequality is, $$\dfrac{\left(x\ -\ 3\right)^2\left(x\ ^2\ +\ 9x\ +\ 20\right)}{\left(x^2\ +\ 2x\ -\ 15\right)}\ \le\ 0$$
$$x\ ^2\ +\ 9x\ +\ 20\ $$ can be written as,
$$x\ ^2\ +\ 4x\ \ +\ 5x\ +\ 20\ $$ = $$x\ \left(x\ +\ 4\right)\ \ +\ 5\left(x\ +\ 4\right)\ $$ = $$\left(x\ +\ 5\right)\left(x\ +\ 4\right)\ $$
$$x\ ^2\ +\ 2x\ -\ 15\ $$ can be written as,
$$x\ ^2\ -\ 3x\ \ +\ 5x\ -\ 15\ $$ = $$x\ \left(x\ -\ 3\right)\ \ +\ 5\left(x\ -\ 3\right)\ $$ = $$\left(x\ +\ 5\right)\left(x\ -\ 3\right)\ $$
The inequality can be written as,
$$\dfrac{\left(x\ -\ 3\right)^2\left(x\ +\ 4\right)\left(x\ +\ 5\right)}{\left(x-\ 3\right)\left(x\ +\ 5\right)}\ \le\ 0$$
We can cancel the terms (x - 3) and (x + 5) from the numerator and denominator with the condition that x cannot take the values 3 and - 5.
After cancellation, the equation becomes,
$$\left(x\ -\ 3\right)\left(x\ +\ 4\right)\ \le\ 0$$
So, the values x can take are [-4, 3). We cannot include 3 as we already obtained the condition above.
So, the correct answer is option C.
A function f(x) is given as $$f\left(x\right)\ =\ 2x^2\ +\ 3x\ +\ 1$$ and function g(x) is given as $$g\left(x\right)\ =\ 3x\ +\ 1$$. What is the sum of all the real values of x where $$f\left(g\left(x\right)\right)\ =\ g\left(f\left(x\right)\right)$$?
Solution
Given that,
$$f\left(x\right)\ =\ 2x^2\ +\ 3x\ +\ 1$$
$$g\left(x\right)\ =\ 3x\ +\ 1$$
The value of $$f\left(g\left(x\right)\right)$$ is given as,
$$f\left(g\left(x\right)\right)\ =\ 2\left(3x\ +\ 1\right)^2\ +\ 3\left(3x\ +\ 1\right)\ +\ 1\ =\ 2\left(9x^2\ +\ 6x\ +\ 1\right)\ +\ 9x\ +\ 4\ =\ 18x^2\ +\ 21x\ +\ 6$$
$$g\left(f\left(x\right)\right)\ =\ 3\left(2x^2\ +\ 3x\ +\ 1\right)\ +\ 1\ =\ 6x^2\ +\ 9x\ +\ 4$$
Equating f(g(x)) and g(f(x)), we get,
$$18x^2\ +\ 21x\ +\ 6\ =\ 6x^2\ +\ 9x\ +\ 4$$
$$12x^2\ +\ 12x\ +\ 2\ =\ 0$$
We can see that D > 0 for the above equation, and the roots of the equation are real. So, the sum of all the possible values of x is given by,
Sum of the roots = $$-\dfrac{b}{a}$$ = $$-\dfrac{12}{12}$$ = $$-1$$
The correct answer is option D.
A function f(x) is given such that it satisfies all the real values of x, and a relation is given as,
$$f\left(x\right)\ +\ 2f\left(\dfrac{1}{1-x}\right)\ =\ x$$
What is the value of $$f\left(2\right)$$?
Solution
We are given the equation,
$$f\left(x\right)\ +\ 2f\left(\dfrac{1}{1-x}\right)\ =\ x$$
Substituting the value of x = 2 in the equation, we get,
$$f\left(2\right)\ +\ 2f\left(-1\right)\ =\ 2$$ -----(1)
Substituting x = -1, we get
$$f\left(-1\right)\ +\ 2f\left(\dfrac{1}{2}\right)\ = -1$$ -----(2)
Substituting x = $$\dfrac{1}{2}$$ we get,
$$f\left(\dfrac{1}{2}\right)\ +\ 2f\left(2\right)\ =\ \dfrac{1}{2}$$ -----(3)
By applying (1) - 2*(2) + 4*(3), we get,
$$f\left(2\right)\ +\ 2f\left(-1\right)\ -\ 2f\left(-1\right)\ -\ 4f\left(\dfrac{1}{2}\right)\ +\ 4f\left(\dfrac{1}{2}\right)\ +\ 8f\left(2\right)\ =\ 2\ -\ 2\times\ \left(-1\right)\ +\ \ 4\times\ \dfrac{1}{2}$$
$$f\left(2\right)+\ 8f\left(2\right)\ =\ 2\ +\ 2\ +\ 2$$
$$9f\left(2\right)\ =\ 6$$
$$f\left(2\right)\ =\ \dfrac{2}{3}$$
The correct answer is option A.
The 29th term of the series in AP is given as 609, and it is also provided that the first term is the same as the common difference in that series. What is the sum of 18 terms of the series?
Solution
Let the first term of the series be a, and the common difference of the series be d. It is given that a = d and the 29th term of the series is given as 609.
$$a_{29}\ =\ a\ +\ \left(29\ -1\right)d\ =\ a\ +\ 28a\ =\ 29a\ =\ 609$$
$$a\ =\ 21\ =\ d$$
The sum of 18 terms can be calculated as,
$$S_{18}\ =\ \dfrac{n}{2}\left(2a\ +\ \left(n\ -\ 1\right)d\right)\ =\ \dfrac{18}{2}\left(2\times\ 21\ +\ \left(18\ -\ 1\right)21\right)\ =\ 9\left(19\ \times\ 21\right)\ =\ 3591\ $$
The correct answer is option C.
Find the sum of all the factors of the number 55440.
Solution
Prime factorization of 55440.
$$55440=2^4\times3^2\times5\times7\times11$$
We know that the total factors will be equal to (4+1)*(2+1)*(1+1)*(1+1)*(1+1) = 120
And, the total number of even factors is equal to (3+1)*(2+1)*(1+1)*(1+1)*(1+1) = 96
To find the sum of all factors, we will put all the possible powers of any prime number and add them together and multiply with other primes.
$$2^4\times3^2\times5\times7\times11$$
Sum = $$\left(2^0+2^1+2^2+2^3+2^4\right)\times\left(3^0+3^1+3^2\right)\times\left(5^0+5^1\right)\times\left(7^0+7^1\right)\times\left(11^0+11^1\right)$$
=> 31*13*6*8*12
=> 232128
How many of the following statements are true?
I) $$(260)_7+\left(740\right)_8=\left(514\right)_{11}$$
II)$$\left(824\right)_9+\left(101101\right)_2=\left(710\right)_{10}$$
III) $$\left(0.353\right)_6=\left(0.505\right)_{10}$$
IV) $$\left(0.11111\right)_2=\left(0.96875\right)_{10}$$
Solution
I) $$(260)_7+\left(740\right)_8=\left(514\right)_{11}$$
$$(260)_7 = 2*7^2+6*7 = 140$$
$$\left(740\right)_8 = 7*8^2+4*8 = 480$$
140+480 =620
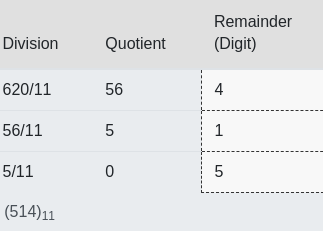
$$(620)_{10}=(514)_{11}$$
II)$$\left(824\right)_9+\left(101101\right)_2=\left(710\right)_{10}$$
$$\left(824\right)_9 = 8*9^2+2*9+4 = 670$$
$$(101101)_2=(1\times2^5)+(0\times2^4)+(1\times2^3)+(1\times2^2)+(0\times2^1)+(1\times2^0)\ =\ (45)_{10}$$
670+45 = $$(715)_{10}$$
III) $$\left(0.353\right)_6=\left(0.505\right)_{10}$$
$$3\cdot\frac{1}{6}+5\cdot\frac{1}{6\cdot6}+3\cdot\frac{1}{6\cdot6\cdot6}=\frac{1}{2}+\frac{5}{36}+\frac{1}{72}$$
This is clearly greater than 0.55. So, this is incorrect.
IV) $$\left(0.11111\right)_2=\left(0.96875\right)_{10}$$
$$\frac{1}{2}+\frac{1}{2^2}+\frac{1}{2^3}+\frac{1}{2^4}+\frac{1}{2^5}=0.5+0.25+0.125+0.0625+0.03125=0.96875$$
So, this is a correct statement.
I and IV are the only correct statements.
What is the distance between the lines 3x - 4y - 5 = 0 and 6x - 8y + 10 = 0?
Solution
The lines given are,
3x - 4y - 5 = 0 ----(1)
6x - 8y + 10 = 0 -----(2)
(1) * 2, we get,
6x - 8y - 10 = 0 ----(1)
We can see that (1) and (2) are parallel to each other as the slopes of the lines are equal.
The distance can be calculated using the formula,
$$dis\tan ce\ =\ \dfrac{\left|c_1\ -\ c_2\right|}{\sqrt{\ a^2\ +\ b^2}}$$
$$dis\tan ce\ =\ \dfrac{\left|10\ -\left(-10\right)\right|}{\sqrt{\ 6^2\ +\ \left(-8\right)^2}}$$
$$dis\tan ce\ =\ \dfrac{20}{\sqrt{\ 36\ +\ 64}}\ =\ \dfrac{20}{10}\ =\ 2$$
The correct answer is option B.
Two circles of equal radius 12cm, C1 and C2, are in such a way that they are not intersecting each other. A tangent is drawn to C1 from the intersection point of the line joining the centres of both circles, and circle C2. If the length of the tangent is given as 16cm, then what is the distance between the centres of the circles?
Solution
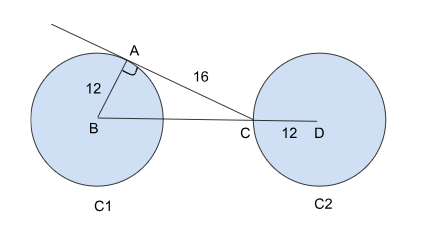
As shown in the figure above, we must calculate the length of BD. We are given the length of AC as 16 and AB as 12. The length BC can be calculated as,
$$AC^2\ +\ AB^2\ =\ BC^2$$
$$BC\ =\ \sqrt{\ AC^2\ +\ AB^2}$$
$$BC\ =\ \sqrt{\ 12^2\ +\ 16^{\ 2}}\ =\ \sqrt{\ 144+256}\ =\ 20$$
The length BD = BC + CD = 20 + 12 = 32 cm
The correct answer is option D.
A quadrilateral ABCD has side AD parallel to BC. If it is given that ∠ABC = 90°, BC = 5 cm and AD = 14 cm. It is also given that the perimeter of this quadrilateral is 46 cm, then its area, in sq. cm, is
Solution
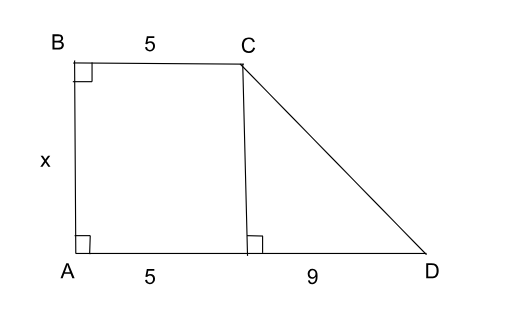
Let the value of AB be x.
Using the Pythagoras theorem, we get,
$$CD^2\ =\ x^2\ +\ 9^2$$
$$CD\ =\ \sqrt{x^2\ +\ 9^2\ }$$
The perimeter is given as,
x + 5 + $$\sqrt{x^2\ +\ 9^2\ }$$ + 14 = 46
$$\sqrt{x^2\ +\ 9^2\ }\ =\ 46\ -\ 19\ -\ x$$
$$\sqrt{x^2\ +\ 81\ }\ =\ 27\ -\ x$$
Squaring on both sides, we get,
$$x^2\ +\ 81\ \ =\ 729\ +\ x^2\ -\ 54x$$
$$54x=\ 729\ -\ 81\ =\ 648$$
$$x\ =\ 12$$ cm
$$CD\ =\ \sqrt{\ 144\ +\ 81}\ =\ 15$$ cm
Area of the quadrilateral = area if rectangle + area of triangle
area of rectangle = 12 * 5 = 60 sq. cm
area if triangle = $$\dfrac{1}{2}\ \times\ 9\ \times\ 12$$ = 54 sq. cm
Area of quadrilateral = 60 + 54 = 114 sq. cm
The correct answer is option B.
The number of diagonals to a regular polygon A is given as 20. What is the exterior angle of the regular polygon A?
Solution
The number of diagonals formula is given as $$\dfrac{n\left(n\ -\ 3\right)}{2}$$. The number of diagonals is given as 20 in the questions. The number of sides can be calculated as.
$$\dfrac{n\left(n\ -\ 3\right)}{2}\ =\ 20$$
$$n\left(n\ -\ 3\right)\ =\ 40$$
$$n^2\ -3n\ -\ 40\ =\ 0$$
$$n^2\ -\ 8n+\ 5n\ -\ 40\ =\ 0$$
$$\left(n\ +\ 5\right)\left(n\ -\ 8\right)\ =\ 0$$
$$n\ =\ 8\ or\ n\ =\ -5$$
Since n cannot be negative, the value of n is 8.
The exterior angle can be calculated as $$\dfrac{360}{n}\ =\ \dfrac{360}{8}\ =\ 45^{\circ\ }$$
The correct answer is option B.
At a high school anniversary program, students from only classes 9 and 10 participated. 65% of participating students are boys. If a boy is picked, the probability of the boy being picked to be a class 10 student is 0.3. What is the probability of picking a class 9 girl student if the ratio of class 9 students to 10 is 3:2?
Solution
It is given that 65% of the total are boys. So, the probability of picking a boy is 0.65.
We are given that if a boy is picked, the probability of the boy being a class 10 student is 0.3.
Using Bayes theorem $$P\left(10\left|B\right|\right)=\frac{P\left(10\ \bigcap\ B\right)}{P\left(B\right)}$$
$$0.3=\frac{P\left(10\ \bigcap\ B\right)}{0.65}$$
$$P\left(10\ \bigcap\ B\right)=0.3\times0.65\ =\ 0.195$$
$$P\left(9\ \bigcap\ B\right)=0.65-0.195\ =\ 0.455$$
We are told that class 9 and 10 students are in 3:2. So the probability of picking class 9 students is 0.6.
We know that $$P\left(9\ \bigcap\ B\right) =\ 0.455$$. From this $$P\left(9\ \bigcap\ G\right)=0.6-0.455\ =\ 0.145$$
Raman has three unbiased dice, and he rolls them simultaneously. Find the probability that the sum of numbers obtained on the three unbiased dice is not more than 14.
Solution
The sum of numbers obtained should not be more than 14.
We will calculate all the possibilities to get a sum of 15,16,17 and 18 to find the probability of getting the sum of more than 14, and subtract it from 1 to get the probability that the sum of numbers obtained on the three unbiased
dice is not more than 14.
When three dice are rolled, the maximum sum that can be obtained is 18.
So, in the given question, the sum can be 15 or 16 or 17 or 18
For the sum to be 15, there are possibilities:
1. (6,6,3) - total cases = $$\dfrac{3!}{2!}$$ = 3
2. (6,5,4) - total cases = 3! = 6
3. (5,5,5) - total cases = 1
For the sum to be 16, there can be two possibilities:
1. (6 , 6 , 4) - total cases = $$\dfrac{3!}{2!}$$ = 3
2. (6, 5, 5) - total cases = $$\dfrac{3!}{2!}$$ = 3
For the sum to be 17, there can be only one possibility:
1. (6, 6, 5) - total cases = $$\dfrac{3!}{2!}$$ = 3
For the sum to be 18, there is only one case, which is (6, 6, 6)
So, the no. of favourable outcomes such that sum is greater than 14 = (10+ 3 + 3 + 3 + 1) = 20
Total no. of outcomes = 6 * 6 * 6 = 216
Required probability =1- $$\dfrac{20}{216}$$ = $$\dfrac{196}{216}$$ = $$\dfrac{49}{54}$$
Hence, option A is the correct answer.
What is the sum of all possible values of x such that $$8^x\ =\ 3^{x^2}$$?
Solution
The equation given is,
$$8^x\ =\ 3^{x^2}$$
Applying log on both sides, we get,
$$\log8^x\ =\ \log3^{x^2}$$
$$x\log8\ =\ x^2\log3$$
$$\ x^2\log3\ -\ x\log8\ =\ 0$$
$$\ x\left(x\log3\ -\ \log8\right)\ =\ 0$$
So, the solutions of the above equation are x = 0 and xlog3 = log8, which can also be written as $$\ x\ =\ \dfrac{\log8}{\log3}\ =\ \log_38$$
The sum of all possible values is $$0\ +\ \log_38\ =\ \log_38$$ which can also be written as $$\log_32\ +\ \log_34$$.
The correct answer is option B.
