Instructions
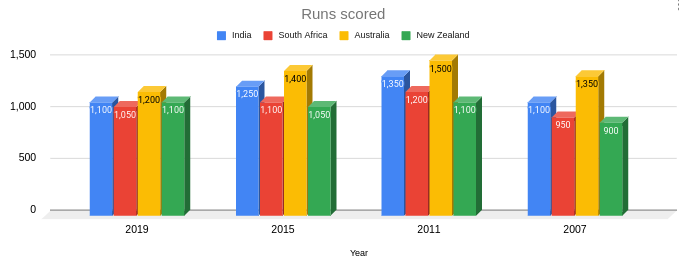
The following graph shows the number of runs scored by four teams in World Cup tournaments over four different years.
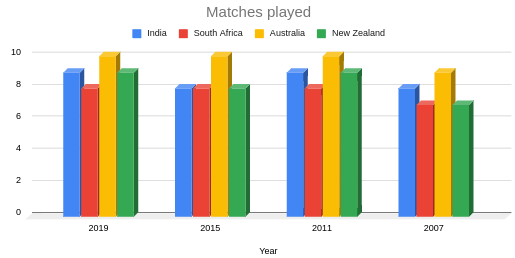
The graph below shows the number of matches played by four teams in past four year's World Cup tournament.
Solution
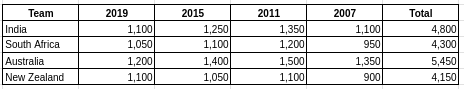
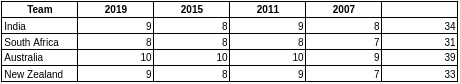
We have to find the second highest among $$\frac{4800}{34}$$, $$\frac{4300}{31}$$, $$\frac{5450}{39}$$, $$\frac{4150}{33}$$.
The second highest is $$\frac{5450}{39}$$=139.74. Hence, Australia is the answer.
Get AI Help

SRCC Quant Questions | SRCC Quantitative Ability
SRCC DILR Questions | LRDI Questions For SRCC
SRCC Verbal Ability Questions | VARC Questions For SRCC
Free SRCC DILR Questions
Book Free CAT Mentorship
Get personalized CAT strategy from a 99%iler
500+ students mentored
OTP Verification
Enter the 6-digit code sent to your phone
Booking Summary
Session:Free CAT Mentorship
Phone:
Date:
Time:
Enter OTP
Didn't receive the OTP?


