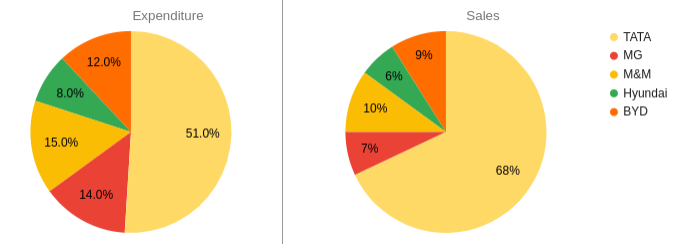
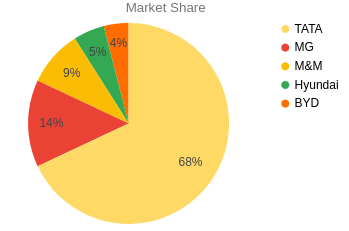
The following charts represent the expenditure and sales of five companies that produce electric vehicles. The combined sales and expenditure of all five companies are 1.5 million dollars and 1 million dollars, respectively. The sales and expenditure data pertain exclusively to electric vehicles. The market share given in the below graph represents the number of vehicles sold by that company as a percentage of the total vehicles sold.
Based on this data answer the following questions.
Solution
Highest profit per car = $$\frac{\text{Total}\ \text{profit}}{\text{Market share}}$$
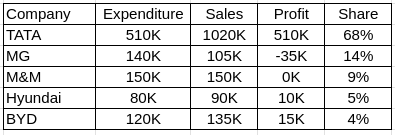
Profit is positive for TATA, Hyundai, BYD. Let 100x be the total number of cars sold.
TATA's profit per car = 7.5/x
Hyundai's profit per car = 2/x
BYD's profit per car = 3.75/x
So, this is highest for TATA.
Get AI Help

SRCC Quant Questions | SRCC Quantitative Ability
SRCC DILR Questions | LRDI Questions For SRCC
SRCC Verbal Ability Questions | VARC Questions For SRCC
Free SRCC DILR Questions
Book Free CAT Mentorship
Get personalized CAT strategy from a 99%iler
500+ students mentored
OTP Verification
Enter the 6-digit code sent to your phone
Booking Summary
Enter OTP
Didn't receive the OTP?


