75+ CAT Data Change Over a Period Questions PDF With Video Solutions
Practice Data Change Over a Period questions for CAT with detailed video solutions. Practice questions from CAT Previous Year Papers to get a fair idea of kind of questions being asked in the CAT exam. These sets essentially require you to master techniques of computation, concepts of percentages, ratios and mental calculations to ace these kind of sets. Student should also learn different techniques of representing information to get to know the other contextual clues in the exam and also check out the free CAT mock tests and understand the types of questions that are likely to appear on the exam.
Note: No Sign-Up is required to download the PDF
CAT Data Change Over A Period Questions Weightage Over Past 5 Years
Year | Weightage |
| 2024 | 0 |
| 2023 | 4 |
2022 | 0 |
2021 | 4 |
| 2020 | 0 |
CAT 2021 Data change over a period questions
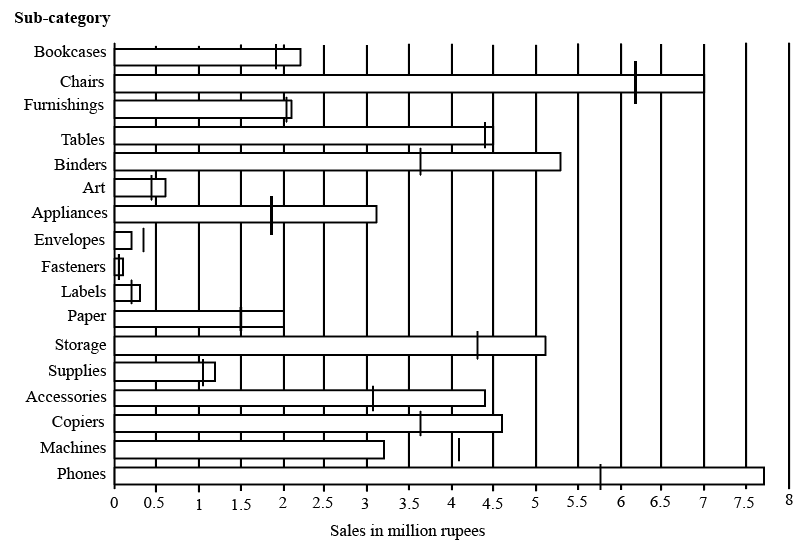
The horizontal bars in the above diagram represent 2020 aggregate sales (in ₹ million) of a company for the different subcategories of its products. The top four product subcategories (Bookcases, Chairs, Furnishings, Tables) belong to furniture product category; the bottom four product subcategories (Accessories, Copiers, Machines, Phones) belong to the technology product category while all other product subcategories belong to the office supply product category. For each of the product subcategories, there is a vertical line indicating the sales of the corresponding subcategory in 2019.
Question 1
The total sales (in ₹ million) in 2019 from products in office supplies category is closest to
correct answer:-3
Instruction for set 1:
The horizontal bars in the above diagram represent 2020 aggregate sales (in ₹ million) of a company for the different subcategories of its products. The top four product subcategories (Bookcases, Chairs, Furnishings, Tables) belong to furniture product category; the bottom four product subcategories (Accessories, Copiers, Machines, Phones) belong to the technology product category while all other product subcategories belong to the office supply product category. For each of the product subcategories, there is a vertical line indicating the sales of the corresponding subcategory in 2019.
Question 2
The percentage increase in sales in Furniture category from 2019 to 2020 is closest to
correct answer:-2
Instruction for set 1:
The horizontal bars in the above diagram represent 2020 aggregate sales (in ₹ million) of a company for the different subcategories of its products. The top four product subcategories (Bookcases, Chairs, Furnishings, Tables) belong to furniture product category; the bottom four product subcategories (Accessories, Copiers, Machines, Phones) belong to the technology product category while all other product subcategories belong to the office supply product category. For each of the product subcategories, there is a vertical line indicating the sales of the corresponding subcategory in 2019.
Question 3
How many subcategories had sales of ₹ 4 million or more in 2019 and registered an increase in sales in excess of 25% in 2020?
correct answer:-1
Instruction for set 1:
The horizontal bars in the above diagram represent 2020 aggregate sales (in ₹ million) of a company for the different subcategories of its products. The top four product subcategories (Bookcases, Chairs, Furnishings, Tables) belong to furniture product category; the bottom four product subcategories (Accessories, Copiers, Machines, Phones) belong to the technology product category while all other product subcategories belong to the office supply product category. For each of the product subcategories, there is a vertical line indicating the sales of the corresponding subcategory in 2019.
Question 4
The improvement index for a category is the maximum percentage increase in sales from 2019 to 2020 among any of its subcategories. The correct order of categories in increasing order of this improvement index is
correct answer:-1
CAT 2017 Data change over a period questions
There are 21 employees working in a division, out of whom 10 are special-skilled employees (SE) and the remaining are regular-skilled employees (RE). During the next five months, the division has to complete five projects every month. Out of the 25 projects, 5 projects are "challenging", while the remaining ones are "standard". Each of the challenging projects has to be completed in different months. Every month, five teams — T1 T2, T3, T4 and T5, work on one project each. T1, T2, T3, T4 and T5 are allotted the challenging project in the first, second, third, fourth and fifth month, respectively. The team assigned the challenging project has one more employee than the rest.
In the first month, T1 has one more SE than T2, T2 has one more SE than T3, T 3 has one more SE than T4, and T4 has one more SE than T5. Between two successive months, the composition of the teams changes as follows:
a. The team allotted the challenging project, gets two SE from the team which was allotted the challenging project in the previous month. In exchange, one RE is shifted from the former team to the latter team.
b. After the above exchange, if T1 has any SE and T5 has any RE, then one SE is shifted from T1 to T5, and one RE is shifted from T5 to T1. Also, if T2 has any SE and T4 has any RE, then one SE is shifted from T2 to T4, and one RE is shifted from T4 to T2.
Each standard project has a total of 100 credit points, while each challenging project has 200 credit points. The credit points are equally shared between the employees included in that team.
Question 1
The number of times in which the composition of team T2 and the number of times in which composition of team T4 remained unchanged in two successive months are:
correct answer:-2
Instruction for set 1:
There are 21 employees working in a division, out of whom 10 are special-skilled employees (SE) and the remaining are regular-skilled employees (RE). During the next five months, the division has to complete five projects every month. Out of the 25 projects, 5 projects are "challenging", while the remaining ones are "standard". Each of the challenging projects has to be completed in different months. Every month, five teams — T1 T2, T3, T4 and T5, work on one project each. T1, T2, T3, T4 and T5 are allotted the challenging project in the first, second, third, fourth and fifth month, respectively. The team assigned the challenging project has one more employee than the rest.
In the first month, T1 has one more SE than T2, T2 has one more SE than T3, T 3 has one more SE than T4, and T4 has one more SE than T5. Between two successive months, the composition of the teams changes as follows:
a. The team allotted the challenging project, gets two SE from the team which was allotted the challenging project in the previous month. In exchange, one RE is shifted from the former team to the latter team.
b. After the above exchange, if T1 has any SE and T5 has any RE, then one SE is shifted from T1 to T5, and one RE is shifted from T5 to T1. Also, if T2 has any SE and T4 has any RE, then one SE is shifted from T2 to T4, and one RE is shifted from T4 to T2.
Each standard project has a total of 100 credit points, while each challenging project has 200 credit points. The credit points are equally shared between the employees included in that team.
Question 2
The number of SE in T1 and T5 for the projects in the third month are, respectively:
correct answer:-1
Instruction for set 1:
There are 21 employees working in a division, out of whom 10 are special-skilled employees (SE) and the remaining are regular-skilled employees (RE). During the next five months, the division has to complete five projects every month. Out of the 25 projects, 5 projects are "challenging", while the remaining ones are "standard". Each of the challenging projects has to be completed in different months. Every month, five teams — T1 T2, T3, T4 and T5, work on one project each. T1, T2, T3, T4 and T5 are allotted the challenging project in the first, second, third, fourth and fifth month, respectively. The team assigned the challenging project has one more employee than the rest.
In the first month, T1 has one more SE than T2, T2 has one more SE than T3, T 3 has one more SE than T4, and T4 has one more SE than T5. Between two successive months, the composition of the teams changes as follows:
a. The team allotted the challenging project, gets two SE from the team which was allotted the challenging project in the previous month. In exchange, one RE is shifted from the former team to the latter team.
b. After the above exchange, if T1 has any SE and T5 has any RE, then one SE is shifted from T1 to T5, and one RE is shifted from T5 to T1. Also, if T2 has any SE and T4 has any RE, then one SE is shifted from T2 to T4, and one RE is shifted from T4 to T2.
Each standard project has a total of 100 credit points, while each challenging project has 200 credit points. The credit points are equally shared between the employees included in that team.
Question 3
Which of the following CANNOT be the total credit points earned by any employee from the projects?
correct answer:-2
Instruction for set 1:
There are 21 employees working in a division, out of whom 10 are special-skilled employees (SE) and the remaining are regular-skilled employees (RE). During the next five months, the division has to complete five projects every month. Out of the 25 projects, 5 projects are "challenging", while the remaining ones are "standard". Each of the challenging projects has to be completed in different months. Every month, five teams — T1 T2, T3, T4 and T5, work on one project each. T1, T2, T3, T4 and T5 are allotted the challenging project in the first, second, third, fourth and fifth month, respectively. The team assigned the challenging project has one more employee than the rest.
In the first month, T1 has one more SE than T2, T2 has one more SE than T3, T 3 has one more SE than T4, and T4 has one more SE than T5. Between two successive months, the composition of the teams changes as follows:
a. The team allotted the challenging project, gets two SE from the team which was allotted the challenging project in the previous month. In exchange, one RE is shifted from the former team to the latter team.
b. After the above exchange, if T1 has any SE and T5 has any RE, then one SE is shifted from T1 to T5, and one RE is shifted from T5 to T1. Also, if T2 has any SE and T4 has any RE, then one SE is shifted from T2 to T4, and one RE is shifted from T4 to T2.
Each standard project has a total of 100 credit points, while each challenging project has 200 credit points. The credit points are equally shared between the employees included in that team.
Question 4
One of the employees named Aneek scored 185 points. Which of the following CANNOT be true?
correct answer:-4
CAT 2007 Data change over a period questions
Directions for the following four questions:
Answer the following questions based on the information given below.
The following table shows the break-up of actual costs incurred by a company in last five years (year 2002 to year 2006) to produce a particular product.

The production capacity of the company is 2000 units. The selling price for the year 2006 was Rs. 125 per unit. Some costs change almost in direct proportion to the change in volume of production, while others do not follow any obvious pattern of change with respect to the volume of production and hence are considered fixed. Using the information provided for the year 2006 as the basis for projecting the figures for the year 2007, answer the following questions:
Question 1
What is the approximate cost per unit in rupees, if the company produces and sells 1400 units in the year 2007?
correct answer:-2
Instruction for set 1:
Directions for the following four questions:
Answer the following questions based on the information given below.
The following table shows the break-up of actual costs incurred by a company in last five years (year 2002 to year 2006) to produce a particular product.
The production capacity of the company is 2000 units. The selling price for the year 2006 was Rs. 125 per unit. Some costs change almost in direct proportion to the change in volume of production, while others do not follow any obvious pattern of change with respect to the volume of production and hence are considered fixed. Using the information provided for the year 2006 as the basis for projecting the figures for the year 2007, answer the following questions:
Question 2
What is the minimum number of units that the company needs to produce and sell to avoid any loss?
correct answer:-3
Instruction for set 1:
Directions for the following four questions:
Answer the following questions based on the information given below.
The following table shows the break-up of actual costs incurred by a company in last five years (year 2002 to year 2006) to produce a particular product.
The production capacity of the company is 2000 units. The selling price for the year 2006 was Rs. 125 per unit. Some costs change almost in direct proportion to the change in volume of production, while others do not follow any obvious pattern of change with respect to the volume of production and hence are considered fixed. Using the information provided for the year 2006 as the basis for projecting the figures for the year 2007, answer the following questions:
Question 3
If the company reduces the price by 5%, it can produce and sell as many units as it desires. How many units the company should produce to maximize its profit?
correct answer:-5
Instruction for set 1:
Directions for the following four questions:
Answer the following questions based on the information given below.
The following table shows the break-up of actual costs incurred by a company in last five years (year 2002 to year 2006) to produce a particular product.
The production capacity of the company is 2000 units. The selling price for the year 2006 was Rs. 125 per unit. Some costs change almost in direct proportion to the change in volume of production, while others do not follow any obvious pattern of change with respect to the volume of production and hence are considered fixed. Using the information provided for the year 2006 as the basis for projecting the figures for the year 2007, answer the following questions:
Question 4
Given that the company cannot sell more than 1700 units, and it will have to reduce the price by Rs.5 for all units if it wants to sell more than 1400 units. What is the maximum profit that can be realized provided that the company sells more than 1400 units?
correct answer:-2
CAT 2003 Data change over a period questions
DIRECTIONS for the following three questions: Answer the questions on the basis of the information given below.
Spam that enters our electronic mailboxes can be classified under several spam heads. The following table shows the distribution of such spam worldwide over time. The total number of spam emails received during December 2002 was larger than the number received in June 2003. The total number of spam emails received during September 2002 was larger than the number received in March 2003. The figures in the table represent the percentage of all spam emails received during that period, falling into those respective categories.

Question 1
In which category was the percentage of spam emails increasing but at a decreasing rate?
correct answer:-3
Instruction for set 1:
DIRECTIONS for the following three questions: Answer the questions on the basis of the information given below.
Spam that enters our electronic mailboxes can be classified under several spam heads. The following table shows the distribution of such spam worldwide over time. The total number of spam emails received during December 2002 was larger than the number received in June 2003. The total number of spam emails received during September 2002 was larger than the number received in March 2003. The figures in the table represent the percentage of all spam emails received during that period, falling into those respective categories.
Question 2
In the health category, the number of spam emails received in December 2002 as compared to June 2003.
correct answer:-1
Instruction for set 1:
DIRECTIONS for the following three questions: Answer the questions on the basis of the information given below.
Spam that enters our electronic mailboxes can be classified under several spam heads. The following table shows the distribution of such spam worldwide over time. The total number of spam emails received during December 2002 was larger than the number received in June 2003. The total number of spam emails received during September 2002 was larger than the number received in March 2003. The figures in the table represent the percentage of all spam emails received during that period, falling into those respective categories.
Question 3
In the financial category, the number of spam emails received in September 2002 as compared to March 2003.
correct answer:-4
Instruction for set 2:
DIRECTIONS for the following three questions: Answer the questions on the basis of the information given below.

One of the functions of the Reserve Bank of India is to mobilize funds for the Government of India by issuing securities. The following table shows details of funds mobilized during the period July 2002 - July 2003. Notice that on each date there were two rounds of issues, each with a different maturity.
Question 4
How many times was the issue of securities under-subscribed, i.e., how often did the total amount mobilized fall short of the amount notified?
correct answer:-2
Instruction for set 2:
DIRECTIONS for the following three questions: Answer the questions on the basis of the information given below.
One of the functions of the Reserve Bank of India is to mobilize funds for the Government of India by issuing securities. The following table shows details of funds mobilized during the period July 2002 - July 2003. Notice that on each date there were two rounds of issues, each with a different maturity.
Question 5
Which of the following is true?
correct answer:-3
Instruction for set 2:
DIRECTIONS for the following three questions: Answer the questions on the basis of the information given below.
One of the functions of the Reserve Bank of India is to mobilize funds for the Government of India by issuing securities. The following table shows details of funds mobilized during the period July 2002 - July 2003. Notice that on each date there were two rounds of issues, each with a different maturity.
Question 6
Which of the following statements is NOT true?
correct answer:-4
CAT 2002 Data change over a period questions
The following table shows the revenue and expenses in millions of Euros (European currency) associated with REPSOL YPF company’s oil and gas producing activities in operations in different parts of the world for 1998-2000.

Question 1
How many operations (Spain, North Africa and Middle East,..) of the company accounted for less than 5% of the total revenue earned in 1999?
correct answer:-3
Instruction for set 1:
The following table shows the revenue and expenses in millions of Euros (European currency) associated with REPSOL YPF company’s oil and gas producing activities in operations in different parts of the world for 1998-2000.
Question 2
How many operations (Spain, North Africa and Middle East…) of the company witnessed more than 200% increase in revenue from 1999 to 2000?
correct answer:-2