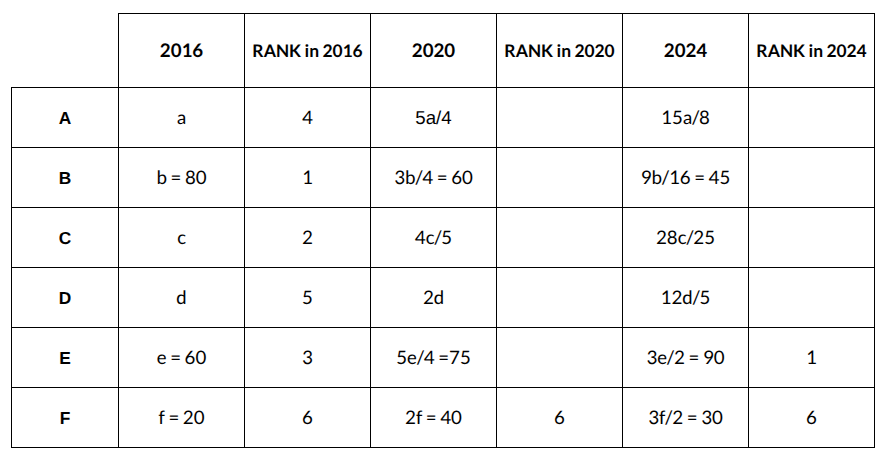
Let us assume the values of A, B, C, D, E and F to be a, b, c, d, e and f in 2016.
For A:
Value in 2020 = increased by 25% from 2016 = $$\left(1\ +\ \dfrac{25}{100}\right)a$$ = $$\dfrac{5}{4}a$$
Value in 2024 = increased by 50% from 2020 = $$\left(1\ +\ \dfrac{50}{100}\right)\times\ \dfrac{5a}{4}$$ = $$\dfrac{15}{8}a$$
For B:
Value in 2020 = decreased by 25% from 2016 = $$\left(1\ -\ \dfrac{25}{100}\right)b$$ = $$\dfrac{3}{4}b$$
Value in 2024 = decreased by 25% from 2020 = $$\left(1\ -\ \dfrac{25}{100}\right)\times\ \dfrac{3b}{4}$$ = $$\dfrac{9}{16}b$$
For C:
Value in 2020 = decreased by 20% from 2016 = $$\left(1\ -\ \dfrac{20}{100}\right)c$$ = $$\dfrac{4}{5}c$$
Value in 2024 = increased by 40% from 2020 = $$\left(1\ +\ \dfrac{40}{100}\right)\times\ \dfrac{4c}{5}$$ = $$\dfrac{28}{25}c$$
For D:
Value in 2020 = increased by 100% from 2016 = $$\left(1\ +\ \dfrac{100}{100}\right)d$$ = $$2d$$
Value in 2024 = increased by 20% from 2020 = $$\left(1\ +\ \dfrac{20}{100}\right)\times\ 2d$$ = $$\dfrac{12}{5}d$$
For E:
Value in 2020 = increased by 25% from 2016 = $$\left(1\ +\ \dfrac{25}{100}\right)e$$ = $$\dfrac{5}{4}e$$
Value in 2024 = increased by 20% from 2020 = $$\left(1\ +\ \dfrac{20}{100}\right)\times\ \dfrac{5e}{4}$$ = $$\dfrac{3}{2}e$$
For F:
Value in 2020 = increased by 100% from 2016 = $$\left(1\ +\ \dfrac{100}{100}\right)f$$ = $$2f$$
Value in 2024 = decreased by 25% from 2020 = $$\left(1\ -\ \dfrac{25}{100}\right)\times\ 2f$$ = $$\dfrac{3}{2}f$$
We are given that the value of E is 90 in 2024. We can calculate the value of e as,
$$\dfrac{3e}{2}\ =\ 90$$
$$e\ =\ 60$$
The value of E in 2016 is 60, and its value in 2020 can be calculated as,
$$\dfrac{5e}{4}\ =\ \dfrac{5}{4}\times\ 60\ =\ 75$$
We are given that B, C, E, and A had ranks 1, 2, 3, and 4, respectively, in 2016, and F has the lowest rank(6) in all the years.
Putting the values in the table, we get,

We know that F is ranked 6 and B is ranked 1 in 2016, and we are also given that the range of SI in 2016 and 2024 is 60. This means that the value of b-f = 60, and we can conclude that b is definitely greater than 60, as we know that f is an integer greater than 0.
We know that all the SI values in all the years are integers, and for SI of B to be an integer in 2024, the value of b must be a multiple of 16. The multiples of 16 that are greater than 60 and less than 100 are 64, 80 and 96.
CASE 1: b = 64
If b = 64, then the value of f becomes 4, as we know b - f = 60.
If f = 4, then the value of F in 2024 is 3f/2 = 12/2 = 6.
We already know the value of E in 2024 is 90.
In that case, the range of SI in 2024 is at least 90 - 6 = 84, but we are given that the range is 60 in 2024, which is not possible in this case.
So, we can eliminate this case.
CASE 2: b = 96
If b = 96, then the value of f becomes 36, as we know b - f = 60.
If f = 36, then the value of F in 2024 is 3f/2 = 108/2 = 54.
The value of B in 2024 = 9b/16 = (9 * 96)/16 = 54
We calculated the value of B and F to be 54 in 2024, which is not possible, as we are given that F had a lower SI than any other country in 2024, and we obtained its value to be the same as B.
So, we can eliminate this case.
CASE 3: b = 80
If b = 80, then the value of f becomes 20, as we know b - f = 60.
If f = 20, then the value of F in 2024 is 3f/2 = 60/2 = 30.
The value of B in 2024 = 9b/16 = (9 * 80)/16 = 45
We can see that no condition is violated in this case, as F is less than B in 2024, and the range in 2024 from the obtained values as of now is 90 - 30 = 60.
So, we can conclude that the value of b = 80 and f = 20.
Substituting the values in the table, we get,
We know that C is ranked 2nd in 2016, and we know the values of 1st and 3rd to be 80 and 60. We also know that SI of C has to be integers in 2016, 2020 and 2024. So, for the value of SI of C to be an integer in 2024, the value of c has to be a multiple of 25.
So, we know that c lies between 80 and 60, and is also a multiple of 25. The only multiple of 25 that lies between 60 and 80 is 75. So, the value of c has to be 75, and the value of C in 2024 can be calculated as,
C in 2024 = 28c/25 = (28 * 75)/25 = 84.
Hence, the correct answer is 84.