Read the following information on ‘Sectoral Trends in Mergers & Acquisitions in India (2001-02 to 2006-07)’ given in Tables below and answer the questions.
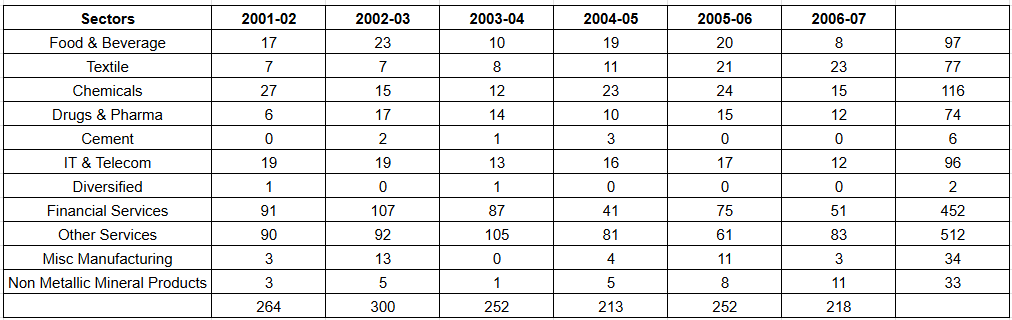
Table: Sector wise Number of ‘Mergers & Acquisitions’

Table: Sector wise Number of ‘Mergers’

If the turbulence over a period is defined by the sum of each of the differences (in absolute terms) in number of mergers & acquisitions on a year-on-year basis, then which sector is considered most turbulent for the entire period (2001 - 02 to 2006 - 07)?
Solution
From the given table, we can calculate two tables. One for mergers and one for acquisitions.
For Mergers,
For Acquisitions,
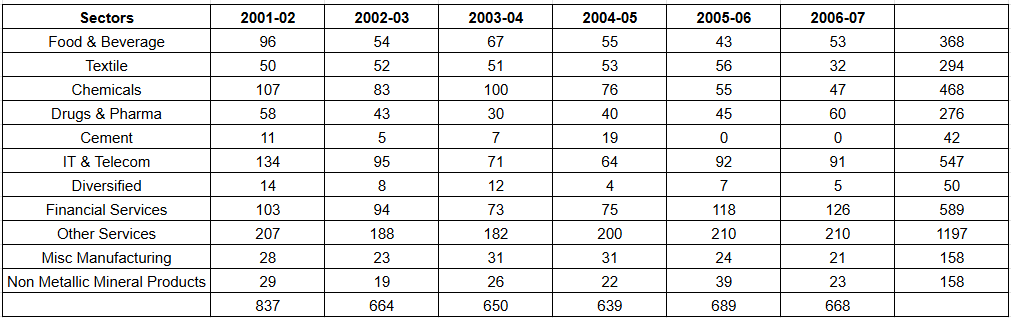
The turbulence for the Financial Service sector is much higher when compared to the other sectors.
Turbulence for the Financial service sector can be calculated as (201-194)+(201-160)+(160-116)+(193-116)+(193-177)= 185
Similarly, turbulence for the IT and Telecom sector = 108
Turbulence for Food and Beverage = 50
Turbulence for other sectors = 62
Get AI Help
Create a FREE account and get:
- All Quant Formulas and shortcuts PDF
- 170+ previous papers with solutions PDF
- Top 5000+ MBA exam Solved Questions for Free

IIFT Quant Questions | IIFT Quantitative Ability
IIFT DILR Questions | LRDI Questions For IIFT
IIFT Verbal Ability Questions | VARC Questions For IIFT
Free IIFT DILR Questions
Book Free CAT Mentorship
Get personalized CAT strategy from a 99%iler
500+ students mentored
OTP Verification
Enter the 6-digit code sent to your phone
Booking Summary
Enter OTP
Didn't receive the OTP?


