Read the following information, graph and table and answer the questions that follow.
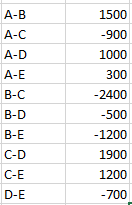
Ellen Inc. is a Mumbai based company which sells five products branded as A, B, C, D and E in India. Anita looks after entire sales of North India working from regional office in Delhi. She was preparing for annual review meeting scheduled next day in Mumbai. She was attempting to analyse sales in North India for the seven year period from 2009 to 2015. She first calculated average sales in rupees of all the five brands and constructed a table exhibiting the difference between average sales of each pair of brands as shown in the following table:

Average Sales of Product A minus Average Sales of Product B
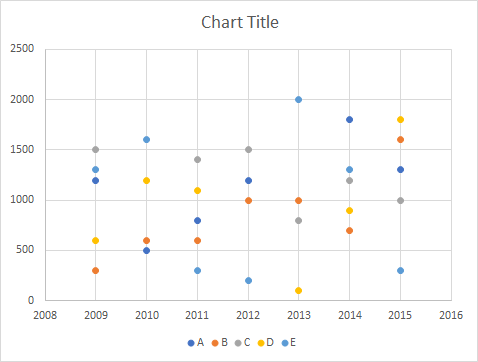
After taking a print out of the above table, she attempted to look at the trend of sales and plotted a graph in MS Excel. Later she took a print out of the graph and left for a meeting. While on her way she figured out that due to some printer cartridge problem sales of Product A in 2013, Product C in 2010, and Product D in 2012 were not visible in the graph as reproduced below. Anita had to make some quick calculations to arrive at the information outlined in the following question.

Solution
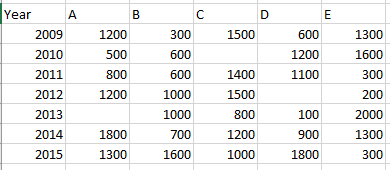
On Tabulating the chart , we get

Since difference in average sales is given
Difference in sales can be found out by multiplying it by 7

Let the sales of A in 2013 be a , C in 2010 be c, d in 2012 be d
Total sales of A = (6800+a)
B = 5800
C = (7400+c)
D = (5700+d)
E = 7000
On evaluating we get value of a = 500,c=800,d= 600 crores
Sales of product A = 7300
Sales of product B = 5800
Sales of product D = 6300
Sales of product E = 7000
Product B has the least average sales.
Hence B is the correct answer.
Create a FREE account and get:
- All Quant Formulas and shortcuts PDF
- 170+ previous papers with solutions PDF
- Top 5000+ MBA exam Solved Questions for Free

