Answer the questions based on the following graphs


The ratio between absolute increase in domestic sales over preceding year and absolute increase in production over the preceding year is highest during which year?
Solution
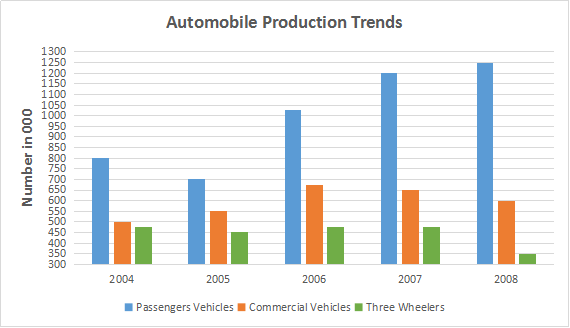
Total automobile production in the year 2004 = 800+500+475 = 1775
Total automobile production in the year 2005 = 700+550+450 = 1700
Total automobile production in the year 2006 = 1025+675+475 = 2175
Total automobile production in the year 2007 = 1200+650+475 = 2325
Total automobile production in the year 2008 = 1250+600+350 = 2200
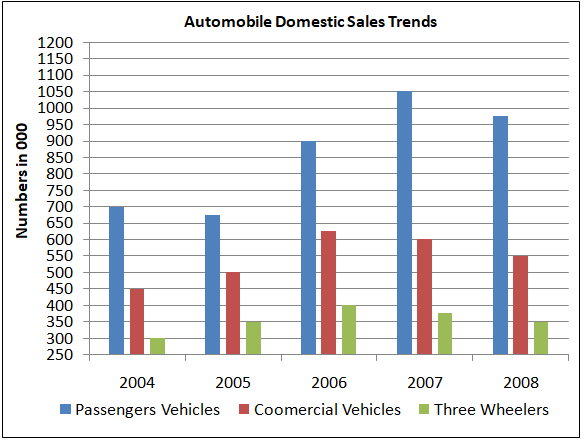
Total domestic sales of automobiles in the year 2004 = (700+450+300) = 1450
Total domestic sales of automobiles in the year 2005 = (675+500+350) = 1525
Total domestic sales of automobiles in the year 2006 = (900+625+400) = 1925
Total domestic sales of automobiles in the year 2007 = (1050+600+375) = 2025
Total domestic sales of automobiles in the year 2008 = (975+550+350) = 1875
In the year 2005 and 2008 the production and sales respectively are not increasing absolutely. Hence, we will check only for the year 2006 and 2007.
The ratio between absolute increase in domestic sales in the year 2006 over the year 2005 and absolute increase in production in the year 2006 over the year 2005 = $$\dfrac{1925-1525}{2175-1700}$$ = 0.84
Similarly, the required ratio for year 2007 = $$\dfrac{2025-1925}{2325-2175}$$ = 0.66
Hence, we can say that the ratio is the highest for the year 2006. Therefore, option B is the correct answer.
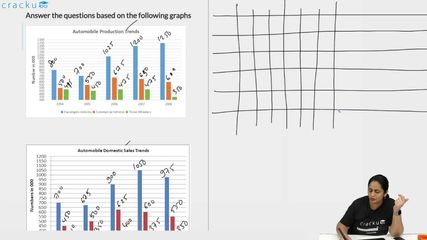
Video Solution

Click on the Email ☝️ to Watch the Video Solution
Create a FREE account and get:
- All Quant Formulas and shortcuts PDF
- 170+ previous papers with solutions PDF
- Top 5000+ MBA exam Solved Questions for Free

