Instructions
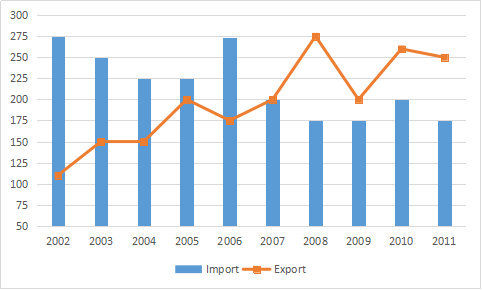
Analyse the following chart showing the exports and imports of Sono Ltd. and answer the questions based on this chart
Solution
The annual % increase in exports is as shown below:-
2003 = -ve
2004 = -ve
2005 = $$0\%$$
2006 = -$$\frac{275-200}{200} = 22.22\%$$
2007 = -ve
2008 = -ve
2009 = $$0\%$$
2010 = $$\frac{200-175}{175} = 14.28\%$$.
Thus, year 2010 saw the second largest annual percentage increase in imports.
Get AI Help
Create a FREE account and get:
- All Quant Formulas and shortcuts PDF
- 170+ previous papers with solutions PDF
- Top 5000+ MBA exam Solved Questions for Free

IIFT Quant Questions | IIFT Quantitative Ability
IIFT Number Systems QuestionsIIFT Number Series QuestionsIIFT Probability, Combinatorics QuestionsIIFT Quadratic Equations QuestionsIIFT Averages QuestionsIIFT Coordinate Geometry QuestionsIIFT Mensuration QuestionsIIFT Geometry QuestionsIIFT Algebra QuestionsIIFT Miscellaneous QuestionsIIFT Logarithms, Surds and Indices QuestionsIIFT Simple Interest Compound Interest QuestionsIIFT Time, Speed and Distance QuestionsIIFT Profit and Loss QuestionsIIFT Inequalities QuestionsIIFT Functions, Graphs and Statistics QuestionsIIFT Time Speed Distance QuestionsIIFT Venn Diagrams QuestionsIIFT Remainders QuestionsIIFT Linear Equations QuestionsIIFT Data Sufficiency QuestionsIIFT Arithmetic QuestionsIIFT Percentages QuestionsIIFT Averages Mixtures Alligations QuestionsIIFT Averages, Ratio and Proportion QuestionsIIFT Time And Work QuestionsIIFT Progressions and Series QuestionsIIFT Profit And Loss QuestionsIIFT Logarithms Questions
IIFT DILR Questions | LRDI Questions For IIFT
IIFT 2D & 3D LR QuestionsIIFT Quant Based DI QuestionsIIFT Special Charts QuestionsIIFT Puzzles QuestionsIIFT DI Miscellaneous QuestionsIIFT Selection With Condition QuestionsIIFT Miscellaneous LR QuestionsIIFT Data Interpretation QuestionsIIFT Coins and Weights QuestionsIIFT DI with connected data sets QuestionsIIFT Data Interpretation Basics QuestionsIIFT Routes And Networks QuestionsIIFT Maxima-Minima QuestionsIIFT Truth Lie Concept QuestionsIIFT Table based DI Sets QuestionsIIFT Venn Diagrams QuestionsIIFT Games and Tournamnents QuestionsIIFT Quant Based LR QuestionsIIFT Arrangement QuestionsIIFT Scheduling QuestionsIIFT Data change over a period QuestionsIIFT Charts Questions
IIFT Verbal Ability Questions | VARC Questions For IIFT
Free IIFT DILR Questions
IIFT Table based DI SetsIIFT Coins and WeightsIIFT Miscellaneous LRIIFT DI MiscellaneousIIFT Routes And NetworksIIFT Quant Based LRIIFT ChartsIIFT Selection With ConditionIIFT Special ChartsIIFT Truth Lie ConceptIIFT Data Interpretation BasicsIIFT SchedulingIIFT Quant Based DIIIFT Data InterpretationIIFT Venn DiagramsIIFT ArrangementIIFT Data change over a periodIIFT PuzzlesIIFT Games and TournamnentsIIFT Maxima-MinimaIIFT 2D & 3D LRIIFT DI with connected data sets
Book Free CAT Mentorship
Get personalized CAT strategy from a 99%iler
500+ students mentored
OTP Verification
Enter the 6-digit code sent to your phone
Booking Summary
Session:Free CAT Mentorship
Phone:
Date:
Time:
Enter OTP
Didn't receive the OTP?


