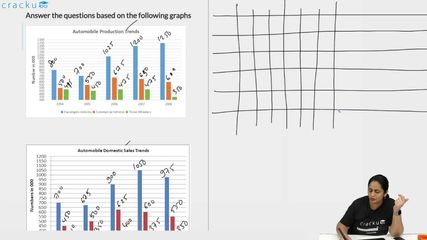
Answer the questions based on the following graphs
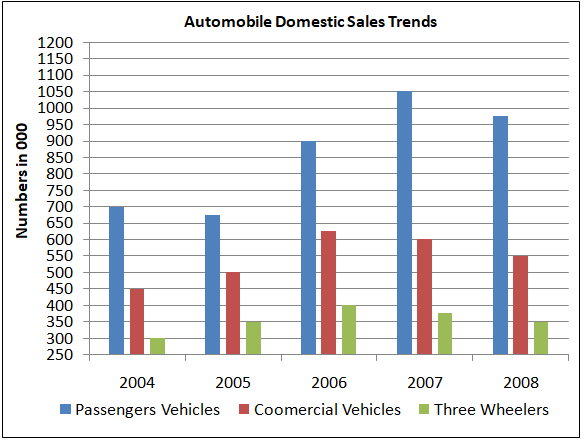
For which year were the domestic sales of automobiles closest to the average (2004-2008) domestic sales of automobiles?
Solution
Total domestic sales of automobiles in the year 2004 = (700+450+300) = 1450
Total domestic sales of automobiles in the year 2005 = (675+500+350) = 1525
Total domestic sales of automobiles in the year 2006 = (900+625+400) = 1925
Total domestic sales of automobiles in the year 2007 = (1050+600+375) = 2025
Total domestic sales of automobiles in the year 2008 = (975+550+350) = 1875
Average domestic sales of automobiles for the given period = $$\dfrac{1450+1525+1925+2025+1875}{5}$$ = 1760.
Hence, we can say that the domestic sales in the year 2008 is the closest to the average domestic sales. Hence, option D is the correct answer.
Get AI Help
Video Solution
Click on the Email ☝️ to Watch the Video Solution
Create a FREE account and get:
- All Quant Formulas and shortcuts PDF
- 170+ previous papers with solutions PDF
- Top 5000+ MBA exam Solved Questions for Free

IIFT Quant Questions | IIFT Quantitative Ability
IIFT DILR Questions | LRDI Questions For IIFT
IIFT Verbal Ability Questions | VARC Questions For IIFT
Free IIFT DILR Questions
Book Free CAT Mentorship
Get personalized CAT strategy from a 99%iler
500+ students mentored
OTP Verification
Enter the 6-digit code sent to your phone
Booking Summary
Enter OTP
Didn't receive the OTP?


