 Group
Group

Top 100 CAT 2025 DILR Questions PDF
Cracku’s Top 100 CAT 2025 DILR Questions PDF with Video Solutions is a perfect guide to improve your Data Interpretation and Logical Reasoning skills. It includes important CAT DILR sets like tables, graphs, charts, puzzles, arrangements, Venn diagrams, networks, and games, helping you build strong logical thinking.
Each set comes with an easy video explanation so you can understand the method, learn shortcuts, and solve questions faster. Whether you aim for a 99+ percentile or want to improve your basics, these 100 sets cover all levels of CAT 2025 DILR section.
Why Practice Cracku’s Top 100 DILR Questions?
The CAT DILR section needs clear thinking and quick interpretation. Practicing well-designed sets with step-by-step videos helps you:
-
Understand all major DILR patterns
-
Learn smart methods to solve sets faster
-
Improve accuracy and data interpretation
-
Manage time better in the exam
-
Gain confidence for tough DILR sets
With this PDF and video solutions, you can revise quickly, clear doubts easily, and strengthen your overall CAT DILR preparation for CAT 2025.
Also Read, CAT 2025 DILR Topic-wise Questions PDF (Most Expected)
List of Top 100 CAT 2025 DILR Questions
Answer the following questions based on the information given below:
In a sports event, six teams (A, B, C, D, E and F) are competing against each other Matches are scheduled in two stages. Each team plays three matches in Stage – I and two matches in Stage – II. No team plays against the same team more than once in the event. No ties are permitted in any of the matches. The observations after the completion of Stage – I and Stage – II are as given below.
Stage-I:
• One team won all the three matches.
• Two teams lost all the matches.
• D lost to A but won against C and F.
• E lost to B but won against C and F.
• B lost at least one match.
• F did not play against the top team of Stage-I.
Stage-II:
• The leader of Stage-I lost the next two matches
• Of the two teams at the bottom after Stage-I, one team won both matches, while the other lost both matches.
• One more team lost both matches in Stage-II.
Question 1
The two teams that defeated the leader of Stage-I are:
correct answer:- 2
Answer the following questions based on the information given below:
In a sports event, six teams (A, B, C, D, E and F) are competing against each other Matches are scheduled in two stages. Each team plays three matches in Stage – I and two matches in Stage – II. No team plays against the same team more than once in the event. No ties are permitted in any of the matches. The observations after the completion of Stage – I and Stage – II are as given below.
Stage-I:
• One team won all the three matches.
• Two teams lost all the matches.
• D lost to A but won against C and F.
• E lost to B but won against C and F.
• B lost at least one match.
• F did not play against the top team of Stage-I.
Stage-II:
• The leader of Stage-I lost the next two matches
• Of the two teams at the bottom after Stage-I, one team won both matches, while the other lost both matches.
• One more team lost both matches in Stage-II.
Question 2
The only team(s) that won both matches in Stage-II is (are):
correct answer:- 4
Answer the following questions based on the information given below:
In a sports event, six teams (A, B, C, D, E and F) are competing against each other Matches are scheduled in two stages. Each team plays three matches in Stage – I and two matches in Stage – II. No team plays against the same team more than once in the event. No ties are permitted in any of the matches. The observations after the completion of Stage – I and Stage – II are as given below.
Stage-I:
• One team won all the three matches.
• Two teams lost all the matches.
• D lost to A but won against C and F.
• E lost to B but won against C and F.
• B lost at least one match.
• F did not play against the top team of Stage-I.
Stage-II:
• The leader of Stage-I lost the next two matches
• Of the two teams at the bottom after Stage-I, one team won both matches, while the other lost both matches.
• One more team lost both matches in Stage-II.
Question 3
The teams that won exactly two matches in the event are:
correct answer:- 5
Answer the following questions based on the information given below:
In a sports event, six teams (A, B, C, D, E and F) are competing against each other Matches are scheduled in two stages. Each team plays three matches in Stage – I and two matches in Stage – II. No team plays against the same team more than once in the event. No ties are permitted in any of the matches. The observations after the completion of Stage – I and Stage – II are as given below.
Stage-I:
• One team won all the three matches.
• Two teams lost all the matches.
• D lost to A but won against C and F.
• E lost to B but won against C and F.
• B lost at least one match.
• F did not play against the top team of Stage-I.
Stage-II:
• The leader of Stage-I lost the next two matches
• Of the two teams at the bottom after Stage-I, one team won both matches, while the other lost both matches.
• One more team lost both matches in Stage-II.
Question 4
The team(s) with the most wins in the event is (are):
correct answer:- 5
Directions for the following four questions: Answer the questions on the basis of the information given below.
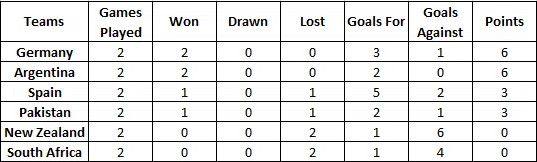
The year was 2006. All six teams in Pool A of World Cup hockey, play each other exactly once.
Each win earns a team three points, a draw earns one point and a loss earns zero points. The two teams with the highest points qualify for the semifinals. In case of a tie, the team with the highest goal difference (Goal For . Goals Against) qualifies.
In the opening match, Spain lost to Germany.
After the second round (after each team played two matches), the pool table looked as shown below.

In the third round, Spain played Pakistan, Argentina played Germany, and New Zealand played South Africa. All the third round matches were drawn. The following are some results from the fourth and fifth round matches
(a) Spain won both the fourth and fifth round matches.
(b) Both Argentina and Germany won their fifth round matches by 3 goals to 0.
(c) Pakistan won both the fourth and fifth round matches by 1 goal to 0.
Question 5
Which one of the following statements is true about matches played in the first two rounds?
correct answer:- 4
Directions for the following four questions: Answer the questions on the basis of the information given below.
The year was 2006. All six teams in Pool A of World Cup hockey, play each other exactly once.
Each win earns a team three points, a draw earns one point and a loss earns zero points. The two teams with the highest points qualify for the semifinals. In case of a tie, the team with the highest goal difference (Goal For . Goals Against) qualifies.
In the opening match, Spain lost to Germany.
After the second round (after each team played two matches), the pool table looked as shown below.

In the third round, Spain played Pakistan, Argentina played Germany, and New Zealand played South Africa. All the third round matches were drawn. The following are some results from the fourth and fifth round matches
(a) Spain won both the fourth and fifth round matches.
(b) Both Argentina and Germany won their fifth round matches by 3 goals to 0.
(c) Pakistan won both the fourth and fifth round matches by 1 goal to 0.
Question 6
Which one of the following statements is true about matches played in the first two rounds?
correct answer:- 2
Directions for the following four questions: Answer the questions on the basis of the information given below.
The year was 2006. All six teams in Pool A of World Cup hockey, play each other exactly once.
Each win earns a team three points, a draw earns one point and a loss earns zero points. The two teams with the highest points qualify for the semifinals. In case of a tie, the team with the highest goal difference (Goal For . Goals Against) qualifies.
In the opening match, Spain lost to Germany.
After the second round (after each team played two matches), the pool table looked as shown below.
In the third round, Spain played Pakistan, Argentina played Germany, and New Zealand played South Africa. All the third round matches were drawn. The following are some results from the fourth and fifth round matches
(a) Spain won both the fourth and fifth round matches.
(b) Both Argentina and Germany won their fifth round matches by 3 goals to 0.
(c) Pakistan won both the fourth and fifth round matches by 1 goal to 0.
Question 7
If Pakistan qualified as one of the two teams from Pool A, which was the other team that qualified?
correct answer:- 4
Directions for the following four questions: Answer the questions on the basis of the information given below.
The year was 2006. All six teams in Pool A of World Cup hockey, play each other exactly once.
Each win earns a team three points, a draw earns one point and a loss earns zero points. The two teams with the highest points qualify for the semifinals. In case of a tie, the team with the highest goal difference (Goal For . Goals Against) qualifies.
In the opening match, Spain lost to Germany.
After the second round (after each team played two matches), the pool table looked as shown below.

In the third round, Spain played Pakistan, Argentina played Germany, and New Zealand played South Africa. All the third round matches were drawn. The following are some results from the fourth and fifth round matches
(a) Spain won both the fourth and fifth round matches.
(b) Both Argentina and Germany won their fifth round matches by 3 goals to 0.
(c) Pakistan won both the fourth and fifth round matches by 1 goal to 0.
Question 8
Which team finished at the top of the pool after five rounds of matches?
correct answer:- 4
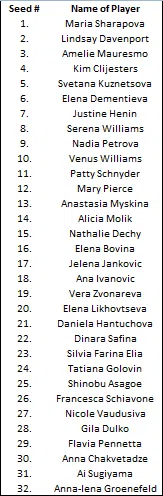
In the table below is the listing of players, seeded from highest (#1) to lowest (#32), who are due to play in an Association of Tennis Players (ATP) tournament for women. This tournament has four knockout rounds before the final, i.e., first round, second round, quarterfinals, and semi-finals. In the first round, the highest seeded player plays the lowest seeded player (seed # 32) which is designated match No. 1 of first round; the 2nd seeded player plays the 31st seeded player which is designated match No. 2 of the first round, and so on. Thus, for instance, match No. 16 of first round is to be played between 16th seeded player and the 17th seeded player. In the second round, the winner of match No. 1 of first round plays the winner of match No. 16 of first round and is designated match No. 1 of second round. Similarly, the winner of match No. 2 of first round plays the winner of match No. 15 of first round, and is designated match No. 2 of second round. Thus, for instance, match No. 8 of the second round is to be played between the winner of match No. 8 of first round and the winner of match No. 9 of first round. The same pattern is followed for later rounds as well.

Question 9
If there are no upsets (a lower seeded player beating a higher seeded player) in the first round, and only match Nos. 6, 7, and 8 of the second round result in upsets, then who would meet Lindsay Davenport in quarter finals, in case Davenport reaches quarter finals?
correct answer:- 4
In the table below is the listing of players, seeded from highest (#1) to lowest (#32), who are due to play in an Association of Tennis Players (ATP) tournament for women. This tournament has four knockout rounds before the final, i.e., first round, second round, quarterfinals, and semi-finals. In the first round, the highest seeded player plays the lowest seeded player (seed # 32) which is designated match No. 1 of first round; the 2nd seeded player plays the 31st seeded player which is designated match No. 2 of the first round, and so on. Thus, for instance, match No. 16 of first round is to be played between 16th seeded player and the 17th seeded player. In the second round, the winner of match No. 1 of first round plays the winner of match No. 16 of first round and is designated match No. 1 of second round. Similarly, the winner of match No. 2 of first round plays the winner of match No. 15 of first round, and is designated match No. 2 of second round. Thus, for instance, match No. 8 of the second round is to be played between the winner of match No. 8 of first round and the winner of match No. 9 of first round. The same pattern is followed for later rounds as well.

Question 10
If Elena Dementieva and Serena Williams lose in the second round, while Justine Henin and Nadia Petrova make it to the semi-finals, then who would play Maria Sharapova in the quarterfinals, in the event Sharapova reaches quarterfinals?
correct answer:- 3

In the table below is the listing of players, seeded from highest (#1) to lowest (#32), who are due to play in an Association of Tennis Players (ATP) tournament for women. This tournament has four knockout rounds before the final, i.e., first round, second round, quarterfinals, and semi-finals. In the first round, the highest seeded player plays the lowest seeded player (seed # 32) which is designated match No. 1 of first round; the 2nd seeded player plays the 31st seeded player which is designated match No. 2 of the first round, and so on. Thus, for instance, match No. 16 of first round is to be played between 16th seeded player and the 17th seeded player. In the second round, the winner of match No. 1 of first round plays the winner of match No. 16 of first round and is designated match No. 1 of second round. Similarly, the winner of match No. 2 of first round plays the winner of match No. 15 of first round, and is designated match No. 2 of second round. Thus, for instance, match No. 8 of the second round is to be played between the winner of match No. 8 of first round and the winner of match No. 9 of first round. The same pattern is followed for later rounds as well.

Question 11
If, in the first round, all even numbered matches (and none of the odd numbered ones) result in upsets, and there are no upsets in the second round, then who could be the lowest seeded player facing Maria Sharapova in semi-finals?
correct answer:- 1
In the table below is the listing of players, seeded from highest (#1) to lowest (#32), who are due to play in an Association of Tennis Players (ATP) tournament for women. This tournament has four knockout rounds before the final, i.e., first round, second round, quarterfinals, and semi-finals. In the first round, the highest seeded player plays the lowest seeded player (seed # 32) which is designated match No. 1 of first round; the 2nd seeded player plays the 31st seeded player which is designated match No. 2 of the first round, and so on. Thus, for instance, match No. 16 of first round is to be played between 16th seeded player and the 17th seeded player. In the second round, the winner of match No. 1 of first round plays the winner of match No. 16 of first round and is designated match No. 1 of second round. Similarly, the winner of match No. 2 of first round plays the winner of match No. 15 of first round, and is designated match No. 2 of second round. Thus, for instance, match No. 8 of the second round is to be played between the winner of match No. 8 of first round and the winner of match No. 9 of first round. The same pattern is followed for later rounds as well.
Question 12
If the top eight seeds make it to the quarterfinals, then who, amongst the players listed below, would definitely not play against Maria Sharapova in the final, in case Sharapova reaches the final?
correct answer:- 3
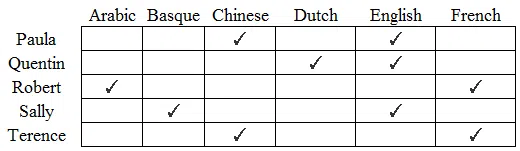
In the table below the check marks indicate all languages spoken by five people: Paula, Quentin, Robert, Sally and Terence. For example, Paula speaks only Chinese and English.

These five people form three teams, Team 1, Team 2 and Team 3. Each team has either 2 or 3 members. A team is said to speak a particular language if at least one of its members speak that language.
The following facts are known.
(1) Each team speaks exactly four languages and has the same number of members.
(2) English and Chinese are spoken by all three teams, Basque and French by exactly two teams and the other languages by exactly one team.
(3) None of the teams include both Quentin and Robert.
(4) Paula and Sally are together in exactly two teams.
(5) Robert is in Team 1 and Quentin is in Team 3.
Question 13
Who among the following four is not a member of Team 2?
correct answer:- 3
In the table below the check marks indicate all languages spoken by five people: Paula, Quentin, Robert, Sally and Terence. For example, Paula speaks only Chinese and English.
These five people form three teams, Team 1, Team 2 and Team 3. Each team has either 2 or 3 members. A team is said to speak a particular language if at least one of its members speak that language.
The following facts are known.
(1) Each team speaks exactly four languages and has the same number of members.
(2) English and Chinese are spoken by all three teams, Basque and French by exactly two teams and the other languages by exactly one team.
(3) None of the teams include both Quentin and Robert.
(4) Paula and Sally are together in exactly two teams.
(5) Robert is in Team 1 and Quentin is in Team 3.
Question 14
Who among the following four people is a part of exactly two teams?
correct answer:- 3
In the table below the check marks indicate all languages spoken by five people: Paula, Quentin, Robert, Sally and Terence. For example, Paula speaks only Chinese and English.

These five people form three teams, Team 1, Team 2 and Team 3. Each team has either 2 or 3 members. A team is said to speak a particular language if at least one of its members speak that language.
The following facts are known.
(1) Each team speaks exactly four languages and has the same number of members.
(2) English and Chinese are spoken by all three teams, Basque and French by exactly two teams and the other languages by exactly one team.
(3) None of the teams include both Quentin and Robert.
(4) Paula and Sally are together in exactly two teams.
(5) Robert is in Team 1 and Quentin is in Team 3.
Question 15
Who among the five people is a member of all teams?
correct answer:- 3
In the table below the check marks indicate all languages spoken by five people: Paula, Quentin, Robert, Sally and Terence. For example, Paula speaks only Chinese and English.

These five people form three teams, Team 1, Team 2 and Team 3. Each team has either 2 or 3 members. A team is said to speak a particular language if at least one of its members speak that language.
The following facts are known.
(1) Each team speaks exactly four languages and has the same number of members.
(2) English and Chinese are spoken by all three teams, Basque and French by exactly two teams and the other languages by exactly one team.
(3) None of the teams include both Quentin and Robert.
(4) Paula and Sally are together in exactly two teams.
(5) Robert is in Team 1 and Quentin is in Team 3.
Question 16
Apart from Chinese and English, which languages are spoken by Team 1?
correct answer:- 1
Three reviewers Amal, Bimal, and Komal are tasked with selecting questions from a pool of 13 questions (Q01 to Q13). Questions can be created by external “subject matter experts” (SMEs) or by one of the three reviewers. Each of the reviewers either approves or disapproves a question that is shown to them. Their decisions lead to eventual acceptance or rejection of the question in the manner described below.
If a question is created by an SME, it is reviewed first by Amal, and then by Bimal. If both of them approve the question, then the question is accepted and is not reviewed by Komal. If both disapprove the question, it is rejected and is not reviewed by Komal. If one of them approves the question and the other disapproves it, then the question is reviewed by Komal. Then the question is accepted only if she approves it.
A question created by one of the reviewers is decided upon by the other two. If a question is created by Amal, then it is first reviewed by Bimal. If Bimal approves the question, then it is accepted. Otherwise, it is reviewed by Komal. The question is then accepted only if Komal approves it. A similar process is followed for questions created by Bimal, whose questions are first reviewed by Komal, and then by Amal only if Komal disapproves it. Questions created by Komal are first reviewed by Amal, and then, if required, by Bimal.
The following facts are known about the review process after its completion.
1. Q02, Q06, Q09, Q11, and Q12 were rejected and the other questions were accepted.
2. Amal reviewed only Q02, Q03, Q04, Q06, Q08, Q10, Q11, and Q13.
3. Bimal reviewed only Q02, Q04, Q06 through Q09, Q12, and Q13.
4. Komal reviewed only Q01 through Q05, Q07, Q08, Q09, Q11, and Q12.
Question 17
How many questions were DEFINITELY created by Amal?
correct answer:- 3
Three reviewers Amal, Bimal, and Komal are tasked with selecting questions from a pool of 13 questions (Q01 to Q13). Questions can be created by external “subject matter experts” (SMEs) or by one of the three reviewers. Each of the reviewers either approves or disapproves a question that is shown to them. Their decisions lead to eventual acceptance or rejection of the question in the manner described below.
If a question is created by an SME, it is reviewed first by Amal, and then by Bimal. If both of them approve the question, then the question is accepted and is not reviewed by Komal. If both disapprove the question, it is rejected and is not reviewed by Komal. If one of them approves the question and the other disapproves it, then the question is reviewed by Komal. Then the question is accepted only if she approves it.
A question created by one of the reviewers is decided upon by the other two. If a question is created by Amal, then it is first reviewed by Bimal. If Bimal approves the question, then it is accepted. Otherwise, it is reviewed by Komal. The question is then accepted only if Komal approves it. A similar process is followed for questions created by Bimal, whose questions are first reviewed by Komal, and then by Amal only if Komal disapproves it. Questions created by Komal are first reviewed by Amal, and then, if required, by Bimal.
The following facts are known about the review process after its completion.
1. Q02, Q06, Q09, Q11, and Q12 were rejected and the other questions were accepted.
2. Amal reviewed only Q02, Q03, Q04, Q06, Q08, Q10, Q11, and Q13.
3. Bimal reviewed only Q02, Q04, Q06 through Q09, Q12, and Q13.
4. Komal reviewed only Q01 through Q05, Q07, Q08, Q09, Q11, and Q12.
Question 18
How many questions were DEFINITELY created by Komal?
correct answer:- 1
Three reviewers Amal, Bimal, and Komal are tasked with selecting questions from a pool of 13 questions (Q01 to Q13). Questions can be created by external “subject matter experts” (SMEs) or by one of the three reviewers. Each of the reviewers either approves or disapproves a question that is shown to them. Their decisions lead to eventual acceptance or rejection of the question in the manner described below.
If a question is created by an SME, it is reviewed first by Amal, and then by Bimal. If both of them approve the question, then the question is accepted and is not reviewed by Komal. If both disapprove the question, it is rejected and is not reviewed by Komal. If one of them approves the question and the other disapproves it, then the question is reviewed by Komal. Then the question is accepted only if she approves it.
A question created by one of the reviewers is decided upon by the other two. If a question is created by Amal, then it is first reviewed by Bimal. If Bimal approves the question, then it is accepted. Otherwise, it is reviewed by Komal. The question is then accepted only if Komal approves it. A similar process is followed for questions created by Bimal, whose questions are first reviewed by Komal, and then by Amal only if Komal disapproves it. Questions created by Komal are first reviewed by Amal, and then, if required, by Bimal.
The following facts are known about the review process after its completion.
1. Q02, Q06, Q09, Q11, and Q12 were rejected and the other questions were accepted.
2. Amal reviewed only Q02, Q03, Q04, Q06, Q08, Q10, Q11, and Q13.
3. Bimal reviewed only Q02, Q04, Q06 through Q09, Q12, and Q13.
4. Komal reviewed only Q01 through Q05, Q07, Q08, Q09, Q11, and Q12.
Question 19
How many questions were DEFINITELY created by the SMEs?
correct answer:- 3
Three reviewers Amal, Bimal, and Komal are tasked with selecting questions from a pool of 13 questions (Q01 to Q13). Questions can be created by external “subject matter experts” (SMEs) or by one of the three reviewers. Each of the reviewers either approves or disapproves a question that is shown to them. Their decisions lead to eventual acceptance or rejection of the question in the manner described below.
If a question is created by an SME, it is reviewed first by Amal, and then by Bimal. If both of them approve the question, then the question is accepted and is not reviewed by Komal. If both disapprove the question, it is rejected and is not reviewed by Komal. If one of them approves the question and the other disapproves it, then the question is reviewed by Komal. Then the question is accepted only if she approves it.
A question created by one of the reviewers is decided upon by the other two. If a question is created by Amal, then it is first reviewed by Bimal. If Bimal approves the question, then it is accepted. Otherwise, it is reviewed by Komal. The question is then accepted only if Komal approves it. A similar process is followed for questions created by Bimal, whose questions are first reviewed by Komal, and then by Amal only if Komal disapproves it. Questions created by Komal are first reviewed by Amal, and then, if required, by Bimal.
The following facts are known about the review process after its completion.
1. Q02, Q06, Q09, Q11, and Q12 were rejected and the other questions were accepted.
2. Amal reviewed only Q02, Q03, Q04, Q06, Q08, Q10, Q11, and Q13.
3. Bimal reviewed only Q02, Q04, Q06 through Q09, Q12, and Q13.
4. Komal reviewed only Q01 through Q05, Q07, Q08, Q09, Q11, and Q12.
Question 20
How many questions were DEFINITELY disapproved by Bimal?
correct answer:- 2

Three reviewers Amal, Bimal, and Komal are tasked with selecting questions from a pool of 13 questions (Q01 to Q13). Questions can be created by external “subject matter experts” (SMEs) or by one of the three reviewers. Each of the reviewers either approves or disapproves a question that is shown to them. Their decisions lead to eventual acceptance or rejection of the question in the manner described below.
If a question is created by an SME, it is reviewed first by Amal, and then by Bimal. If both of them approve the question, then the question is accepted and is not reviewed by Komal. If both disapprove the question, it is rejected and is not reviewed by Komal. If one of them approves the question and the other disapproves it, then the question is reviewed by Komal. Then the question is accepted only if she approves it.
A question created by one of the reviewers is decided upon by the other two. If a question is created by Amal, then it is first reviewed by Bimal. If Bimal approves the question, then it is accepted. Otherwise, it is reviewed by Komal. The question is then accepted only if Komal approves it. A similar process is followed for questions created by Bimal, whose questions are first reviewed by Komal, and then by Amal only if Komal disapproves it. Questions created by Komal are first reviewed by Amal, and then, if required, by Bimal.
The following facts are known about the review process after its completion.
1. Q02, Q06, Q09, Q11, and Q12 were rejected and the other questions were accepted.
2. Amal reviewed only Q02, Q03, Q04, Q06, Q08, Q10, Q11, and Q13.
3. Bimal reviewed only Q02, Q04, Q06 through Q09, Q12, and Q13.
4. Komal reviewed only Q01 through Q05, Q07, Q08, Q09, Q11, and Q12.
Question 21
The approval ratio of a reviewer is the ratio of the number of questions (s)he approved to the number of questions (s)he reviewed. Which option best describes Amal’s approval ratio?
correct answer:- 4
Three reviewers Amal, Bimal, and Komal are tasked with selecting questions from a pool of 13 questions (Q01 to Q13). Questions can be created by external “subject matter experts” (SMEs) or by one of the three reviewers. Each of the reviewers either approves or disapproves a question that is shown to them. Their decisions lead to eventual acceptance or rejection of the question in the manner described below.
If a question is created by an SME, it is reviewed first by Amal, and then by Bimal. If both of them approve the question, then the question is accepted and is not reviewed by Komal. If both disapprove the question, it is rejected and is not reviewed by Komal. If one of them approves the question and the other disapproves it, then the question is reviewed by Komal. Then the question is accepted only if she approves it.
A question created by one of the reviewers is decided upon by the other two. If a question is created by Amal, then it is first reviewed by Bimal. If Bimal approves the question, then it is accepted. Otherwise, it is reviewed by Komal. The question is then accepted only if Komal approves it. A similar process is followed for questions created by Bimal, whose questions are first reviewed by Komal, and then by Amal only if Komal disapproves it. Questions created by Komal are first reviewed by Amal, and then, if required, by Bimal.
The following facts are known about the review process after its completion.
1. Q02, Q06, Q09, Q11, and Q12 were rejected and the other questions were accepted.
2. Amal reviewed only Q02, Q03, Q04, Q06, Q08, Q10, Q11, and Q13.
3. Bimal reviewed only Q02, Q04, Q06 through Q09, Q12, and Q13.
4. Komal reviewed only Q01 through Q05, Q07, Q08, Q09, Q11, and Q12.
Question 22
How many questions created by Amal or Bimal were disapproved by at least one of the other reviewers?
correct answer:- 3
There are only four neighbourhoods in a city - Levmisto, Tyhrmisto, Pesmisto and Kitmisto.During the onset of a pandemic, the number of new cases of a disease in each of these neighbourhoods was recorded over a period of five days. On each day, the number of newcases recorded in any of the neighbourhoods was either 0, 1, 2 or 3.
The following facts are also known:
1.There was at least one new case in every neighbourhood on Day 1.
2.On each of the five days, there were more new cases in Kitmisto than in Pesmisto.
3.The number of new cases in the city in a day kept increasing during the five-day period. The number of new cases on Day 3 was exactly one more than that on Day 2.
4.The maximum number of new cases in a day in Pesmisto was 2, and this happened only once during the five-day period.
5.Kitmisto is the only place to have 3 new cases on Day 2.
6.The total numbers of new cases in Levmisto, Tyhrmisto, Pesmisto and Kitmisto over the five-day period were 12, 12, 5 and 14 respectively.
Question 23
What BEST can be concluded about the total number of new cases in the city on Day2?
correct answer:- 4
There are only four neighbourhoods in a city - Levmisto, Tyhrmisto, Pesmisto and Kitmisto.During the onset of a pandemic, the number of new cases of a disease in each of these neighbourhoods was recorded over a period of five days. On each day, the number of newcases recorded in any of the neighbourhoods was either 0, 1, 2 or 3.
The following facts are also known:
1.There was at least one new case in every neighbourhood on Day 1.
2.On each of the five days, there were more new cases in Kitmisto than in Pesmisto.
3.The number of new cases in the city in a day kept increasing during the five-day period. The number of new cases on Day 3 was exactly one more than that on Day 2.
4.The maximum number of new cases in a day in Pesmisto was 2, and this happened only once during the five-day period.
5.Kitmisto is the only place to have 3 new cases on Day 2.
6.The total numbers of new cases in Levmisto, Tyhrmisto, Pesmisto and Kitmisto over the five-day period were 12, 12, 5 and 14 respectively.
Question 24
What BEST can be concluded about the number of new cases in Levmisto on Day 3?
correct answer:- 3
There are only four neighbourhoods in a city - Levmisto, Tyhrmisto, Pesmisto and Kitmisto.During the onset of a pandemic, the number of new cases of a disease in each of these neighbourhoods was recorded over a period of five days. On each day, the number of newcases recorded in any of the neighbourhoods was either 0, 1, 2 or 3.
The following facts are also known:
1.There was at least one new case in every neighbourhood on Day 1.
2.On each of the five days, there were more new cases in Kitmisto than in Pesmisto.
3.The number of new cases in the city in a day kept increasing during the five-day period. The number of new cases on Day 3 was exactly one more than that on Day 2.
4.The maximum number of new cases in a day in Pesmisto was 2, and this happened only once during the five-day period.
5.Kitmisto is the only place to have 3 new cases on Day 2.
6.The total numbers of new cases in Levmisto, Tyhrmisto, Pesmisto and Kitmisto over the five-day period were 12, 12, 5 and 14 respectively.
Question 25
On which day(s) did Pesmisto not have any new case?
correct answer:- 1
There are only four neighbourhoods in a city - Levmisto, Tyhrmisto, Pesmisto and Kitmisto.During the onset of a pandemic, the number of new cases of a disease in each of these neighbourhoods was recorded over a period of five days. On each day, the number of newcases recorded in any of the neighbourhoods was either 0, 1, 2 or 3.
The following facts are also known:
1.There was at least one new case in every neighbourhood on Day 1.
2.On each of the five days, there were more new cases in Kitmisto than in Pesmisto.
3.The number of new cases in the city in a day kept increasing during the five-day period. The number of new cases on Day 3 was exactly one more than that on Day 2.
4.The maximum number of new cases in a day in Pesmisto was 2, and this happened only once during the five-day period.
5.Kitmisto is the only place to have 3 new cases on Day 2.
6.The total numbers of new cases in Levmisto, Tyhrmisto, Pesmisto and Kitmisto over the five-day period were 12, 12, 5 and 14 respectively.
Question 26
Which of the two statements below is/are necessarily false?
Statement A: There were 2 new cases in Tyhrmisto on Day 3.
Statement B: There were no new cases in Pesmisto on Day 2.
correct answer:- 4
There are only four neighbourhoods in a city - Levmisto, Tyhrmisto, Pesmisto and Kitmisto.During the onset of a pandemic, the number of new cases of a disease in each of these neighbourhoods was recorded over a period of five days. On each day, the number of newcases recorded in any of the neighbourhoods was either 0, 1, 2 or 3.
The following facts are also known:
1.There was at least one new case in every neighbourhood on Day 1.
2.On each of the five days, there were more new cases in Kitmisto than in Pesmisto.
3.The number of new cases in the city in a day kept increasing during the five-day period. The number of new cases on Day 3 was exactly one more than that on Day 2.
4.The maximum number of new cases in a day in Pesmisto was 2, and this happened only once during the five-day period.
5.Kitmisto is the only place to have 3 new cases on Day 2.
6.The total numbers of new cases in Levmisto, Tyhrmisto, Pesmisto and Kitmisto over the five-day period were 12, 12, 5 and 14 respectively.
Question 27
On how many days did Levmisto and Tyhrmisto have the same number of new cases?
correct answer:- 4
Read the following scenario and answer the THREE questions that follow.
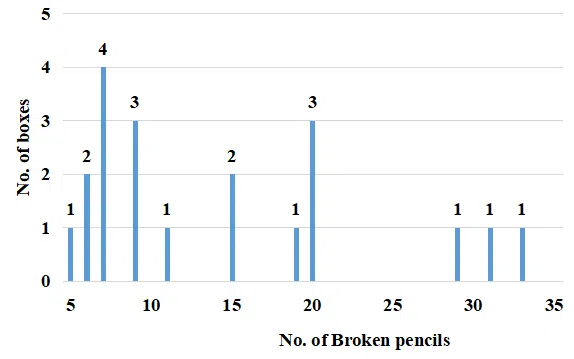
A pencil maker ships pencils in boxes of size 50, 100 and 200. Due to packaging issues, some pencils break. About the 20 boxes he has supplied to a shop, the following information is available:
* Box no. 1 through 6 have 50 pencils, Box no. 7 through 16 have 100 pencils and Box no. 17 through 20 have 200 pencils.
* No box has less than 5% or more than 20% broken pencils.
Following is the frequency table of the number of broken pencils for the twenty boxes:

Question 28
Which of the following can possibly be the sequence of the number of brokenpencils in Boxes 7-16?
correct answer:- 3
Read the following scenario and answer the THREE questions that follow.
A pencil maker ships pencils in boxes of size 50, 100 and 200. Due to packaging issues, some pencils break. About the 20 boxes he has supplied to a shop, the following information is available:
* Box no. 1 through 6 have 50 pencils, Box no. 7 through 16 have 100 pencils and Box no. 17 through 20 have 200 pencils.
* No box has less than 5% or more than 20% broken pencils.
Following is the frequency table of the number of broken pencils for the twenty boxes:
Question 29
Which of the following cannot be inferred conclusively from the given information?
correct answer:- 4
Read the following scenario and answer the THREE questions that follow.
A pencil maker ships pencils in boxes of size 50, 100 and 200. Due to packaging issues, some pencils break. About the 20 boxes he has supplied to a shop, the following information is available:
* Box no. 1 through 6 have 50 pencils, Box no. 7 through 16 have 100 pencils and Box no. 17 through 20 have 200 pencils.
* No box has less than 5% or more than 20% broken pencils.
Following is the frequency table of the number of broken pencils for the twenty boxes:

Question 30
Suppose that additionally it is known that the number of broken pencils in Boxes 17-20 are in increasing order. Which among the following additional information, if true, is not sufficient to uniquely know the number of defective pencils in each of the boxes numbered 17-20?
correct answer:- 5

Read the following scenario and answer the THREE questions that follow.
An examination had ten multiple choice questions; labelled Q1 to Q10 respectively. Each question had four answer options — A, B, C and D — of which one and only one was the correct answer. For each correct answer, the candidate obtained 1 mark. There were no negative marks for wrong answers. The answers chosen by six candidates named Om, Pavan, Qadir, Rakesh, Simranjeet and Tracey to each of the ten questions and the total marks obtained by each of them are shown in the table.

Question 31
What is the correct answer for Q5?
correct answer:- 4
Read the following scenario and answer the THREE questions that follow.
An examination had ten multiple choice questions; labelled Q1 to Q10 respectively. Each question had four answer options — A, B, C and D — of which one and only one was the correct answer. For each correct answer, the candidate obtained 1 mark. There were no negative marks for wrong answers. The answers chosen by six candidates named Om, Pavan, Qadir, Rakesh, Simranjeet and Tracey to each of the ten questions and the total marks obtained by each of them are shown in the table.
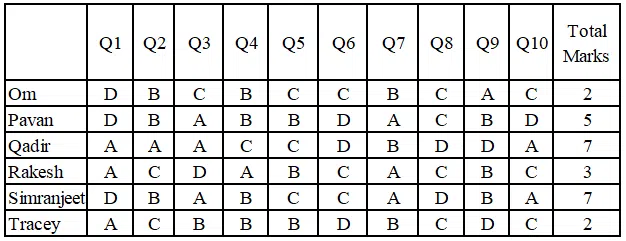
Question 32
For which of these questions is D the correct answer?
correct answer:- 3
Read the following scenario and answer the THREE questions that follow.
An examination had ten multiple choice questions; labelled Q1 to Q10 respectively. Each question had four answer options — A, B, C and D — of which one and only one was the correct answer. For each correct answer, the candidate obtained 1 mark. There were no negative marks for wrong answers. The answers chosen by six candidates named Om, Pavan, Qadir, Rakesh, Simranjeet and Tracey to each of the ten questions and the total marks obtained by each of them are shown in the table.

Question 33
Which of these questions witnessed the least number of the students answeringcorrectly?
correct answer:- 2
Four institutes, A, B, C, and D, had contracts with four vendors W, X, Y, and Z during the ten calendar years from 2010 to 2019. The contracts were either multi-year contracts running for several consecutive years or single-year contracts. No institute had more than one contract with the same vendor. However, in a calendar year, an institute may have had contracts with multiple vendors, and a vendor may have had contracts with multiple institutes. It is known that over the decade, the institutes each got into two contracts with two of these vendors, and each vendor got into two contracts with two of these institutes.
The following facts are also known about these contracts.
I. Vendor Z had at least one contract in every year.
II. Vendor X had one or more contracts in every year up to 2015, but no contract in any year after that.
III. Vendor Y had contracts in 2010 and 2019. Vendor W had contracts only in 2012.
IV. There were five contracts in 2012.
V. There were exactly four multi-year contracts. Institute B had a 7-year contract, D had a 4-year contract, and A and C had one 3-year contract each. The other four contracts were single-year contracts.
VI. Institute C had one or more contracts in 2012 but did not have any contract in 2011.
VII. Institutes B and D each had exactly one contract in 2012. Institute D did not have any contract in 2010.
Question 34
In which of the following years were there two or more contracts?
correct answer:- 3
Four institutes, A, B, C, and D, had contracts with four vendors W, X, Y, and Z during the ten calendar years from 2010 to 2019. The contracts were either multi-year contracts running for several consecutive years or single-year contracts. No institute had more than one contract with the same vendor. However, in a calendar year, an institute may have had contracts with multiple vendors, and a vendor may have had contracts with multiple institutes. It is known that over the decade, the institutes each got into two contracts with two of these vendors, and each vendor got into two contracts with two of these institutes.
The following facts are also known about these contracts.
I. Vendor Z had at least one contract in every year.
II. Vendor X had one or more contracts in every year up to 2015, but no contract in any year after that.
III. Vendor Y had contracts in 2010 and 2019. Vendor W had contracts only in 2012.
IV. There were five contracts in 2012.
V. There were exactly four multi-year contracts. Institute B had a 7-year contract, D had a 4-year contract, and A and C had one 3-year contract each. The other four contracts were single-year contracts.
VI. Institute C had one or more contracts in 2012 but did not have any contract in 2011.
VII. Institutes B and D each had exactly one contract in 2012. Institute D did not have any contract in 2010.
Question 35
Which of the following is true?
correct answer:- 4
Four institutes, A, B, C, and D, had contracts with four vendors W, X, Y, and Z during the ten calendar years from 2010 to 2019. The contracts were either multi-year contracts running for several consecutive years or single-year contracts. No institute had more than one contract with the same vendor. However, in a calendar year, an institute may have had contracts with multiple vendors, and a vendor may have had contracts with multiple institutes. It is known that over the decade, the institutes each got into two contracts with two of these vendors, and each vendor got into two contracts with two of these institutes.
The following facts are also known about these contracts.
I. Vendor Z had at least one contract in every year.
II. Vendor X had one or more contracts in every year up to 2015, but no contract in any year after that.
III. Vendor Y had contracts in 2010 and 2019. Vendor W had contracts only in 2012.
IV. There were five contracts in 2012.
V. There were exactly four multi-year contracts. Institute B had a 7-year contract, D had a 4-year contract, and A and C had one 3-year contract each. The other four contracts were single-year contracts.
VI. Institute C had one or more contracts in 2012 but did not have any contract in 2011.
VII. Institutes B and D each had exactly one contract in 2012. Institute D did not have any contract in 2010.
Question 36
In how many years during this period was there only one contract?
correct answer:- 1
Four institutes, A, B, C, and D, had contracts with four vendors W, X, Y, and Z during the ten calendar years from 2010 to 2019. The contracts were either multi-year contracts running for several consecutive years or single-year contracts. No institute had more than one contract with the same vendor. However, in a calendar year, an institute may have had contracts with multiple vendors, and a vendor may have had contracts with multiple institutes. It is known that over the decade, the institutes each got into two contracts with two of these vendors, and each vendor got into two contracts with two of these institutes.
The following facts are also known about these contracts.
I. Vendor Z had at least one contract in every year.
II. Vendor X had one or more contracts in every year up to 2015, but no contract in any year after that.
III. Vendor Y had contracts in 2010 and 2019. Vendor W had contracts only in 2012.
IV. There were five contracts in 2012.
V. There were exactly four multi-year contracts. Institute B had a 7-year contract, D had a 4-year contract, and A and C had one 3-year contract each. The other four contracts were single-year contracts.
VI. Institute C had one or more contracts in 2012 but did not have any contract in 2011.
VII. Institutes B and D each had exactly one contract in 2012. Institute D did not have any contract in 2010.
Question 37
What BEST can be concluded about the number of contracts in 2010?
correct answer:- 2
Four institutes, A, B, C, and D, had contracts with four vendors W, X, Y, and Z during the ten calendar years from 2010 to 2019. The contracts were either multi-year contracts running for several consecutive years or single-year contracts. No institute had more than one contract with the same vendor. However, in a calendar year, an institute may have had contracts with multiple vendors, and a vendor may have had contracts with multiple institutes. It is known that over the decade, the institutes each got into two contracts with two of these vendors, and each vendor got into two contracts with two of these institutes.
The following facts are also known about these contracts.
I. Vendor Z had at least one contract in every year.
II. Vendor X had one or more contracts in every year up to 2015, but no contract in any year after that.
III. Vendor Y had contracts in 2010 and 2019. Vendor W had contracts only in 2012.
IV. There were five contracts in 2012.
V. There were exactly four multi-year contracts. Institute B had a 7-year contract, D had a 4-year contract, and A and C had one 3-year contract each. The other four contracts were single-year contracts.
VI. Institute C had one or more contracts in 2012 but did not have any contract in 2011.
VII. Institutes B and D each had exactly one contract in 2012. Institute D did not have any contract in 2010.
Question 38
Which institutes had multiple contracts during the same year?
correct answer:- 3
Four institutes, A, B, C, and D, had contracts with four vendors W, X, Y, and Z during the ten calendar years from 2010 to 2019. The contracts were either multi-year contracts running for several consecutive years or single-year contracts. No institute had more than one contract with the same vendor. However, in a calendar year, an institute may have had contracts with multiple vendors, and a vendor may have had contracts with multiple institutes. It is known that over the decade, the institutes each got into two contracts with two of these vendors, and each vendor got into two contracts with two of these institutes.
The following facts are also known about these contracts.
I. Vendor Z had at least one contract in every year.
II. Vendor X had one or more contracts in every year up to 2015, but no contract in any year after that.
III. Vendor Y had contracts in 2010 and 2019. Vendor W had contracts only in 2012.
IV. There were five contracts in 2012.
V. There were exactly four multi-year contracts. Institute B had a 7-year contract, D had a 4-year contract, and A and C had one 3-year contract each. The other four contracts were single-year contracts.
VI. Institute C had one or more contracts in 2012 but did not have any contract in 2011.
VII. Institutes B and D each had exactly one contract in 2012. Institute D did not have any contract in 2010.
Question 39
Which institutes and vendors had more than one contracts in any year?
correct answer:- 2
Adriana, Bandita, Chitra, and Daisy are four female students, and Amit, Barun, Chetan, and Deb are four male students. Each of them studies in one of three institutes - X, Y, and Z. Each student majors in one subject among Marketing, Operations, and Finance, and minors in a different one among these three subjects. The following facts are known about the eight students:
1. Three students are from X, three are from Y, and the remaining two students, both female, are from Z.
2. Both the male students from Y minor in Finance, while the female student from Y majors in Operations.
3. Only one male student majors in Operations, while three female students minor in Marketing.
4. One female and two male students major in Finance.
5. Adriana and Deb are from the same institute. Daisy and Amit are from the same institute.
6. Barun is from Y and majors in Operations. Chetan is from X and majors in Finance.
7. Daisy minors in Operations.
Question 40
Who are the students from the institute Z?
correct answer:- 3

Adriana, Bandita, Chitra, and Daisy are four female students, and Amit, Barun, Chetan, and Deb are four male students. Each of them studies in one of three institutes - X, Y, and Z. Each student majors in one subject among Marketing, Operations, and Finance, and minors in a different one among these three subjects. The following facts are known about the eight students:
1. Three students are from X, three are from Y, and the remaining two students, both female, are from Z.
2. Both the male students from Y minor in Finance, while the female student from Y majors in Operations.
3. Only one male student majors in Operations, while three female students minor in Marketing.
4. One female and two male students major in Finance.
5. Adriana and Deb are from the same institute. Daisy and Amit are from the same institute.
6. Barun is from Y and majors in Operations. Chetan is from X and majors in Finance.
7. Daisy minors in Operations.
Question 41
Which subject does Deb minor in?
correct answer:- 2
Adriana, Bandita, Chitra, and Daisy are four female students, and Amit, Barun, Chetan, and Deb are four male students. Each of them studies in one of three institutes - X, Y, and Z. Each student majors in one subject among Marketing, Operations, and Finance, and minors in a different one among these three subjects. The following facts are known about the eight students:
1. Three students are from X, three are from Y, and the remaining two students, both female, are from Z.
2. Both the male students from Y minor in Finance, while the female student from Y majors in Operations.
3. Only one male student majors in Operations, while three female students minor in Marketing.
4. One female and two male students major in Finance.
5. Adriana and Deb are from the same institute. Daisy and Amit are from the same institute.
6. Barun is from Y and majors in Operations. Chetan is from X and majors in Finance.
7. Daisy minors in Operations.
Question 42
Which subject does Amit major in?
correct answer:- 4
Adriana, Bandita, Chitra, and Daisy are four female students, and Amit, Barun, Chetan, and Deb are four male students. Each of them studies in one of three institutes - X, Y, and Z. Each student majors in one subject among Marketing, Operations, and Finance, and minors in a different one among these three subjects. The following facts are known about the eight students:
1. Three students are from X, three are from Y, and the remaining two students, both female, are from Z.
2. Both the male students from Y minor in Finance, while the female student from Y majors in Operations.
3. Only one male student majors in Operations, while three female students minor in Marketing.
4. One female and two male students major in Finance.
5. Adriana and Deb are from the same institute. Daisy and Amit are from the same institute.
6. Barun is from Y and majors in Operations. Chetan is from X and majors in Finance.
7. Daisy minors in Operations.
Question 43
If Chitra majors in Finance, which subject does Bandita major in?
correct answer:- 3
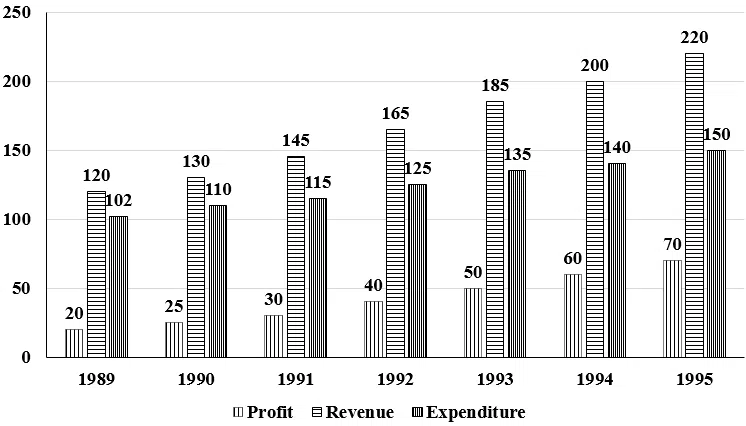
Answer the questions based on the following information.
Question 44
The average revenue collected in the given 7 years is approximately
correct answer:- 2
Answer the questions based on the following information.

Question 45
The expenditure for the 7 years together form what per cent of the revenues during the same period?
correct answer:- 1
Answer the questions based on the following information.

Question 46
Which year showed the greatest percentage increase in profit as compared to the previous year?
correct answer:- 4
Answer the questions based on the following information.

Question 47
In which year was the growth in expenditure maximum as compared to the previous year?
correct answer:- 4
Answer the questions based on the following information.

Question 48
If the profit in 1996 shows the annual rate of growth as it had shown in 1995 over the previous year, then what approximately will be the profit in 1996?
correct answer:- 2
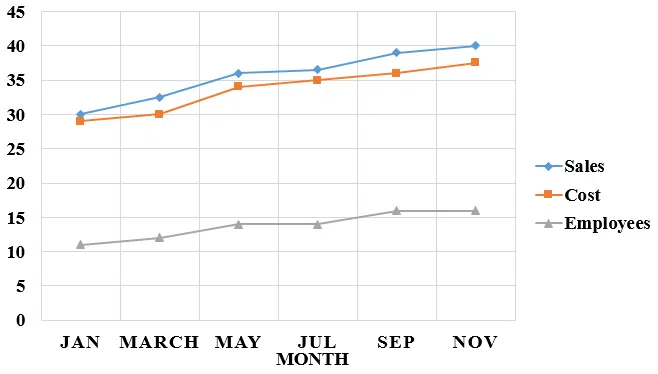
Answer the questions based on the following graph.

Employess in thousand Sales - cost = profit
(all values are integers)
Question 49
Which month records the highest profit percentage?
correct answer:- 2
Answer the questions based on the following graph.

Employess in thousand Sales - cost = profit
(all values are integers)
Question 50
In which month is the total increase in the cost highest as compared to two months ago?
correct answer:- 4

Answer the questions based on the following graph.

Employess in thousand Sales - cost = profit
(all values are integers)
Question 51
In which month is the percentage increase in sales two months before, the highest?
correct answer:- 4
Answer the questions based on the following graph.
Employess in thousand Sales - cost = profit
(all values are integers)
Question 52
Which month has the highest profit per employee?
correct answer:- 4
Answer the questions based on the following graph.

Employess in thousand Sales - cost = profit
(all values are integers)
Question 53
Assuming that no employees left the job, how many more people did the company take on in the given period?
correct answer:- 3
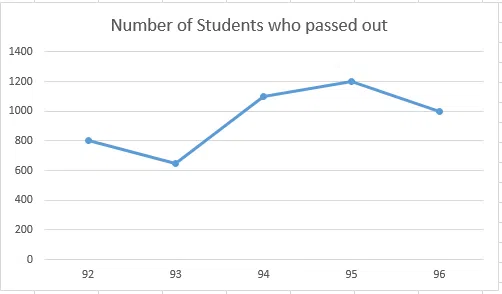
Answer the questions based on the following information. The first table gives the percentage of students in MBA class, who sought employment in the areas of finance, marketing and software. The second table gives the average starting salaries of the students per month, (rupees in thousands) in these areas. The third table gives the number of students who passed out in each year.
Table 1:

Table 2:

Table 3:

Question 54
The number of students who get jobs in finance is less than the students getting marketing jobs, in the 5 years, by
correct answer:- 3
Answer the questions based on the following information. The first table gives the percentage of students in MBA class, who sought employment in the areas of finance, marketing and software. The second table gives the average starting salaries of the students per month, (rupees in thousands) in these areas. The third table gives the number of students who passed out in each year.
Table 1:

Table 2:

Table 3:
Question 55
What is the percentage increase in the average salary of finance from 1992 to 1996?
correct answer:- 4
Answer the questions based on the following information. The first table gives the percentage of students in MBA class, who sought employment in the areas of finance, marketing and software. The second table gives the average starting salaries of the students per month, (rupees in thousands) in these areas. The third table gives the number of students who passed out in each year.
Table 1:

Table 2:

Table 3:

Question 56
The average annual rate at which the initial salary offered in software increases is
correct answer:- 3
Answer the questions based on the following information. The first table gives the percentage of students in MBA class, who sought employment in the areas of finance, marketing and software. The second table gives the average starting salaries of the students per month, (rupees in thousands) in these areas. The third table gives the number of students who passed out in each year.
Table 1:

Table 2:
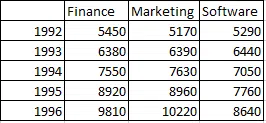
Table 3:

Question 57
What is the average monthly salary offered to a management graduate in 1993?
correct answer:- 4
Answer the questions based on the following information. The first table gives the percentage of students in MBA class, who sought employment in the areas of finance, marketing and software. The second table gives the average starting salaries of the students per month, (rupees in thousands) in these areas. The third table gives the number of students who passed out in each year.
Table 1:
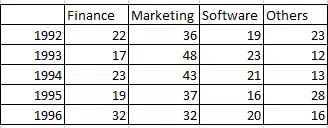
Table 2:

Table 3:

Question 58
In 1994, students seeking jobs in finance earned ___ more than those opting for software (per annum).
correct answer:- 2
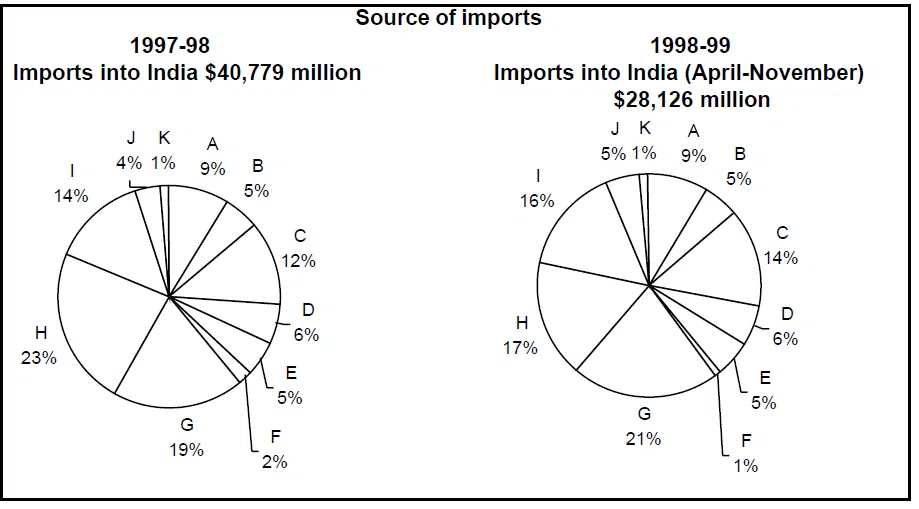
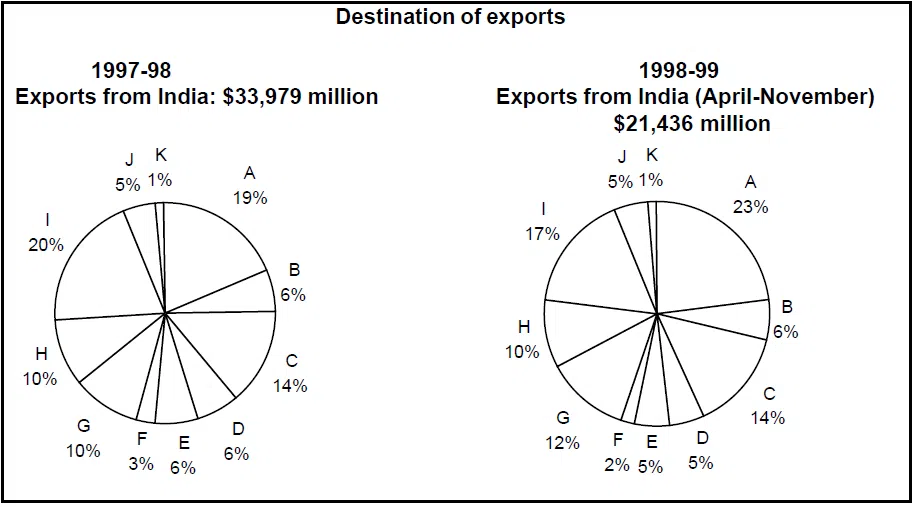
Consider the information provided in the figure below relating to India's foreign trade in 1997-98 and the first eight months of 1998-99.
Total trade with a region is defined as the sum of exports to and imports from that region.
Trade deficit is defined as the excess of imports over exports. Trade deficit may be negative.
A:USA. B:Germany C:Other EU. D:U.K. E:Japan F:Russia
G:Other East Europe H:OPEC I:Asia J:Other LDCs K:Others

Question 59
What is the region with which India had the highest total trade in 1997-98?
correct answer:- 3
Consider the information provided in the figure below relating to India's foreign trade in 1997-98 and the first eight months of 1998-99.
Total trade with a region is defined as the sum of exports to and imports from that region.
Trade deficit is defined as the excess of imports over exports. Trade deficit may be negative.
A:USA. B:Germany C:Other EU. D:U.K. E:Japan F:Russia
G:Other East Europe H:OPEC I:Asia J:Other LDCs K:Others


Question 60
In 1997-98 the amount of Indian exports, in millions US $, to the region with which India had the lowest total trade, is approximately
correct answer:- 2

Consider the information provided in the figure below relating to India's foreign trade in 1997-98 and the first eight months of 1998-99.
Total trade with a region is defined as the sum of exports to and imports from that region.
Trade deficit is defined as the excess of imports over exports. Trade deficit may be negative.
A:USA. B:Germany C:Other EU. D:U.K. E:Japan F:Russia
G:Other East Europe H:OPEC I:Asia J:Other LDCs K:Others

Question 61
In 1997-98, the trade deficit with respect to India, in billions of US $, for the region with the highest trade deficit with respect to India, is approximately equal to
correct answer:- 1
Consider the information provided in the figure below relating to India's foreign trade in 1997-98 and the first eight months of 1998-99.
Total trade with a region is defined as the sum of exports to and imports from that region.
Trade deficit is defined as the excess of imports over exports. Trade deficit may be negative.
A:USA. B:Germany C:Other EU. D:U.K. E:Japan F:Russia
G:Other East Europe H:OPEC I:Asia J:Other LDCs K:Others


Question 62
What is the region with the lowest trade deficit with India in 1997-98?
correct answer:- 1
Consider the information provided in the figure below relating to India's foreign trade in 1997-98 and the first eight months of 1998-99.
Total trade with a region is defined as the sum of exports to and imports from that region.
Trade deficit is defined as the excess of imports over exports. Trade deficit may be negative.
A:USA. B:Germany C:Other EU. D:U.K. E:Japan F:Russia
G:Other East Europe H:OPEC I:Asia J:Other LDCs K:Others


Question 63
Assume that the average monthly exports from India and imports to India during the remaining four months of 1998-99 would be the same as that for the first eight months of the year. What is the region to which India’s exports registered the highest percentage growth between1997-98 and 1998-99?
correct answer:- 2
Consider the information provided in the figure below relating to India's foreign trade in 1997-98 and the first eight months of 1998-99.
Total trade with a region is defined as the sum of exports to and imports from that region.
Trade deficit is defined as the excess of imports over exports. Trade deficit may be negative.
A:USA. B:Germany C:Other EU. D:U.K. E:Japan F:Russia
G:Other East Europe H:OPEC I:Asia J:Other LDCs K:Others


Question 64
Assume that the average monthly exports from India and imports to India during the remaining four months of 1998-99 would be the same as that for the first eight months of the year. What is the percentage growth rate in India’s total trade deficit between 1997-98 and 1998-99?
correct answer:- 2
Syndicate international is an Indian conglomerate which is having operations in many sectors. The first pie chart shows the percentage of revenues of each sector in the share of total revenues while the second pie-chart shows the percentage of profits from each sector in the share of total profits. Assume that every sector experienced a profit.

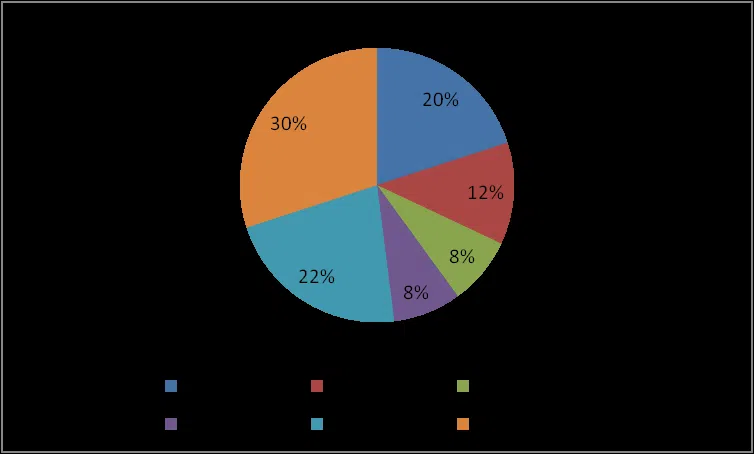
Operating Costs (OC) = Revenue - Profits
Profit % = (profit/OC) * 100
Question 65
If the profit percentage from E-Commerce sector is 50%, then find the profit %age from Steel sector?
correct answer:- 1
Syndicate international is an Indian conglomerate which is having operations in many sectors. The first pie chart shows the percentage of revenues of each sector in the share of total revenues while the second pie-chart shows the percentage of profits from each sector in the share of total profits. Assume that every sector experienced a profit.


Operating Costs (OC) = Revenue - Profits
Profit % = (profit/OC) * 100
Question 66
Which sector has the highest ratio of operating costs to revenues?
correct answer:- 1
Syndicate international is an Indian conglomerate which is having operations in many sectors. The first pie chart shows the percentage of revenues of each sector in the share of total revenues while the second pie-chart shows the percentage of profits from each sector in the share of total profits. Assume that every sector experienced a profit.
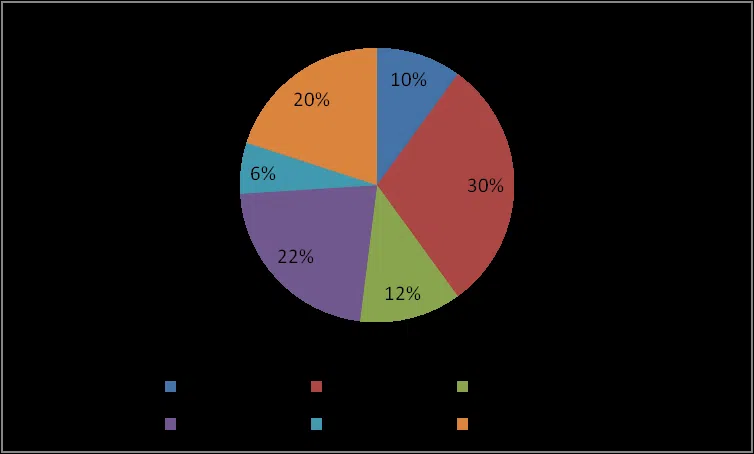

Operating Costs (OC) = Revenue - Profits
Profit % = (profit/OC) * 100
Question 67
If the total revenues is 250 crores, then which of the following values can be the profit of the company?
correct answer:- 3
Syndicate international is an Indian conglomerate which is having operations in many sectors. The first pie chart shows the percentage of revenues of each sector in the share of total revenues while the second pie-chart shows the percentage of profits from each sector in the share of total profits. Assume that every sector experienced a profit.


Operating Costs (OC) = Revenue - Profits
Profit % = (profit/OC) * 100
Question 68
If the revenues of E-Commerce sectors increase by 20%, while the revenues from remaining sector remains constant, what is the difference between the angles made on pie chart in two situations?
correct answer:- 1
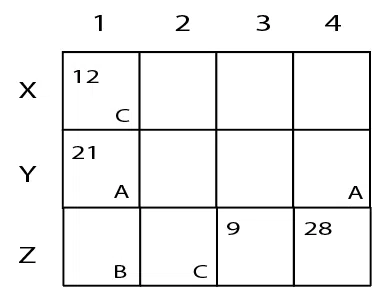
A farmer had a rectangular land containing 205 trees. He distributed that land among his four daughters - Abha, Bina, Chitra and Dipti by dividing the land into twelve plots along three rows (X,Y,Z) and four Columns (1,2,3,4) as shown in the figure below:

The plots in rows X, Y, Z contained mango, teak and pine trees respectively. Each plot had trees in non-zero multiples of 3 or 4 and none of the plots had the same number of trees. Each daughter got an even number of plots. In the figure, the number mentioned in top left corner of a plot is the number of trees in that plot, while the letter in the bottom right corner is the first letter of the name of the daughter who got that plot (For example, Abha got the plot in row Y and column 1 containing 21 trees). Some information in the figure got erased, but the following is known:
1. Abha got 20 trees more than Chitra but 6 trees less than Dipti.
2. The largest number of trees in a plot was 32, but it was not with Abha.
3. The number of teak trees in Column 3 was double of that in Column 2 but was half of that in Column 4.
4. Both Abha and Bina got a higher number of plots than Dipti.
5. Only Bina, Chitra and Dipti got corner plots.
6. Dipti got two adjoining plots in the same row.
7. Bina was the only one who got a plot in each row and each column.
8. Chitra and Dipti did not get plots which were adjacent to each other (either in row / column / diagonal).
9. The number of mango trees was double the number of teak trees.
Question 69
How many mango trees were there in total?
correct answer:- 3
A farmer had a rectangular land containing 205 trees. He distributed that land among his four daughters - Abha, Bina, Chitra and Dipti by dividing the land into twelve plots along three rows (X,Y,Z) and four Columns (1,2,3,4) as shown in the figure below:
The plots in rows X, Y, Z contained mango, teak and pine trees respectively. Each plot had trees in non-zero multiples of 3 or 4 and none of the plots had the same number of trees. Each daughter got an even number of plots. In the figure, the number mentioned in top left corner of a plot is the number of trees in that plot, while the letter in the bottom right corner is the first letter of the name of the daughter who got that plot (For example, Abha got the plot in row Y and column 1 containing 21 trees). Some information in the figure got erased, but the following is known:
1. Abha got 20 trees more than Chitra but 6 trees less than Dipti.
2. The largest number of trees in a plot was 32, but it was not with Abha.
3. The number of teak trees in Column 3 was double of that in Column 2 but was half of that in Column 4.
4. Both Abha and Bina got a higher number of plots than Dipti.
5. Only Bina, Chitra and Dipti got corner plots.
6. Dipti got two adjoining plots in the same row.
7. Bina was the only one who got a plot in each row and each column.
8. Chitra and Dipti did not get plots which were adjacent to each other (either in row / column / diagonal).
9. The number of mango trees was double the number of teak trees.
Question 70
Which of the following is the correct sequence of trees received by Abha, Bina, Chitra and Dipti in that order?
correct answer:- 1

A farmer had a rectangular land containing 205 trees. He distributed that land among his four daughters - Abha, Bina, Chitra and Dipti by dividing the land into twelve plots along three rows (X,Y,Z) and four Columns (1,2,3,4) as shown in the figure below:

The plots in rows X, Y, Z contained mango, teak and pine trees respectively. Each plot had trees in non-zero multiples of 3 or 4 and none of the plots had the same number of trees. Each daughter got an even number of plots. In the figure, the number mentioned in top left corner of a plot is the number of trees in that plot, while the letter in the bottom right corner is the first letter of the name of the daughter who got that plot (For example, Abha got the plot in row Y and column 1 containing 21 trees). Some information in the figure got erased, but the following is known:
1. Abha got 20 trees more than Chitra but 6 trees less than Dipti.
2. The largest number of trees in a plot was 32, but it was not with Abha.
3. The number of teak trees in Column 3 was double of that in Column 2 but was half of that in Column 4.
4. Both Abha and Bina got a higher number of plots than Dipti.
5. Only Bina, Chitra and Dipti got corner plots.
6. Dipti got two adjoining plots in the same row.
7. Bina was the only one who got a plot in each row and each column.
8. Chitra and Dipti did not get plots which were adjacent to each other (either in row / column / diagonal).
9. The number of mango trees was double the number of teak trees.
Question 71
How many pine trees did Chitra receive?
correct answer:- 1
A farmer had a rectangular land containing 205 trees. He distributed that land among his four daughters - Abha, Bina, Chitra and Dipti by dividing the land into twelve plots along three rows (X,Y,Z) and four Columns (1,2,3,4) as shown in the figure below:

The plots in rows X, Y, Z contained mango, teak and pine trees respectively. Each plot had trees in non-zero multiples of 3 or 4 and none of the plots had the same number of trees. Each daughter got an even number of plots. In the figure, the number mentioned in top left corner of a plot is the number of trees in that plot, while the letter in the bottom right corner is the first letter of the name of the daughter who got that plot (For example, Abha got the plot in row Y and column 1 containing 21 trees). Some information in the figure got erased, but the following is known:
1. Abha got 20 trees more than Chitra but 6 trees less than Dipti.
2. The largest number of trees in a plot was 32, but it was not with Abha.
3. The number of teak trees in Column 3 was double of that in Column 2 but was half of that in Column 4.
4. Both Abha and Bina got a higher number of plots than Dipti.
5. Only Bina, Chitra and Dipti got corner plots.
6. Dipti got two adjoining plots in the same row.
7. Bina was the only one who got a plot in each row and each column.
8. Chitra and Dipti did not get plots which were adjacent to each other (either in row / column / diagonal).
9. The number of mango trees was double the number of teak trees.
Question 72
Who got the plot with the smallest number of trees and how many trees did that plot have?
correct answer:- 2
A farmer had a rectangular land containing 205 trees. He distributed that land among his four daughters - Abha, Bina, Chitra and Dipti by dividing the land into twelve plots along three rows (X,Y,Z) and four Columns (1,2,3,4) as shown in the figure below:

The plots in rows X, Y, Z contained mango, teak and pine trees respectively. Each plot had trees in non-zero multiples of 3 or 4 and none of the plots had the same number of trees. Each daughter got an even number of plots. In the figure, the number mentioned in top left corner of a plot is the number of trees in that plot, while the letter in the bottom right corner is the first letter of the name of the daughter who got that plot (For example, Abha got the plot in row Y and column 1 containing 21 trees). Some information in the figure got erased, but the following is known:
1. Abha got 20 trees more than Chitra but 6 trees less than Dipti.
2. The largest number of trees in a plot was 32, but it was not with Abha.
3. The number of teak trees in Column 3 was double of that in Column 2 but was half of that in Column 4.
4. Both Abha and Bina got a higher number of plots than Dipti.
5. Only Bina, Chitra and Dipti got corner plots.
6. Dipti got two adjoining plots in the same row.
7. Bina was the only one who got a plot in each row and each column.
8. Chitra and Dipti did not get plots which were adjacent to each other (either in row / column / diagonal).
9. The number of mango trees was double the number of teak trees.
Question 73
Which of the following statements is NOT true?
correct answer:- 2
A farmer had a rectangular land containing 205 trees. He distributed that land among his four daughters - Abha, Bina, Chitra and Dipti by dividing the land into twelve plots along three rows (X,Y,Z) and four Columns (1,2,3,4) as shown in the figure below:

The plots in rows X, Y, Z contained mango, teak and pine trees respectively. Each plot had trees in non-zero multiples of 3 or 4 and none of the plots had the same number of trees. Each daughter got an even number of plots. In the figure, the number mentioned in top left corner of a plot is the number of trees in that plot, while the letter in the bottom right corner is the first letter of the name of the daughter who got that plot (For example, Abha got the plot in row Y and column 1 containing 21 trees). Some information in the figure got erased, but the following is known:
1. Abha got 20 trees more than Chitra but 6 trees less than Dipti.
2. The largest number of trees in a plot was 32, but it was not with Abha.
3. The number of teak trees in Column 3 was double of that in Column 2 but was half of that in Column 4.
4. Both Abha and Bina got a higher number of plots than Dipti.
5. Only Bina, Chitra and Dipti got corner plots.
6. Dipti got two adjoining plots in the same row.
7. Bina was the only one who got a plot in each row and each column.
8. Chitra and Dipti did not get plots which were adjacent to each other (either in row / column / diagonal).
9. The number of mango trees was double the number of teak trees.
Question 74
Which column had the highest number of trees?
correct answer:- 1
Every day a widget supplier supplies widgets from the warehouse (W) to four locations - Ahmednagar (A), Bikrampore (B), Chitrachak (C), and Deccan Park (D). The daily demand for widgets in each location is uncertain and independent of each other. Demands and corresponding probability values (in parenthesis) are given against each location (A, B, C, and D) in the figure below. For example, there is a 40% chance that the demand in Ahmednagar will be 50 units and a 60% chance that the demand will be 70 units. The lines in the figure connecting the locations and warehouse represent two-way roads connecting those places with the distances (in km) shown beside the line. The distances in both the directions along a road are equal. For example, the road from Ahmednagar to Bikrampore and the road from Bikrampore to Ahmednagar are both 6 km long.

Every day the supplier gets the information about the demand values of the four locations and creates the travel route that starts from the warehouse and ends at a location after visiting all the locations exactly once. While making the route plan, the supplier goes to the locations in decreasing order of demand. If there is a tie for the choice of the next location, the supplier will go to the location closest to the current location. Also, while creating the route, the supplier can either follow the direct path (if available) from one location to another or can take the path via the warehouse. If both paths are available (direct and via warehouse), the supplier will choose the path with minimum distance.
Question 75
If the last location visited is Ahmednagar, then what is the total distance covered in the route (in km)?
correct answer:- 35
Every day a widget supplier supplies widgets from the warehouse (W) to four locations - Ahmednagar (A), Bikrampore (B), Chitrachak (C), and Deccan Park (D). The daily demand for widgets in each location is uncertain and independent of each other. Demands and corresponding probability values (in parenthesis) are given against each location (A, B, C, and D) in the figure below. For example, there is a 40% chance that the demand in Ahmednagar will be 50 units and a 60% chance that the demand will be 70 units. The lines in the figure connecting the locations and warehouse represent two-way roads connecting those places with the distances (in km) shown beside the line. The distances in both the directions along a road are equal. For example, the road from Ahmednagar to Bikrampore and the road from Bikrampore to Ahmednagar are both 6 km long.

Every day the supplier gets the information about the demand values of the four locations and creates the travel route that starts from the warehouse and ends at a location after visiting all the locations exactly once. While making the route plan, the supplier goes to the locations in decreasing order of demand. If there is a tie for the choice of the next location, the supplier will go to the location closest to the current location. Also, while creating the route, the supplier can either follow the direct path (if available) from one location to another or can take the path via the warehouse. If both paths are available (direct and via warehouse), the supplier will choose the path with minimum distance.
Question 76
If the total number of widgets delivered in a day is 250 units, then what is the total distance covered in the route (in km)?
correct answer:- 38
Every day a widget supplier supplies widgets from the warehouse (W) to four locations - Ahmednagar (A), Bikrampore (B), Chitrachak (C), and Deccan Park (D). The daily demand for widgets in each location is uncertain and independent of each other. Demands and corresponding probability values (in parenthesis) are given against each location (A, B, C, and D) in the figure below. For example, there is a 40% chance that the demand in Ahmednagar will be 50 units and a 60% chance that the demand will be 70 units. The lines in the figure connecting the locations and warehouse represent two-way roads connecting those places with the distances (in km) shown beside the line. The distances in both the directions along a road are equal. For example, the road from Ahmednagar to Bikrampore and the road from Bikrampore to Ahmednagar are both 6 km long.

Every day the supplier gets the information about the demand values of the four locations and creates the travel route that starts from the warehouse and ends at a location after visiting all the locations exactly once. While making the route plan, the supplier goes to the locations in decreasing order of demand. If there is a tie for the choice of the next location, the supplier will go to the location closest to the current location. Also, while creating the route, the supplier can either follow the direct path (if available) from one location to another or can take the path via the warehouse. If both paths are available (direct and via warehouse), the supplier will choose the path with minimum distance.
Question 77
What is the chance that the total number of widgets delivered in a day is 260 units and the route ends at Bikrampore?
correct answer:- 4
Every day a widget supplier supplies widgets from the warehouse (W) to four locations - Ahmednagar (A), Bikrampore (B), Chitrachak (C), and Deccan Park (D). The daily demand for widgets in each location is uncertain and independent of each other. Demands and corresponding probability values (in parenthesis) are given against each location (A, B, C, and D) in the figure below. For example, there is a 40% chance that the demand in Ahmednagar will be 50 units and a 60% chance that the demand will be 70 units. The lines in the figure connecting the locations and warehouse represent two-way roads connecting those places with the distances (in km) shown beside the line. The distances in both the directions along a road are equal. For example, the road from Ahmednagar to Bikrampore and the road from Bikrampore to Ahmednagar are both 6 km long.

Every day the supplier gets the information about the demand values of the four locations and creates the travel route that starts from the warehouse and ends at a location after visiting all the locations exactly once. While making the route plan, the supplier goes to the locations in decreasing order of demand. If there is a tie for the choice of the next location, the supplier will go to the location closest to the current location. Also, while creating the route, the supplier can either follow the direct path (if available) from one location to another or can take the path via the warehouse. If both paths are available (direct and via warehouse), the supplier will choose the path with minimum distance.
Question 78
If the first location visited from the warehouse is Ahmednagar, then what is the chance that the total distance covered in the route is 40 km?
correct answer:- 1
Every day a widget supplier supplies widgets from the warehouse (W) to four locations - Ahmednagar (A), Bikrampore (B), Chitrachak (C), and Deccan Park (D). The daily demand for widgets in each location is uncertain and independent of each other. Demands and corresponding probability values (in parenthesis) are given against each location (A, B, C, and D) in the figure below. For example, there is a 40% chance that the demand in Ahmednagar will be 50 units and a 60% chance that the demand will be 70 units. The lines in the figure connecting the locations and warehouse represent two-way roads connecting those places with the distances (in km) shown beside the line. The distances in both the directions along a road are equal. For example, the road from Ahmednagar to Bikrampore and the road from Bikrampore to Ahmednagar are both 6 km long.
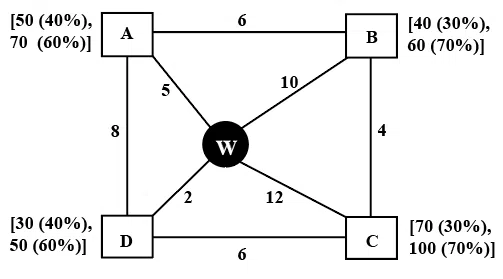
Every day the supplier gets the information about the demand values of the four locations and creates the travel route that starts from the warehouse and ends at a location after visiting all the locations exactly once. While making the route plan, the supplier goes to the locations in decreasing order of demand. If there is a tie for the choice of the next location, the supplier will go to the location closest to the current location. Also, while creating the route, the supplier can either follow the direct path (if available) from one location to another or can take the path via the warehouse. If both paths are available (direct and via warehouse), the supplier will choose the path with minimum distance.
Question 79
If Ahmednagar is not the first location to be visited in a route and the total route distance is 29 km, then which of the following is a possible number of widgets delivered on that day?
correct answer:- 1
An agency entrusted to accredit colleges looks at four parameters: faculty quality (F), reputation (R), placement quality (P), and infrastructure (I). The four parameters are used to arrive at an overall score, which the agency uses to give an accreditation to the colleges. In each parameter, there are five possible letter grades given, each carrying certain points: A (50 points), B (40 points), C (30 points), D (20 points), and F (0 points). The overall score for a college is the weighted sum of the points scored in the four parameters. The weights of the parameters are 0.1, 0.2, 0.3 and 0.4 in some order, but the order is not disclosed. Accreditation is awarded based on the following scheme:

Eight colleges apply for accreditation, and receive the following grades in the four parameters (F, R, P, and I):
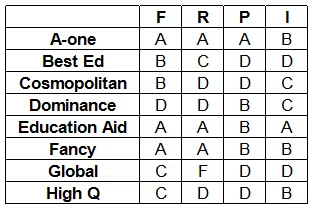
It is further known that in terms of overall scores:
1. High Q is better than Best Ed;
2. Best Ed is better than Cosmopolitan; and
3. Education Aid is better than A-one.
Question 80
What is the weight of the faculty quality parameter?
correct answer:- 4

An agency entrusted to accredit colleges looks at four parameters: faculty quality (F), reputation (R), placement quality (P), and infrastructure (I). The four parameters are used to arrive at an overall score, which the agency uses to give an accreditation to the colleges. In each parameter, there are five possible letter grades given, each carrying certain points: A (50 points), B (40 points), C (30 points), D (20 points), and F (0 points). The overall score for a college is the weighted sum of the points scored in the four parameters. The weights of the parameters are 0.1, 0.2, 0.3 and 0.4 in some order, but the order is not disclosed. Accreditation is awarded based on the following scheme:

Eight colleges apply for accreditation, and receive the following grades in the four parameters (F, R, P, and I):

It is further known that in terms of overall scores:
1. High Q is better than Best Ed;
2. Best Ed is better than Cosmopolitan; and
3. Education Aid is better than A-one.
Question 81
How many colleges receive the accreditation of AAA?
correct answer:- 3
Instruction for set :
An agency entrusted to accredit colleges looks at four parameters: faculty quality (F), reputation (R), placement quality (P), and infrastructure (I). The four parameters are used to arrive at an overall score, which the agency uses to give an accreditation to the colleges. In each parameter, there are five possible letter grades given, each carrying certain points: A (50 points), B (40 points), C (30 points), D (20 points), and F (0 points). The overall score for a college is the weighted sum of the points scored in the four parameters. The weights of the parameters are 0.1, 0.2, 0.3 and 0.4 in some order, but the order is not disclosed. Accreditation is awarded based on the following scheme:
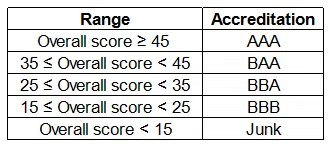
Eight colleges apply for accreditation, and receive the following grades in the four parameters (F, R, P, and I):

It is further known that in terms of overall scores:
1. High Q is better than Best Ed;
2. Best Ed is better than Cosmopolitan; and
3. Education Aid is better than A-one.
Question 82
What is the highest overall score among the eight colleges ?
correct answer:- 48
Instruction for set :
An agency entrusted to accredit colleges looks at four parameters: faculty quality (F), reputation (R), placement quality (P), and infrastructure (I). The four parameters are used to arrive at an overall score, which the agency uses to give an accreditation to the colleges. In each parameter, there are five possible letter grades given, each carrying certain points: A (50 points), B (40 points), C (30 points), D (20 points), and F (0 points). The overall score for a college is the weighted sum of the points scored in the four parameters. The weights of the parameters are 0.1, 0.2, 0.3 and 0.4 in some order, but the order is not disclosed. Accreditation is awarded based on the following scheme:

Eight colleges apply for accreditation, and receive the following grades in the four parameters (F, R, P, and I):

It is further known that in terms of overall scores:
1. High Q is better than Best Ed;
2. Best Ed is better than Cosmopolitan; and
3. Education Aid is better than A-one.
Question 83
How many colleges have overall scores between 31 and 40, both inclusive?
correct answer:- 1
Instruction for set :
Six players - Tanzi, Umeza, Wangdu, Xyla, Yonita and Zeneca competed in an archery tournament. The tournament had three compulsory rounds, Rounds 1 to 3. In each round every player shot an arrow at a target. Hitting the centre of the target (called bull’s eye) fetched the highest score of 5. The only other possible scores that a player could achieve were 4, 3, 2 and 1. Every bull’s eye score in the first three rounds gave a player one additional chance to shoot in the bonus rounds, Rounds 4 to 6. The possible scores in Rounds 4 to 6 were identical to the first three.
A player’s total score in the tournament was the sum of his/her scores in all rounds played by him/her. The table below presents partial information on points scored by the players after completion of the tournament. In the table, NP means that the player did not participate in that round, while a hyphen means that the player participated in that round and the score information is missing.

The following facts are also known.
1.Tanzi, Umeza and Yonita had the same total score.
2.Total scores for all players, except one, were in multiples of three.
3.The highest total score was one more than double of the lowest total score.
4.The number of players hitting bull’s eye in Round 2 was double of that in Round 3.
5.Tanzi and Zeneca had the same score in Round 1 but different scores in Round 3.
Question 84
What was the highest total score?
correct answer:- 1
Instruction for set :
Six players - Tanzi, Umeza, Wangdu, Xyla, Yonita and Zeneca competed in an archery tournament. The tournament had three compulsory rounds, Rounds 1 to 3. In each round every player shot an arrow at a target. Hitting the centre of the target (called bull’s eye) fetched the highest score of 5. The only other possible scores that a player could achieve were 4, 3, 2 and 1. Every bull’s eye score in the first three rounds gave a player one additional chance to shoot in the bonus rounds, Rounds 4 to 6. The possible scores in Rounds 4 to 6 were identical to the first three.
A player’s total score in the tournament was the sum of his/her scores in all rounds played by him/her. The table below presents partial information on points scored by the players after completion of the tournament. In the table, NP means that the player did not participate in that round, while a hyphen means that the player participated in that round and the score information is missing.

The following facts are also known.
1.Tanzi, Umeza and Yonita had the same total score.
2.Total scores for all players, except one, were in multiples of three.
3.The highest total score was one more than double of the lowest total score.
4.The number of players hitting bull’s eye in Round 2 was double of that in Round 3.
5.Tanzi and Zeneca had the same score in Round 1 but different scores in Round 3.
Question 85
What was Zeneca's total score?
correct answer:- 4
Instruction for set :
Six players - Tanzi, Umeza, Wangdu, Xyla, Yonita and Zeneca competed in an archery tournament. The tournament had three compulsory rounds, Rounds 1 to 3. In each round every player shot an arrow at a target. Hitting the centre of the target (called bull’s eye) fetched the highest score of 5. The only other possible scores that a player could achieve were 4, 3, 2 and 1. Every bull’s eye score in the first three rounds gave a player one additional chance to shoot in the bonus rounds, Rounds 4 to 6. The possible scores in Rounds 4 to 6 were identical to the first three.
A player’s total score in the tournament was the sum of his/her scores in all rounds played by him/her. The table below presents partial information on points scored by the players after completion of the tournament. In the table, NP means that the player did not participate in that round, while a hyphen means that the player participated in that round and the score information is missing.
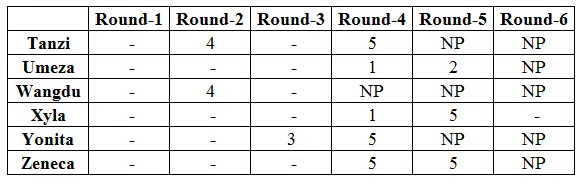
The following facts are also known.
1.Tanzi, Umeza and Yonita had the same total score.
2.Total scores for all players, except one, were in multiples of three.
3.The highest total score was one more than double of the lowest total score.
4.The number of players hitting bull’s eye in Round 2 was double of that in Round 3.
5.Tanzi and Zeneca had the same score in Round 1 but different scores in Round 3.
Question 86
Which of the following statements is true?
correct answer:- 4
Instruction for set :
Six players - Tanzi, Umeza, Wangdu, Xyla, Yonita and Zeneca competed in an archery tournament. The tournament had three compulsory rounds, Rounds 1 to 3. In each round every player shot an arrow at a target. Hitting the centre of the target (called bull’s eye) fetched the highest score of 5. The only other possible scores that a player could achieve were 4, 3, 2 and 1. Every bull’s eye score in the first three rounds gave a player one additional chance to shoot in the bonus rounds, Rounds 4 to 6. The possible scores in Rounds 4 to 6 were identical to the first three.
A player’s total score in the tournament was the sum of his/her scores in all rounds played by him/her. The table below presents partial information on points scored by the players after completion of the tournament. In the table, NP means that the player did not participate in that round, while a hyphen means that the player participated in that round and the score information is missing.

The following facts are also known.
1.Tanzi, Umeza and Yonita had the same total score.
2.Total scores for all players, except one, were in multiples of three.
3.The highest total score was one more than double of the lowest total score.
4.The number of players hitting bull’s eye in Round 2 was double of that in Round 3.
5.Tanzi and Zeneca had the same score in Round 1 but different scores in Round 3.
Question 87
What was Tanzi's score in Round 3?
correct answer:- 4
Instruction for set :
All the first-year students in the computer science (CS) department in a university take both the courses (i) AI and (ii) ML. Students from other departments (non-CS students) can also take one of these two courses, but not both. Students who fail in a course get an F grade;others pass and are awarded A or B or C grades depending on their performance. The following are some additional facts about the number of students who took these two courses this year and the grades they obtained.
1.The numbers of non-CS students who took AI and ML were in the ratio 2 : 5.
2.The number of non-CS students who took either AI or ML was equal to the number of CS students.
3.The numbers of non-CS students who failed in the two courses were the same and their total is equal to the number of CS students who got a C grade in ML.
4. In both the courses, 50% of the students who passed got a B grade. But, while the numbers of students who got A and C grades were the same for AI, they were in the ratio 3 :2 for ML.
5. No CS student failed in AI, while no non-CS student got an A grade in AI.
6.The numbers of CS students who got A, B and C grades respectively in AI were in the ratio 3 : 5 : 2, while in ML the ratio was 4 : 5 : 2.
7.The ratio of the total number of non-CS students failing in one of the two courses to the number of CS students failing in one of the two courses was 3 : 1.
8. 30 students failed in ML.
Question 88
How many students took AI?
correct answer:- 4
Instruction for set :
All the first-year students in the computer science (CS) department in a university take both the courses (i) AI and (ii) ML. Students from other departments (non-CS students) can also take one of these two courses, but not both. Students who fail in a course get an F grade;others pass and are awarded A or B or C grades depending on their performance. The following are some additional facts about the number of students who took these two courses this year and the grades they obtained.
1.The numbers of non-CS students who took AI and ML were in the ratio 2 : 5.
2.The number of non-CS students who took either AI or ML was equal to the number of CS students.
3.The numbers of non-CS students who failed in the two courses were the same and their total is equal to the number of CS students who got a C grade in ML.
4. In both the courses, 50% of the students who passed got a B grade. But, while the numbers of students who got A and C grades were the same for AI, they were in the ratio 3 :2 for ML.
5. No CS student failed in AI, while no non-CS student got an A grade in AI.
6.The numbers of CS students who got A, B and C grades respectively in AI were in the ratio 3 : 5 : 2, while in ML the ratio was 4 : 5 : 2.
7.The ratio of the total number of non-CS students failing in one of the two courses to the number of CS students failing in one of the two courses was 3 : 1.
8. 30 students failed in ML.
Question 89
How many CS students failed in ML?
correct answer:- 12
Instruction for set :
All the first-year students in the computer science (CS) department in a university take both the courses (i) AI and (ii) ML. Students from other departments (non-CS students) can also take one of these two courses, but not both. Students who fail in a course get an F grade;others pass and are awarded A or B or C grades depending on their performance. The following are some additional facts about the number of students who took these two courses this year and the grades they obtained.
1.The numbers of non-CS students who took AI and ML were in the ratio 2 : 5.
2.The number of non-CS students who took either AI or ML was equal to the number of CS students.
3.The numbers of non-CS students who failed in the two courses were the same and their total is equal to the number of CS students who got a C grade in ML.
4. In both the courses, 50% of the students who passed got a B grade. But, while the numbers of students who got A and C grades were the same for AI, they were in the ratio 3 :2 for ML.
5. No CS student failed in AI, while no non-CS student got an A grade in AI.
6.The numbers of CS students who got A, B and C grades respectively in AI were in the ratio 3 : 5 : 2, while in ML the ratio was 4 : 5 : 2.
7.The ratio of the total number of non-CS students failing in one of the two courses to the number of CS students failing in one of the two courses was 3 : 1.
8. 30 students failed in ML.
Question 90
How many non-CS students got A grade in ML?
correct answer:- 27

Instruction for set :
All the first-year students in the computer science (CS) department in a university take both the courses (i) AI and (ii) ML. Students from other departments (non-CS students) can also take one of these two courses, but not both. Students who fail in a course get an F grade;others pass and are awarded A or B or C grades depending on their performance. The following are some additional facts about the number of students who took these two courses this year and the grades they obtained.
1.The numbers of non-CS students who took AI and ML were in the ratio 2 : 5.
2.The number of non-CS students who took either AI or ML was equal to the number of CS students.
3.The numbers of non-CS students who failed in the two courses were the same and their total is equal to the number of CS students who got a C grade in ML.
4. In both the courses, 50% of the students who passed got a B grade. But, while the numbers of students who got A and C grades were the same for AI, they were in the ratio 3 :2 for ML.
5. No CS student failed in AI, while no non-CS student got an A grade in AI.
6.The numbers of CS students who got A, B and C grades respectively in AI were in the ratio 3 : 5 : 2, while in ML the ratio was 4 : 5 : 2.
7.The ratio of the total number of non-CS students failing in one of the two courses to the number of CS students failing in one of the two courses was 3 : 1.
8. 30 students failed in ML.
Question 91
How many students got A grade in AI?
correct answer:- 4
Instruction for set :
All the first-year students in the computer science (CS) department in a university take both the courses (i) AI and (ii) ML. Students from other departments (non-CS students) can also take one of these two courses, but not both. Students who fail in a course get an F grade;others pass and are awarded A or B or C grades depending on their performance. The following are some additional facts about the number of students who took these two courses this year and the grades they obtained.
1.The numbers of non-CS students who took AI and ML were in the ratio 2 : 5.
2.The number of non-CS students who took either AI or ML was equal to the number of CS students.
3.The numbers of non-CS students who failed in the two courses were the same and their total is equal to the number of CS students who got a C grade in ML.
4. In both the courses, 50% of the students who passed got a B grade. But, while the numbers of students who got A and C grades were the same for AI, they were in the ratio 3 :2 for ML.
5. No CS student failed in AI, while no non-CS student got an A grade in AI.
6.The numbers of CS students who got A, B and C grades respectively in AI were in the ratio 3 : 5 : 2, while in ML the ratio was 4 : 5 : 2.
7.The ratio of the total number of non-CS students failing in one of the two courses to the number of CS students failing in one of the two courses was 3 : 1.
8. 30 students failed in ML.
Question 92
How many non-CS students got B grade in ML?
correct answer:- 2
Instruction for set :
There are nine boxes arranged in a 3×3 array as shown in Tables 1 and 2. Each box contains three sacks. Each sack has a certain number of coins, between 1 and 9, both inclusive.
The average number of coins per sack in the boxes are all distinct integers. The total number of coins in each row is the same. The total number of coins in each column is also the same.
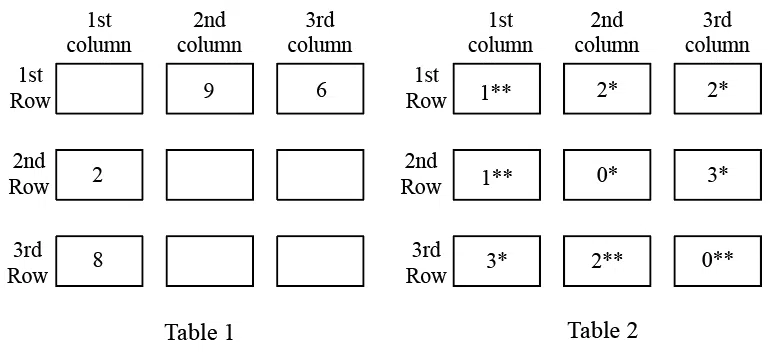
Table 1 gives information regarding the median of the numbers of coins in the three sacks in a box for some of the boxes. In Table 2 each box has a number which represents the number of sacks in that box having more than 5 coins. That number is followed by a * if the sacks in that box satisfy exactly one among the following three conditions, and it is followed by ** if two or more of these conditions are satisfied.
i) The minimum among the numbers of coins in the three sacks in the box is 1.
ii) The median of the numbers of coins in the three sacks is 1.
iii) The maximum among the numbers of coins in the three sacks in the box is 9.
Question 93
What is the total number of coins in all the boxes in the $$3^{rd}$$ row?
correct answer:- 4
Instruction for set :
There are nine boxes arranged in a 3×3 array as shown in Tables 1 and 2. Each box contains three sacks. Each sack has a certain number of coins, between 1 and 9, both inclusive.
The average number of coins per sack in the boxes are all distinct integers. The total number of coins in each row is the same. The total number of coins in each column is also the same.

Table 1 gives information regarding the median of the numbers of coins in the three sacks in a box for some of the boxes. In Table 2 each box has a number which represents the number of sacks in that box having more than 5 coins. That number is followed by a * if the sacks in that box satisfy exactly one among the following three conditions, and it is followed by ** if two or more of these conditions are satisfied.
i) The minimum among the numbers of coins in the three sacks in the box is 1.
ii) The median of the numbers of coins in the three sacks is 1.
iii) The maximum among the numbers of coins in the three sacks in the box is 9.
Question 94
How many boxes have at least one sack containing 9 coins?
correct answer:- 3
Instruction for set :
There are nine boxes arranged in a 3×3 array as shown in Tables 1 and 2. Each box contains three sacks. Each sack has a certain number of coins, between 1 and 9, both inclusive.
The average number of coins per sack in the boxes are all distinct integers. The total number of coins in each row is the same. The total number of coins in each column is also the same.

Table 1 gives information regarding the median of the numbers of coins in the three sacks in a box for some of the boxes. In Table 2 each box has a number which represents the number of sacks in that box having more than 5 coins. That number is followed by a * if the sacks in that box satisfy exactly one among the following three conditions, and it is followed by ** if two or more of these conditions are satisfied.
i) The minimum among the numbers of coins in the three sacks in the box is 1.
ii) The median of the numbers of coins in the three sacks is 1.
iii) The maximum among the numbers of coins in the three sacks in the box is 9.
Question 95
For how many boxes are the average and median of the numbers of coins contained in the three sacks in that box the same?
correct answer:- 4
Instruction for set :
There are nine boxes arranged in a 3×3 array as shown in Tables 1 and 2. Each box contains three sacks. Each sack has a certain number of coins, between 1 and 9, both inclusive.
The average number of coins per sack in the boxes are all distinct integers. The total number of coins in each row is the same. The total number of coins in each column is also the same.

Table 1 gives information regarding the median of the numbers of coins in the three sacks in a box for some of the boxes. In Table 2 each box has a number which represents the number of sacks in that box having more than 5 coins. That number is followed by a * if the sacks in that box satisfy exactly one among the following three conditions, and it is followed by ** if two or more of these conditions are satisfied.
i) The minimum among the numbers of coins in the three sacks in the box is 1.
ii) The median of the numbers of coins in the three sacks is 1.
iii) The maximum among the numbers of coins in the three sacks in the box is 9.
Question 96
How many sacks have exactly one coin?
correct answer:- 9
Instruction for set :
There are nine boxes arranged in a 3×3 array as shown in Tables 1 and 2. Each box contains three sacks. Each sack has a certain number of coins, between 1 and 9, both inclusive.
The average number of coins per sack in the boxes are all distinct integers. The total number of coins in each row is the same. The total number of coins in each column is also the same.

Table 1 gives information regarding the median of the numbers of coins in the three sacks in a box for some of the boxes. In Table 2 each box has a number which represents the number of sacks in that box having more than 5 coins. That number is followed by a * if the sacks in that box satisfy exactly one among the following three conditions, and it is followed by ** if two or more of these conditions are satisfied.
i) The minimum among the numbers of coins in the three sacks in the box is 1.
ii) The median of the numbers of coins in the three sacks is 1.
iii) The maximum among the numbers of coins in the three sacks in the box is 9.
Question 97
In how many boxes do all three sacks contain different numbers of coins?
correct answer:- 5
Instruction for set :
Three participants - Akhil, Bimal and Chatur participate in a random draw competition for five days. Every day, each participant randomly picks up a ball numbered between 1 and 9. The number on the ball determines his score on that day. The total score of a participant is the sum of his scores attained in the five days. The total score of a day is the sum of participants’ scores on that day. The 2-day average on a day, except on Day 1, is the average of the total scores of that day and of the previous day. For example, if the total scores of Day 1 and Day 2 are 25 and 20, then the 2-day average on Day 2 is calculated as 22.5. Table 1 gives the 2-day averages for Days 2 through 5.

Participants are ranked each day, with the person having the maximum score being awarded the minimum rank (1) on that day. If there is a tie, all participants with the tied score are awarded the best available rank. For example, if on a day Akhil, Bimal, and Chatur score 8, 7 and 7 respectively, then their ranks will be 1, 2 and 2 respectively on that day. These ranks are given in Table 2.

The following information is also known.
1. Chatur always scores in multiples of 3. His score on Day 2 is the unique highest score in the competition. His minimum score is observed only on Day 1, and it matches Akhil’s score on Day 4.
2. The total score on Day 3 is the same as the total score on Day 4.
3. Bimal’s scores are the same on Day 1 and Day 3.
Question 98
What is Akhil's score on Day 1?
correct answer:- 2
Instruction for set :
Three participants - Akhil, Bimal and Chatur participate in a random draw competition for five days. Every day, each participant randomly picks up a ball numbered between 1 and 9. The number on the ball determines his score on that day. The total score of a participant is the sum of his scores attained in the five days. The total score of a day is the sum of participants’ scores on that day. The 2-day average on a day, except on Day 1, is the average of the total scores of that day and of the previous day. For example, if the total scores of Day 1 and Day 2 are 25 and 20, then the 2-day average on Day 2 is calculated as 22.5. Table 1 gives the 2-day averages for Days 2 through 5.

Participants are ranked each day, with the person having the maximum score being awarded the minimum rank (1) on that day. If there is a tie, all participants with the tied score are awarded the best available rank. For example, if on a day Akhil, Bimal, and Chatur score 8, 7 and 7 respectively, then their ranks will be 1, 2 and 2 respectively on that day. These ranks are given in Table 2.

The following information is also known.
1. Chatur always scores in multiples of 3. His score on Day 2 is the unique highest score in the competition. His minimum score is observed only on Day 1, and it matches Akhil’s score on Day 4.
2. The total score on Day 3 is the same as the total score on Day 4.
3. Bimal’s scores are the same on Day 1 and Day 3.
Question 99
Who attains the maximum total score?
correct answer:- 4
Instruction for set :
Three participants - Akhil, Bimal and Chatur participate in a random draw competition for five days. Every day, each participant randomly picks up a ball numbered between 1 and 9. The number on the ball determines his score on that day. The total score of a participant is the sum of his scores attained in the five days. The total score of a day is the sum of participants’ scores on that day. The 2-day average on a day, except on Day 1, is the average of the total scores of that day and of the previous day. For example, if the total scores of Day 1 and Day 2 are 25 and 20, then the 2-day average on Day 2 is calculated as 22.5. Table 1 gives the 2-day averages for Days 2 through 5.
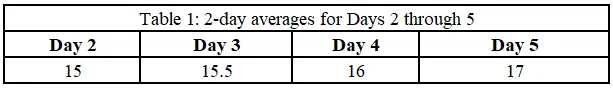
Participants are ranked each day, with the person having the maximum score being awarded the minimum rank (1) on that day. If there is a tie, all participants with the tied score are awarded the best available rank. For example, if on a day Akhil, Bimal, and Chatur score 8, 7 and 7 respectively, then their ranks will be 1, 2 and 2 respectively on that day. These ranks are given in Table 2.

The following information is also known.
1. Chatur always scores in multiples of 3. His score on Day 2 is the unique highest score in the competition. His minimum score is observed only on Day 1, and it matches Akhil’s score on Day 4.
2. The total score on Day 3 is the same as the total score on Day 4.
3. Bimal’s scores are the same on Day 1 and Day 3.
Question 100
What is the minimum possible total score of Bimal?
correct answer:- 25

Instruction for set :
Three participants - Akhil, Bimal and Chatur participate in a random draw competition for five days. Every day, each participant randomly picks up a ball numbered between 1 and 9. The number on the ball determines his score on that day. The total score of a participant is the sum of his scores attained in the five days. The total score of a day is the sum of participants’ scores on that day. The 2-day average on a day, except on Day 1, is the average of the total scores of that day and of the previous day. For example, if the total scores of Day 1 and Day 2 are 25 and 20, then the 2-day average on Day 2 is calculated as 22.5. Table 1 gives the 2-day averages for Days 2 through 5.

Participants are ranked each day, with the person having the maximum score being awarded the minimum rank (1) on that day. If there is a tie, all participants with the tied score are awarded the best available rank. For example, if on a day Akhil, Bimal, and Chatur score 8, 7 and 7 respectively, then their ranks will be 1, 2 and 2 respectively on that day. These ranks are given in Table 2.
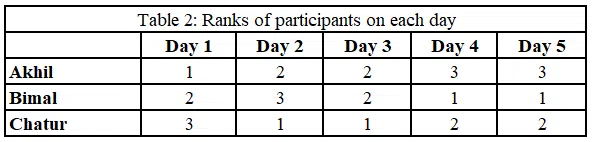
The following information is also known.
1. Chatur always scores in multiples of 3. His score on Day 2 is the unique highest score in the competition. His minimum score is observed only on Day 1, and it matches Akhil’s score on Day 4.
2. The total score on Day 3 is the same as the total score on Day 4.
3. Bimal’s scores are the same on Day 1 and Day 3.
Question 101
If the total score of Bimal is a multiple of 3, what is the score of Akhil on Day 2?
correct answer:- 4
Instruction for set :
Three participants - Akhil, Bimal and Chatur participate in a random draw competition for five days. Every day, each participant randomly picks up a ball numbered between 1 and 9. The number on the ball determines his score on that day. The total score of a participant is the sum of his scores attained in the five days. The total score of a day is the sum of participants’ scores on that day. The 2-day average on a day, except on Day 1, is the average of the total scores of that day and of the previous day. For example, if the total scores of Day 1 and Day 2 are 25 and 20, then the 2-day average on Day 2 is calculated as 22.5. Table 1 gives the 2-day averages for Days 2 through 5.

Participants are ranked each day, with the person having the maximum score being awarded the minimum rank (1) on that day. If there is a tie, all participants with the tied score are awarded the best available rank. For example, if on a day Akhil, Bimal, and Chatur score 8, 7 and 7 respectively, then their ranks will be 1, 2 and 2 respectively on that day. These ranks are given in Table 2.

The following information is also known.
1. Chatur always scores in multiples of 3. His score on Day 2 is the unique highest score in the competition. His minimum score is observed only on Day 1, and it matches Akhil’s score on Day 4.
2. The total score on Day 3 is the same as the total score on Day 4.
3. Bimal’s scores are the same on Day 1 and Day 3.
Question 102
If Akhil attains a total score of 24, then what is the total score of Bimal?
correct answer:- 26


")


")


