Three children won prizes in the ‘Tech India Quiz’ contest. They are from three schools: Lancer,
Columbus and Leelavati, which are located in different states. One of the children is named Binod. Lancer school’s contestant did not come first. Leelavati school’s contestant’s name is Rahman. Columbus school is not located in Andhra Pradesh. The contestant from Maharashtra got third place and is not from Leelavati School. The contestant from Karnataka did not secure first position. Columbus school’s contestant’s name is not Badal. Which of the following statements is TRUE?
IIFT 2008 Question Paper
For the following questions answer them individually
Solution
Rahman is from Leelavati. Since Badal is not from Columbus, he is from Lancer. Thus, Binod is from Columbus.
Since schools from Maharastra(Rank 3) and Karnataka did not secure the first position, schools from Andhra Pradesh secured the first rank.
Lancer did not come first, and Columbus was not from Andhra Pradesh. Thus, Leelavati school secure the first rank.
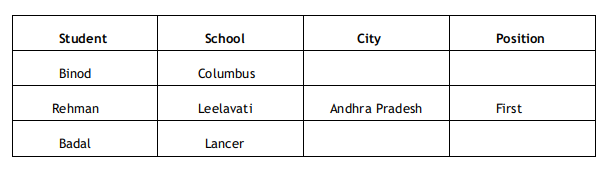
Thus, the only possible correct answer from the options is A.
Mother Dairy sells milk packets in boxes of different sizes to its vendors. The vendors are charged Rs. 20 per packet up to 2000 packets in a box. Additions can be made only in a lot size of 200 packets. Each addition of one lot to the box results in a discount of one rupee an all the packets in the box. What should be the maximum size of the box that would maximize the revenue per box for Mother Dairy?
Solution
We are given that, The vendors are charged Rs. 20 per packet up to 2000 packets in a box. Additions can be made only in a lot size of 200 packets. Each addition of one lot to the box results in a discount of one rupee an all the packets in the box.
Let x be number of additional lots.
Thus,
$$(20-x)(2000+200x) = 40000 - 2000x + 4000x -200x^2$$
=> $$-200x^2+2000x+40000$$
We need to maximize this
The minimum/maximum value of a quadratic equation is when $$x = -b/2a$$
Thus, the maximum value = $$-2000/400 = 5$$
Thus, the maximum size of the box that would maximize the revenue per box for Mother Dairy = 2000+200*5 = 3000
All employees have to pass through three consecutive entrance doors to enter into the office and one security guard is deployed at each door. These security guards report to the manager about those who come to office after 10 AM. Ms. Rani is an employee of this office and came late on the annual day. In order to avoid report to the manager she had to pay each security guard half of the money she had in her purse and 2 rupees more besides. She found only one rupee with her at the end. How much money Ms. Rani had before entering the office on the annual day?
Solution
Rani has 1 Rs with her.
Before meeting the third guard she must be having (1+2)*2 = 6 rs.
Before meeting the second guard she must be having (6+2)*2 = 16
Before meeting the first guard she must be having (16+2)*2 = 36
Thus, Ms. Rani had 36 Rs before entering the office on the annual day
Answer the questions based on the following information. Director of an institute wants to distribute teaching assignments of HRM, Psychology, Development Studies, Trade policy and Finance to five of six newly appointed faculty members. Prof. Fotedar does not want any assignment if Prof. Das gets one of the five. Prof. Chaudhury desires either HRM or Finance or no assignment. Prof. Banik opines that if Prof. Das gets either Psychology or Trade Policy then she must get the other one. Prof. Eswar insists on an assignment if Prof. Acharya gets one.
Which of the following is valid faculty - assignment combination if all the faculty preferences are considered?
Solution

The only option that confirms to the tabular data is B.
Thus, the correct option is B.
If Prof. Acharya gets HRM and Prof. Chaudhury gets Finance, then which of the following is not a correct faculty-assignment combination assuming all faculty preferences are considered?
Solution

If Professor Das takes the Psychology or Trade policy assignment, Banik has to take the other one.
Thus, the correct option is D.
Answer the questions based on the following information.
Five women decided to go for shopping to South Extension, New Delhi. They arrived at the designated meeting place in the following order: 1. Aradhana, 2. Chandrima, 3. Deepika, 4. Heena and 5. Sumitra. Each of them spent at least Rs. 1000. The woman who spent Rs. 2234 arrived before the woman who spent Rs. 1193. One of them spent Rs. 1340 and she was not Deepika. One woman spent Rs. 1378 more than Chandrima. One of them spent Rs. 2517 and she was not Aradhana. Heena spent more than Deepika. Sumitra spent the largest amount and Chandrima the smallest.
What was the amount spent by Heena?
Solution

If Chandrima spent 1193, then there would be one woman who spent 1193 + 1378 = 2571. Since 2571 is the highest spent amount, Sumitra will spend 2571. Also, Aradhana will spend 2234 as 2234 is spent before 1193. Now, since Deepika spent less than Heena, Deepika will spend 1340, but as Deepika cannot spend 1340, this is not a valid case.
Thus, Sumitra will spend 2517. Since Chandrima cannot spend 1193, she will spend 2517 - 1378 = 1139. Also, as Deepika cannot spend 1340, she will spend either 2234 or 1193. Since Deepika spent less than Heena, she will spend 1193. Also, as 2234 is spent before 1193, Aradhana will spend 2234.

Thus, the correct option is B.
Which of the following amount is spent by one of the women?
Solution

If Chandrima spent 1193, then there would be one woman who spent 1193 + 1378 = 2571. Since 2571 is the highest spent amount, Sumitra will spend 2571. Also, Aradhana will spend 2234 as 2234 is spent before 1193. Now, since Deepika spent less than Heena, Deepika will spend 1340, but as Deepika cannot spend 1340, this is not a valid case.
Thus, Sumitra will spend 2517. Since Chandrima cannot spend 1193, she will spend 2517 - 1378 = 1139. Also, as Deepika cannot spend 1340, she will spend either 2234 or 1193. Since Deepika spent less than Heena, she will spend 1193. Also, as 2234 is spent before 1193, Aradhana will spend 2234.

Since 1139 is spent by Chandrima, the correct option is A.
The lady who spent Rs. 1193 is:
Solution

If Chandrima spent 1193, then there would be one woman who spent 1193 + 1378 = 2571. Since 2571 is the highest spent amount, Sumitra will spend 2571. Also, Aradhana will spend 2234 as 2234 is spent before 1193. Now, since Deepika spent less than Heena, Deepika will spend 1340, but as Deepika cannot spend 1340, this is not a valid case.
Thus, Sumitra will spend 2517. Since Chandrima cannot spend 1193, she will spend 2517 - 1378 = 1139. Also, as Deepika cannot spend 1340, she will spend either 2234 or 1193. Since Deepika spent less than Heena, she will spend 1193. Also, as 2234 is spent before 1193, Aradhana will spend 2234.

Thus, the correct option is C.
Answer the questions based on the following information.
In a motor race competition certain rules are given for the participants to follow. To control direction and speed of the motorists, guards are placed at different signal points with caps of different colour. Guard with red cap indicates the direction of participant’s movement and guards with green cap indicates the speed of the participant’s movement. At any signal point presence of three guards, two guards and one guard with red cap means the participant must stop, turn left and turn right respectively. Signal points with three guards, two guards and one guard with green cap means the participants must move at 10, 4 and 2 km/hour respectively.
Kartikay, one of the participants, starts at a point where his car was heading towards north and he encountered signals as follows: at start point one guard with green cap; after half an hour two guards with red cap and two guards with green cap at first signal; after fifteen minutes one guard with red cap at second signal; after half an hour one guard with red cap and three guards with green caps at third signal; after 24 minutes two guard with red cap and two guards with green cap at fourth signal; after 15 minutes three guard with red cap at fifth signal. (Time mentioned in each case is applicable after crossing the previous signal).
Total distance travelled by Kartikay from starting point till last signal is:
Solution
The significance of guards:
Red colour caps:
I Guard: Right turn
2 Guards: Left turn
3 Guards: Stop
Green colour caps:
I Guard: 2km/hr
2 Guards: 4 km/hr
3 Guards: 10 km/hr
Now, the journey of Kartikay:
Start to 1st signal: 1 Km North
1st to 2nd signal: 1 Km left
2nd to 3rd signal: 2 Km right
3rd to 4th signal: 4 Km right 2
4th to 5th signal: 1 km left
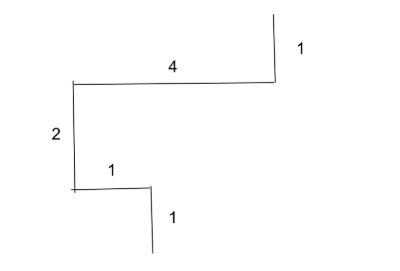
Total distance = 1 + 1 + 2 + 4 + 1 = 9km
Thus, the correct option is A
What would be the final position of Kartikay if one guard with red cap and two guards with green caps were placed at the first signal point after the starting point?
Solution
The significance of guards:
Red colour caps:
I Guard: Right turn
2 Guards: Left turn
3 Guards: Stop
Green colour caps:
I Guard: 2km/hr
2 Guards: 4 km/hr
3 Guards: 10 km/hr
Now, the journey of Kartikay:
Start to 1st signal: 1 Km North
1st to 2nd signal: 1 km right
2nd to 3rd signal: 2 Km right
3rd to 4th signal: 4 Km right 2
4th to 5th signal: 1 km left
 Thus, the final position of Kartikay is 3 km to the west and 2 km to the south.
Thus, the correct option is A.
If at the starting point Kartikay was heading towards south what would be his final position?
Solution
The significance of guards:
Red colour caps:
I Guard: Right turn
2 Guards: Left turn
3 Guards: Stop
Green colour caps:
I Guard: 2km/hr
2 Guards: 4 km/hr
3 Guards: 10 km/hr
Now, the journey of Kartikay:
Start to 1st signal: 1 Km South
1st to 2nd signal: 1 Km left
2nd to 3rd signal: 2 Km right
3rd to 4th signal: 4 Km right
4th to 5th signal: 1 km left

Thus, the final position of Kartikay is 3 km to the west and 4 km to the south.
Thus, the correct option is C.
Answer the questions based on the following information.
Mr. Mansingh has five sons - Arun, Mahi, Rohit, Nilesh and Saurav, and three daughters - Tamanna, Kuntala and Janaki. Three sons of Mr. Mansingh were born first followed by two daughters. Saurav is the eldest child and Janki is the youngest. Three of the children are studying at Trinity School and three are studying at St. Stefan. Tamanna studies at St. Stefan school. Kuntala, the eldest daughter, plays chess. Mansorover school offers cricket only, while Trinity school offers only chess. The children who are at Mansorover school have been born in succession. Mahi and Nilesh are cricketers while Arun plays football. Rohit who was born just before Janki, plays hockey.
Arun is the _________ child of Mr. Mansingh.
Solution
Let A, M, R, N, S, T, K and J represent Arun, Mahi, Rohit, Nilesh, Saurav, Tammana, Kuntala and Janaki.
Let us formulate the given information is a table form:-
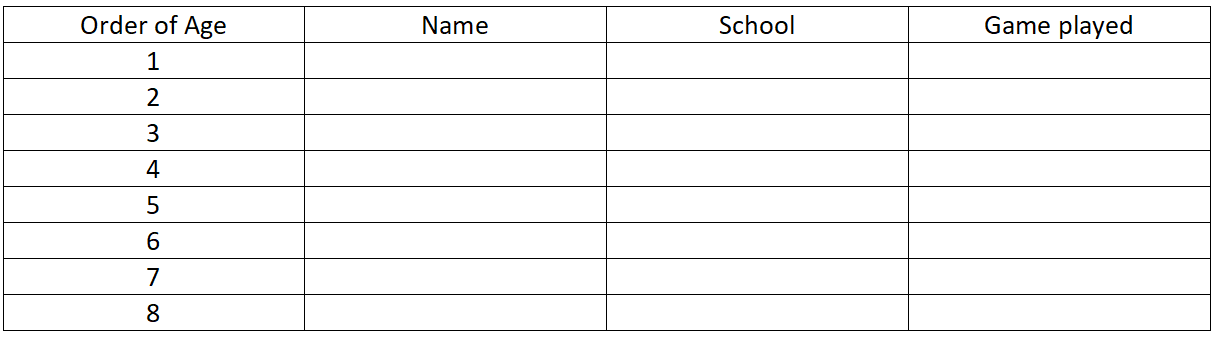
We are given that, Saurav is the eldest child and Janki is the youngest.
Thus, S is 1 and J is 8.
Rohit who was born just before Janki, plays hockey. Thus, Rohit is 7 and plays hockey.
Three sons of Mr. Mansingh were born first followed by two daughters.
Thus, 1,2,3 are sons and 4,5 are daughters.
Kuntala, the eldest daughter, plays chess.
Thus, Kunatala is 4 and plays chess.
The updated table is:-

Tamanna and Rohit study at St. Stefan school.
Mansorover school offers cricket only, while Trinity school offers chess.
Thus, Kuntala studies in Trinity.
Mahi and Nilesh are cricketers while Arun plays football
Thus, Mahi and Nilesh studies in Mansarovar.
we are given The children who are at Mansorover school have been born in succession and thus, Mahi and Nilesh are 2/3.
Thus, Tammana is 5 and Arun is 6.
Thus, the table is:-

Arun is the sixth child of Mr. Mansingh.
Hence, option C is the correct answer.
Saurav is a student of which school?
Solution
Let A, M, R, N, S, T, K and J represent Arun, Mahi, Rohit, Nilesh, Saurav, Tammana, Kuntala and Janaki.
Let us formulate the given information is a table form:-
We are given that, Saurav is the eldest child and Janki is the youngest.
Thus, S is 1 and J is 8.
Rohit who was born just before Janki, plays hockey. Thus, Rohit is 7 and plays hockey.
Three sons of Mr. Mansingh were born first followed by two daughters.
Thus, 1,2,3 are sons and 4,5 are daughters.
Kuntala, the eldest daughter, plays chess.
Thus, Kunatala is 4 and plays chess.
The updated table is:-
Tamanna and Rohit study at St. Stefan school.
Mansorover school offers cricket only, while Trinity school offers chess.
Thus, Kuntala studies in Trinity.
Mahi and Nilesh are cricketers while Arun plays football
Thus, Mahi and Nilesh studies in Mansarovar.
we are given The children who are at Mansorover school have been born in succession and thus, Mahi and Nilesh are 2/3.
Thus, Tammana is 5 and Arun is 6.
Thus, the table is:-
Thus, Saurav studies in Trinity.
Hence, option A is the correct answer.
What game does Tamanna play?
Solution
Let A, M, R, N, S, T, K and J represent Arun, Mahi, Rohit, Nilesh, Saurav, Tammana, Kuntala and Janaki.
Let us formulate the given information is a table form:-
We are given that, Saurav is the eldest child and Janki is the youngest.
Thus, S is 1 and J is 8.
Rohit who was born just before Janki, plays hockey. Thus, Rohit is 7 and plays hockey.
Three sons of Mr. Mansingh were born first followed by two daughters.
Thus, 1,2,3 are sons and 4,5 are daughters.
Kuntala, the eldest daughter, plays chess.
Thus, Kunatala is 4 and plays chess.
The updated table is:-
Tamanna and Rohit study at St. Stefan school.
Mansorover school offers cricket only, while Trinity school offers chess.
Thus, Kuntala studies in Trinity.
Mahi and Nilesh are cricketers while Arun plays football
Thus, Mahi and Nilesh studies in Mansarovar.
we are given The children who are at Mansorover school have been born in succession and thus, Mahi and Nilesh are 2/3.
Thus, Tammana is 5 and Arun is 6.
Thus, the table is:-
Thus, we cannot determine what game tammana plays.
Hence, option D is the correct answer.
Which of the following pairs was not born in succession (ignore the order)?
Solution
Let A, M, R, N, S, T, K and J represent Arun, Mahi, Rohit, Nilesh, Saurav, Tammana, Kuntala and Janaki.
Let us formulate the given information is a table form:-
We are given that, Saurav is the eldest child and Janki is the youngest.
Thus, S is 1 and J is 8.
Rohit who was born just before Janki, plays hockey. Thus, Rohit is 7 and plays hockey.
Three sons of Mr. Mansingh were born first followed by two daughters.
Thus, 1,2,3 are sons and 4,5 are daughters.
Kuntala, the eldest daughter, plays chess.
Thus, Kunatala is 4 and plays chess.
The updated table is:-
Tamanna and Rohit study at St. Stefan school.
Mansorover school offers cricket only, while Trinity school offers chess.
Thus, Kuntala studies in Trinity.
Mahi and Nilesh are cricketers while Arun plays football
Thus, Mahi and Nilesh studies in Mansarovar.
we are given The children who are at Mansorover school have been born in succession and thus, Mahi and Nilesh are 2/3.
Thus, Tammana is 5 and Arun is 6.
Thus, the table is:-
Thus, Kuntala and Arun are not born in succession
Hence, option B is the correct answer.
Answer the questions based on the following information.
In each question below three statements (I, II, III) are given followed by four conclusions numbered 1, 2, 3 and 4. You have to take the given statements to be true even if they seem to be at variance with commonly known facts. Read all the conclusions and then decide which of the given conclusions logically follows from the given statements, disregarding commonly known facts. Choose the correct options (A & D) presented below.
Statements:
I. Some drivers are technicians
II. All technicians are engineers
III. Some engineers are lecturers
Conclusions:
1. Some technicians are lecturers
2. Some lecturers are drivers
3. All engineers are technicians
4. Some engineers are drivers
Solution
The given condition is as shown below:-

From this we can see that only conclusion 4 follows.
Hence, option B is the correct answer.
Statements:
I. Some barbers are fashion designers
II. No fashion designers are businessmen
III. Some businessmen are traders
Conclusions:
1. No Fashion designers are traders
2. Some traders are not fashion designers
3. Some fashion designers are traders
4. Some barbers are not businessmen
Solution
The given situation is:
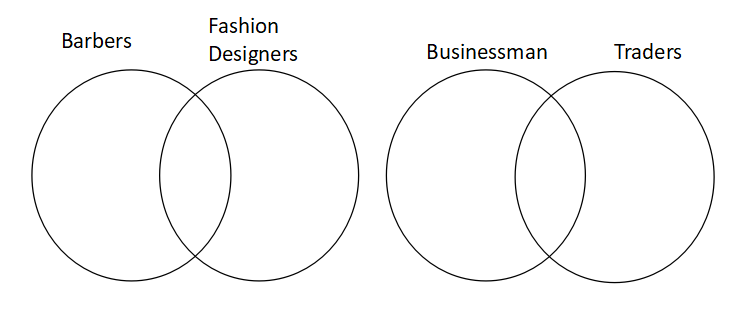

From this we can see either No Fashion designers are traders or Some fashion designers are traders.
As some barbers are Fashion designers thus, some barbers are not businessman.
As some traders are Businessman thus, some traders are not Fashion designers.
Hence, Either 1 or 3 and 2 and 4 follows.
Hence, option D is the correct answer.
For the following questions answer them individually
Pointing to Priya, father of Pritu says, “She is the daughter of the daughter of the wife of the only child of the grandfather of my sister.” How is Sushma related to Priya if Sushma is the sister of Pritu?
Solution
The given family tree is as shown below:-

Thus, Sushma is the cousin of Priya.
Hence, option D is the correct answer.
Answer the questions based on the following information. To get admission in a management course at Dadhichi Institute of Management (DIM) following criteria are given. A candidate must:
1. be a graduate from a recognized university with minimum 54 percent marks.
2. not be more than 33 years of age as on 1.4.2008.
3. have secured 60 percent or more marks in the entrance test.
4. pay one-time deposit fee of Rs. 2,00,000 at time of admission.
5. pay tuition fee of Rs.4,000 per month.
Any candidate who fails to fulfill the condition (4) at above, he/she may be referred to the chairman-admission.
Any candidate who has scored 80 percent mark in the entrance test but does not fulfill the condition (1) at above, he/she may be referred to the director. Any candidate having work experience of at least 10 years in supervisory cadre and does not satisfy the condition (2) at above, he/she may be admitted under sponsored quota.
Given the above information and condition in each of the following questions, you have to decide which of the following course of action should be taken. You should not assume anything in case of any of the candidates. Mark answer
I. if the candidate is admitted
II. if the candidate is not admitted
III. if the candidate is referred to the director
IV. if the candidate is referred to the chairman- admission
V. if the candidate is admitted under sponsor quota
Kamaljeet secured 60 percent marks in graduation and was born on 15th April 1976. He scored 56 percent marks in the entrance test. He can pay one-time deposit of Rs. 2,00,000 and monthly tuition fee of Rs. 4,000.
Solution
The given conditions are:-
1. be a graduate from a recognized university with minimum 54 percent marks.
2. not be more than 33 years of age as on 1.4.2008.
3. have secured 60 percent or more marks in the entrance test.
4. pay one-time deposit fee of Rs. 2,00,000 at time of admission.
5. pay tuition fee of Rs.4,000 per month.
We are given that:-
Kamaljeet secured 60 percent marks in graduation and was born on 15th April 1976. He scored 56 percent marks in the entrance test. He can pay one-time deposit of Rs. 2,00,000 and monthly tuition fee of Rs. 4,000.
Thus, Kamaljeet fulfills all the conditions except condition 3.
As there is no other alternative to condition 3, thus, Kamaljeet cannot be admitted.
Hence, option B is the correct answer.
Gourav is a first-class science graduate who obtained 81 percent marks in the entrance test. He has 12 years of work experience in supervisory cadre. He can pay the stipulated one- time deposit and monthly tuition fees. His date of birth is 20th October, 1970.
Solution
The given conditions are:-
1. be a graduate from a recognized university with minimum 54 percent marks.
2. not be more than 33 years of age as on 1.4.2008.
3. have secured 60 percent or more marks in the entrance test.
4. pay one-time deposit fee of Rs. 2,00,000 at time of admission.
5. pay tuition fee of Rs.4,000 per month.
We are given that:-
Gourav is a first-class science graduate who obtained 81 percent marks
in the entrance test. He has 12 years of work experience in supervisory
cadre. He can pay the stipulated one- time deposit and monthly tuition
fees. His date of birth is 20th October, 1970.
Hence, option D is the correct answer.
Read the following information and answer the questions given below it.
For selection of films produced before December 2007 for the national film festival of India, following criteria are given.
1. The film must be submitted to the National Film Development Corporation (NFDC) by 31.10.2007.
2. The production cost of the film should not exceed Rupees Five crores.
3. The director of the film should have passed a three year course either from the Film and Television Institute of India (FTII) or from Satyajit Ray Film & Television Institute.
4. The length of the film should not exceed 150 minutes.
5. The film must have been approved by the film censor board of India.
6. However, if the film fulfils all the above criteria except
(a) criteria 2 above, it must be sent to the finance secretary
(b) criteria 3 above, the director has done at least a one year course from FTII or Satyajit Ray Film & Television Institute, the film is kept as a stand-bye
On the basis of above information and information provided below, decide the course of action in each case. No further information is available. You are not to assume anything.
Mark answer:
I.if the film is to be selected
II.if the film is not to be selected
III.if the film should be sent to the finance secretary
IV.if the film should be kept as a stand-bye
V.if the data given about the film are not adequate to make a decision.
Film Dainandini was produced at the cost of Rupees 2.5 crore. It was submitted to the NFDC on 29th September 2007. The director of the film Govind Chadha passed a 3-year course from FTII. Length of film was 120 minutes and has been approved by the censor board of India.
Solution
The given conditions are:-
1. The film must be submitted to the National Film Development Corporation (NFDC) by 31.10.2007.
2. The production cost of the film should not exceed Rupees Five crores.
3. The director of the film should have passed a three year course either from the Film and Television Institute of India (FTII) or from Satyajit Ray Film & Television Institute.
4. The length of the film should not exceed 150 minutes.
5. The film must have been approved by the film censor board of India.
We are given that:-
Film Dainandini was produced at the cost of Rupees 2.5 crore(thus fulfills 2). It was submitted to the NFDC on 29th September 2007(thus, fulfills 1). The director of the film Govind Chadha passed a 3-year course from FTII(thus fulfills 3). Length of film was 120 minutes(thus fulfills 4) and has been approved by the censor board of India(thus fulfills 5)
Hence, as the given film fulfills all the conditions it has to be selected.
Hence, option A is the correct answer.
Bhadrasalam is a 135-minute film directed by Katyani, who was a student of Satyajit Ray Film & Television Institute from 1996 to 1999. The cost of producing the film was Rupees 2.3 crore and it was submitted to NFDC on 24th July 2007. The film has been approved by the censor board of India.
Solution
The given conditions are:-
1. The film must be submitted to the National Film Development Corporation (NFDC) by 31.10.2007.
2. The production cost of the film should not exceed Rupees Five crores.
3. The director of the film should have passed a three year course either from the Film and Television Institute of India (FTII) or from Satyajit
Ray Film & Television Institute.
4. The length of the film should not exceed 150 minutes.
5. The film must have been approved by the film censor board of India.
We are told that,
Bhadrasalam is a 135-minute film directed(thus fulfills 4) by Katyani, who was a student of Satyajit Ray Film & Television Institute from 1996 to 1999(3 may or not be fulfilled). The cost of producing the film was Rupees 2.3 crore(thus, 2 is fulfilled) and it was submitted to NFDC on 24th July 2007(thus, fulfilling 1). The film has been approved by the censor board of India(thus it fulfills 5).
Thus, as we are not sure about 3, we cannot make any decision.
Hence, option B is the correct answer.
Rakesh Mohan, the director of film Ek Bar Achanak, has successfully completed a 2-years course at Satyajit Ray Film & Television Institute. The 150-minute film was produced at rupees 4.85 crore. It has approved by the censor board of India and submitted to NFDC on 30th Nov. 2007.
Solution
The first condition is:-
The film must be submitted to the National Film Development Corporation (NFDC) by 31.10.2007
The given film was approved by the censor board of India and submitted to NFDC on 30th Nov. 2007.
Thus, the given film does not fulfill condition 1 and as there is no alternative to condition 1, thus, the given film should not be selected.
Hence, option D is the correct answer.
Answer the questions based on the following information.
A number arrangement machine, when given a particular input, rearranges it following a particular rule. Illustrations of the input and the steps of arrangement is given below.
Input: 245, 316, 436, 519, 868, 710, 689
Step 1: 710, 316, 436, 519, 868, 245, 689
Step 2: 710, 316, 245, 519, 868, 436, 689
Step 3: 710, 316, 245, 436, 868, 519, 689
Step 4: 710, 316, 245, 436, 519, 868, 689
Step 4 is the last step for the given input
If the input is given as “655, 436, 764, 799, 977, 572, 333”, which of the following step will be “333, 436, 572, 655, 977, 764, 799”?
Solution
The machine is arranging the numbers in the increasing order of the sum of the digits on the number.
Input: 245 (11), 316 (10), 436 (13), 519 (15), 868 (22), 710 (8), 689 (23).
The number in the bracket indicates the sum of digits of the given number.
Step 1: 710 (8), 316 (10), 436 (13), 519 (15), 868 (22), 245 (11), 689 (23).
∴ The machine has swapped 710 (8) with 245 (11).
Step 2: 710 (8), 316 (10), 245 (11), 519 (15), 868 (22), 436 (13), 689 (23).
Thus it has swapped 436 (13) with 245 (11).
Step 3: 710 (8), 316 (10), 245 (11), 436 (13), 868 (22), 519 (15), 689 (23).
Thus it has swapped 436 (13) with 519 (15).
Step 4: 710 (8), 316 (10), 245 (11), 436 (13), 519 (15), 868 (22), 689 (23).
Thus it has swapped 519 (15) with 868 (22).
Going by the logic mentioned above,
Input: 655 (16), 436 (13), 764 (17), 799 (25), 977 (23), 572 (14), 333 (9).
Step 1: 333 (9), 436 (13), 764 (17), 799 (25), 977 (23), 572 (14), 655 (16).
Step 2: 333 (9), 436 (13), 572 (14), 799 (25), 977 (23), 764 (17), 655 (16).
Step 3: 333 (9), 436 (13), 572 (14), 655 (16), 977 (23), 764 (17), 799 (25).
This is the required sequence which is achieved in Step 3.
Hence, option A is the correct answer.
How many steps will be required to get the final output from the following input?
Input: 544, 653, 325, 688, 461, 231, 857
Solution
The machine arranges the numbers in the increasing order of the sum of the digits on the number.
Input: 245 (11), 316 (10), 436 (13), 519 (15), 868 (22), 710 (8), 689 (23).
The number in the bracket indicates the sum of digits of the given number.
Step 1: 710 (8), 316 (10), 436 (13), 519 (15), 868 (22), 245 (11), 689 (23).
∴ The machine has swapped 710 (8) with 245 (11).
Step 2: 710 (8), 316 (10), 245 (11), 519 (15), 868 (22), 436 (13), 689 (23).
Thus it has swapped 436 (13) with 245 (11).
Step 3: 710 (8), 316 (10), 245 (11), 436 (13), 868 (22), 519 (15), 689 (23).
Thus it has swapped 436 (13) with 519 (15).
Step 4: 710 (8), 316 (10), 245 (11), 436 (13), 519 (15), 868 (22), 689 (23).
Thus it has swapped 519 (15) with 868 (22).
Given input: 544(14), 653(14), 325(10), 688(22), 461(11), 231(6), 857(20)
Step 1: 231, 653, 325, 688, 461, 544, 857
Step 2: 231, 325, 653, 688, 461, 544, 857
Step 3: 231, 325, 461, 688, 653, 544, 857
Step 4: 231, 325, 461, 544, 653, 688, 857
Step 5: 231, 325, 461, 544, 653, 857, 688
Thus, the correct option is B.
Step third for an input is “432, 433, 542, 666, 734, 355, 574” What will be the first step for the input?
Solution
The machine is arranging the numbers in the increasing order of the sum of the digits on the number.
Input: 245 (11), 316 (10), 436 (13), 519 (15), 868 (22), 710 (8), 689 (23).
The number in the bracket indicates the sum of digits of the given number.
Step 1: 710 (8), 316 (10), 436 (13), 519 (15), 868 (22), 245 (11), 689 (23).
∴ The machine has swapped 710 (8) with 245 (11).
Step 2: 710 (8), 316 (10), 245 (11), 519 (15), 868 (22), 436 (13), 689 (23).
Thus it has swapped 436 (13) with 245 (11).
Step 3: 710 (8), 316 (10), 245 (11), 436 (13), 868 (22), 519 (15), 689 (23).
Thus it has swapped 436 (13) with 519 (15).
Step 4: 710 (8), 316 (10), 245 (11), 436 (13), 519 (15), 868 (22), 689 (23).
Thus it has swapped 519 (15) with 868 (22).
We are given the result obtained in step 3rd. We can't go backward as there is no logic for processing backward. Hence, option D is the correct answer.
What will be the third step for the following input?
Input: 653, 963, 754, 345, 364, 861, 541
Solution
The machine arranges the numbers in the increasing order of the sum of the digits on the number.
Input: 245 (11), 316 (10), 436 (13), 519 (15), 868 (22), 710 (8), 689 (23).
The number in the bracket indicates the sum of digits of the given number.
Step 1: 710 (8), 316 (10), 436 (13), 519 (15), 868 (22), 245 (11), 689 (23).
∴ The machine has swapped 710 (8) with 245 (11).
Step 2: 710 (8), 316 (10), 245 (11), 519 (15), 868 (22), 436 (13), 689 (23).
Thus it has swapped 436 (13) with 245 (11).
Step 3: 710 (8), 316 (10), 245 (11), 436 (13), 868 (22), 519 (15), 689 (23).
Thus it has swapped 436 (13) with 519 (15).
Step 4: 710 (8), 316 (10), 245 (11), 436 (13), 519 (15), 868 (22), 689 (23).
Thus it has swapped 519 (15) with 868 (22).
Given Input: 653(17), 963(18), 754(16), 345,(12) 364(13), 861(15), 541(10).
Step 1: 541, 963, 754, 345, 364, 861, 653
Step 2: 541, 345, 754, 963, 364, 861, 653
Step 3: 541, 345, 364, 963, 754, 861, 653
Thus, the correct option is C.
Answer the questions based on the following information.
A word arrangement machine, when given a particular input, rearranges it following a particular rule. Following is the illustration of the input and the steps of arrangement:
Input: She was interested in doing art film
Step 1: art she was interested in doing film
Step 2: art was she interested in doing film
Step 3: art was in she interested doing film
Step 4: art was in film she interested doing
Step 5: art was in film doing she interested
Step 5 is the last step of the given input. Now study the logic and rules followed in the above steps, find out appropriate step for the question given below for the given input.
Which of the following will be the last step for the input given below?
Input: he is going out to search air
Solution
The arrangement is made by the last letter of each word.
The last letters of the seven words of the sample sequence input were e, s, d, n, g, t, and m.
In the final step, the words were arranged as t, s, n, m, g, d, and e, i.e., in descending order.
Now, the last letters of the seven words of the input in the questions are e, s, g, t, o, h, and r.
In the final step, the words will be arranged in the order of t, s, r, o, h, g, and e.
Option B represents the last step's accurate representation, and the correct option is B.
If step 2 of an input is “not is the casino considering legal action”, which step is: “not is casino action legal the considering”?
Solution
The arrangement is made by the last letter of each word.
The last letters of the seven words of the sample sequence input were e, s, d, n, g, t, and m.
In the final step, the words were arranged as t, s, n, m, g, d, and e, i.e., in descending order.
In each step, one letter was fixed in its last step position.
The last letters of the input are t, s, e, o, g, l, and n, and in the asked step, the letters are t, s, o, n, l, e, and g.
After the first step, the last letters of the pattern will be t, s, e, o, g, l, and n.
After the second step, the last letters of the pattern will be t, s, e, o, g, l, and n.
After the third step, the last letters of the pattern will be t, s, o, e, g, l, and n.
After the fourth step, the last letters of the pattern will be t, s, o, n, e, g, and l.
After the fifth step, the last letters of the pattern will be t, s, o, n, l, e, and g. Since this is the required pattern, the options do not give the correct answer.
Thus, the correct option is D.
How many steps will be required to get the final output from the following input?
Input: Father needs to check on the boy
Solution
The arrangement is made by the last letter of each word.
The last letters of the seven words of the sample sequence input were e, s, d, n, g, t, and m.
In the final step, the words were arranged as t, s, n, m, g, d, and e, i.e., in descending order.
In each step, one letter was fixed in its last step position.
In the given input, the last letters are r, s, o, k, n, e, and y.
The first step: y, r, s, o, k, n, and e.
The second step: y, s, r, o, k, n, and e.
The third step: y, s, r, o, n, k, and e.
Thus, the correct answer is 3 and the correct option is D.

For the following questions answer them individually
Among Anil, Bibek, Charu, Debu, and Eswar, Eswar is taller than Debu but not as fat as Debu. Charu is taller than Anil but shorter than Bibek. Anil is fatter than Debu but not as fat as Bibek. Eswar is thinner than Charu, who is thinner than Debu. Eswar is shorter than Anil. Who is the thinnest person?
Solution
The question asks for the thinnest person. Therefore, let us arrange the persons in the decreasing order of their weight.
Eswar is not as fat as Debu.
Therefore, Debu > Eswar.
Anil is fatter than Debu but not as fat as Bibek.
Bibek > Anil > Debu > Eswar.
Eswar is thinner than Charu, who is thinner than Debu
Bibek > Anil > Debu > Charu > Eswar.
Therefore, Eswar is the thinnest among the five persons and hence, option D is the right answer.
Pointing to a photograph Yuvraj says, “He is the only brother of the only daughter of my sister’s maternal grandmother.” Pointing to another photograph Sourav says, “he is the only brother of the only daughter of my sister’s maternal grandmother.” If among the two photographs,one was either of Sourav or Yuvraj, and the photograph, towards which Yuvraj was pointing,was not of Sourav, then how is Yuvraj related to Sourav?
Solution
"only brother of the only daughter of my sister’s maternal grandmother"
The daughter of my sister’s maternal grandmother is sister's mother. Mother's brother is maternal uncle of the person.
If Yuvraj is not pointing towards saurav then Saurav is pointing towards Yuvraj.
Thus, Yuvraj is the maternal uncle of Saurav.

Hence, option C is the correct answer.
DSBO Company produces Z units of output at a total cost of Rs. R, where $$R=\frac{1}{10}Z^{3}-5Z^{2}+10Z+5$$ At what level of output will the average variable cost attain its minimum?
Solution
$$Z$$ is the number of items produced by the company.
Total cost, $$R=\frac{1}{10}Z^{3}-5Z^{2}+10Z+5$$
As we can see, the term '5' does not vary with the number of quantities produced. Therefore, 5 is the fixed cost.
Variable cost = $$\frac{1}{10}Z^{3}-5Z^{2}+10Z$$
Average variable cost = Total variable cost/ number of quantities.
Average variable cost =$$\frac{1}{10}Z^{2}-5Z+10$$
=$$\frac{Z^2-50Z+100}{10}$$
=$$\frac{(Z^2-50Z+625)- 525}{10}$$
=$$\frac{(Z-25)^2-525}{10}$$
As we can see, the least value of the expression will be obtained at $$Z=25$$
Therefore, option C is the right answer.
If H$$_1$$ , H$$_2$$ , H$$_3$$ , ..., H$$_n$$ , are 'n' Harmonic means between ‘a’ and ‘b’ (≠ a), then value of $$\dfrac{H_{1}+a}{H_{1}-a}+\dfrac{H_{n}+b}{H_{n}-b}$$ is equal to
Solution
Let us assume that n = 3 and a, b = 2, 6.
Therefore, the harmonic sequence will be: 2, H$$_1$$, H$$_2$$, H$$_3$$, 6
Hence, H$$_2$$ = $$\dfrac{2*2*6}{2+6}$$ = 3
H$$_1$$ = $$\dfrac{2*2*3}{2+3}$$ = $$\dfrac{12}{5} = 2.4$$
H$$_3$$ = $$\dfrac{2*3*6}{3+6}$$ = $$4$$
Therefore, $$\dfrac{H_{1}+a}{H_{1}-a}+\dfrac{H_{n}+b}{H_{n}-b}$$
$$\dfrac{2.4+2}{2.4-2}+\dfrac{4+6}{4-6}$$
$$\Rightarrow$$ $$11-5$$ = 6.
Option B: 2n = 2*3 = 6.
If $$(n+2)C_8:(n-2)P_4=57:16$$, then n =
Solution
$$(n+2)C_8:(n-2)P_4=57:16$$
$$\Rightarrow$$ $$\dfrac{\dfrac{(n+2)!}{8!*(n-6)!}}{\dfrac{(n-2)!}{(n-6)!}}=\dfrac{57}{16}$$
$$\Rightarrow$$ $$\dfrac{(n+2)(n+1)(n)(n-1)}{8!}=\dfrac{57}{16}$$
$$\Rightarrow$$ $$(n+2)(n+1)(n)(n-1)=57*2520$$
$$\Rightarrow$$ $$(n+2)(n+1)(n)(n-1)=21*20*19*18$$
Therefore, n = 19.
Suppose a, b and c are in Arithmetic Progression and $$a^{2}, b^{2}$$ and $$c^{2}$$ are in Geometric Progression. If $$a<b<c$$ and a+b+c=$$\frac{3}{2}$$,, then the value of a=
Solution
Let us assume that the common difference of the A.P. is 'd'.
Then, we can say that a = b - d, c = b + d
It is given that a + b + c = 3/2. i.e. b = 1/2.
It is given that $$a^{2}, b^{2}$$ and $$c^{2}$$ are in Geometric Progression. Hence, we can say that
$$b^4 = a^2*c^2$$
$$b^4 = (b - d)^2*(b + d)^2$$
$$b^4 = (b^2 - d^2)^2$$
$$\Rightarrow$$ $$(b^2+d^2-b^2)(b^2-d^2+b^2)=0$$
Therefore, $$(b^2 - d^2 + b^2) = 0$$. i.e. $$d = \dfrac{1}{\sqrt{2}}$$
Hence, a = b - d = $$\dfrac{1}{2}$$ - $$\dfrac{1}{\sqrt{2}}$$.
If three positive real numbers a, b and c (c > a) are in Harmonic Progression, then log (a + c) + log (a - 2b + c) is equal to:
Solution
It has been given that the terms $$a, b,$$ and $$c$$ are in harmonic progression.
Therefore, $$\frac{1}{b} - \frac{1}{a} = \frac{1}{c} - \frac{1}{b}$$
$$\frac{2}{b}$$ = $$\frac{1}{a}$$ + $$\frac{1}{c}$$
$$\frac{2}{b} = \frac{a+c}{ac}$$
$$b = \frac{2ac}{(a+c)}$$--------------(1)
The given expression is log $$(a+c)$$ + log $$(a-2b+c)$$.
log $$(a+c) + log (a - 2b + c)$$ = log $$((a+c)(a-2b + c))$$
Substituting (1), we get,
log $$(a+c)$$ + log $$(a - 2b + c)$$ = log$$((a+c)(a - \frac{4ac}{(a+c)} +c))$$
= log ($$a^2 + ac - 4ac + c^2 + ac$$)
= log $$(a^2 + c^2 - 2ac)$$
= log $$(c-a)^2$$ [Since c is greater than a]
= 2 log $$(c-a)$$
Therefore, option C is the right answer.
Sum of the series $$1^{2} - 2^{2} + 3^{2} - 4^{2} + ... + 2001^{2} - 2002^{2} + 2003^{2}$$ is:
Solution
The given series is $$1^2 - 2^2 + 3^2 - 4^2 +.....+2003^2$$
$$1^2 - 2^2$$ can be written as $$(1+2)(1-2)$$ = $$3*(-1)$$ = $$-3$$
$$3^2 -4^2$$ can be written as $$(3+4)*(3-4)$$ = $$7*(-1)$$ = $$-7$$
$$5^2-6^2$$ can be written as $$(5+6)*(5-6)$$ = $$11*(-1)$$ = $$-11$$
Therefore, all the terms till $$2002^2$$ can be expressed as an AP.
The last term of the AP will be $$(2001+2002)(2001-2002)$$ = $$-4003$$
Therefore, the given expression is reduced to $$-3 - 7 ...-4003 + 2003^2$$
Let is evaluate the value of $$-3 - 7 ...-4003 $$
Number of terms,$$n$$ = $$\frac{4003-3}{4} + 1$$ = $$1001$$
Sum = $$\frac{n}{2} *$$(first term + last term)
= $$\frac{1001}{2}*(-4006)$$
= $$ -2005003$$
$$2003^2 = 4012009$$
Value of the given expression = $$4012009 - 2005003 = 2007006$$.
Therefore, option A is the right answer.
The number of ways in which a mixed double tennis game can be arranged amongst 9 married couples if no husband and wife play in the same game is:
Solution
There are 9 married couples. Therefore, there will be 9 men and 9 women.
First, let us select the 2 men.
2 men can be selected in 9C2 = 36 ways.
Now, the wives of these 2 men cannot be selected. Therefore, we have to select 2 women from the remaining 7 women.
2 women can be selected in 7C2 = 21 ways.
We have selected 2 men and 2 women. A team should consist of one man and one woman. Therefore, the 2 teams can be formed in 2 ways.
Therefore, the total number of ways in which the team can be selected is 36*21*2 = 1512.
Therefore, option B is the right answer.
The interior angles of a polygon are in Arithmetic Progression. If the smallest angle is 120° and common difference is 5°, then number of sides in the polygon is:
Solution
It has been given that the interior angles in a polygon are in an arithmetic progression.
We know that the sum of all exterior angles of a polygon is 360°.
Exterior angle = 180° - interior angle.
Since we are subtracting the interior angles from a constant, the exterior angles will also be in an AP.
The starting term of the AP formed by the exterior angles will be 180°-120° = 60° and the common difference will be -5°.
Let the number of sides in the polygon be 'n'.
=> The number of terms in the series will also be 'n'.
We know that the sum of an AP is equal to 0.5*n*(2a + (n-1)d), where 'a' is the starting term and 'd' is the common difference.
0.5*n*(2*60° + (n-1)*(-5°)) = 360°
120$$n$$ - 5$$n^2$$ + 5$$n$$ = 720
5$$n^2$$ - 125$$n$$ + 720 = 0
$$n^2$$ - 25$$n$$ + 144 =0.
$$(n-9)(n-16) = 0$$
Therefore, $$n$$ can be 9 or 16.
If the number of sides is 16, then the largest external angle will be 60 - 15*5 = -15°. Therefore, we can eliminate this case.
The number of sides in the polygon must be 9. Therefore, option C is the right answer.
A ladder 25 metres long is placed against a wall with its foot 7 metres away from the foot of the wall. How far should the foot be drawn out so that the top of the ladder may come down by half the distance of the total distance if the foot is drawn out?
Solution
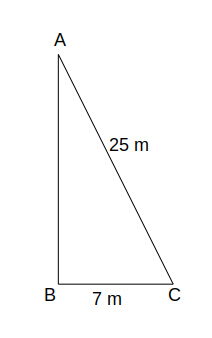
Distance between the top of ladder and foot of wall = $$\sqrt{25^2 - 7^2}$$ = 24 m. Let us assume that C is moved by a distance x m.
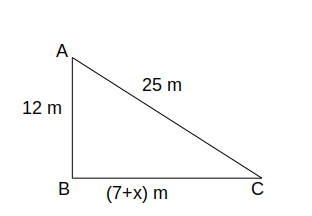
Using, Pythagoras theorem we can say that, 25^2 = 12^2 + (7+x)^2 => x = $$\sqrt{481}$$ - 7 = 14.93 m.
$$2-\frac{\sqrt{6407522209}}{\sqrt{3600840049}}=$$
Solution
$$2-\frac{\sqrt{6407522209}}{\sqrt{3600840049}}=2-\frac{80047}{60007}$$
=$$2-1.3339610$$
$$=0.666039$$
Therefore, option A is the right answer.
If the positive real numbers a, b and c are in Arithmetic Progression, such that abc = 4, then minimum possible value of b is:
Solution
It has been given that a, b, and c are in an arithmetic progression.
Let a = x-p, b = x, and c = x+p
We know that a, b, and c are real numbers.
Therefore, the arithmetic mean of a,b,c should be greater than or equal to the geometric mean.
$$\frac{a+b+c}{3} \geq \sqrt[3]{abc}$$
$$\frac{a+b+c}{3} \geq \sqrt[3]{4}$$
$$\frac{3x}{3}\geq\sqrt[3]{4}$$
$$x\geq\sqrt[3]{4}$$
We know that $$x$$ = $$b$$.
Therefore,$$b\geq\sqrt[3]{4}$$or $$b\geq 2^{\frac{2}{3}}$$
Therefore, option B is the right answer.
If one root of the equation $$ax^{2} + bx + c = 0$$ is double of the other, then $$2b^{2}$$ =
Solution
The given equation is $$ax^{2} + bx + c = 0$$
Roots of the given quadratic equation are $$\dfrac{-b\pm\sqrt{b^2-4ac}}{2a}$$
We know that one of the 2 roots is double the other.
Therefore, $$\dfrac{-b+\sqrt{b^2-4ac}}{2a}$$ =$$2*\dfrac{-b-\sqrt{b^2-4ac}}{2a}$$
=> $$-b +\sqrt{b^2-4ac} = -2b -2\sqrt{b^2-4ac}$$
=> $$b = -3\sqrt{b^2-4ac}$$
Squaring on both sides, we get,
$$b^2 = 9*(b^2-4ac)$$
$$8b^2 = 36 ac$$
$$2b^2 = 9ac$$.
Therefore, option A is the right answer.
Alternately
Suppose two roots are x, 2x
Sum of the roots= 3x=-b/a
Product of the roots=$$2x^{2}$$ = c/a
Putting the value of x from the first eqn.
We get $$2b^2 = 9ac$$..
A boat goes 30 km upstream and 44 km downstream in 10 hours. In 13 hours, it can go 40 km upstream and 55 km down-stream. The speed of the boat in still water is:
Solution
Let us assume the upstream speed of the boat = u and the downstream speed = v
30/u+44/v=10
40/u+55/v=13
Consider 1/u=a, 1/v=b, these equations become
30a+44b=10
40a+55b=13
We get a=1/5 and b=1/11 Hence, 1/u=1/5 and 1/v =1/11 => u=5 and v=11
Assuming speed of boat in still water is x and the speed of stream=y
u=x-y=5
v=x+y=11
From these equations, we get x=8 km/hr
$$Cot^{-1}[\frac{\sqrt{1-sina}+\sqrt{1+sina}}{\sqrt{1-sina}-\sqrt{1+sina}}]=$$
Solution
$$Cot^{-1}[\frac{\sqrt{sin^2(a/2)+cos^2(a/2)-2sin(a/2)cos(a/2)}+\sqrt{sin^2(a/2)+cos^2(a/2)+2sin(a/2)cos(a/2)}}{\sqrt{sin^2(a/2)+cos^2(a/2)-2sin(a/2)cos(a/2)}-\sqrt{sin^2(a/2)+cos^2(a/2)+2sin(a/2)cos(a/2)}}]$$
$$Cot^{-1}[\frac{cos(a/2)-sin(a/2) + cos(a/2) + sin(a/2)}{cos(a/2)-sin(a/2) - cos(a/2) - sin(a/2)}]$$
$$Cot^{-1}[\frac{-2cos(a/2)}{2sin(a/2)}]$$
$$Cot^{-1}[Cot(-a/2)]$$
We know that $$Cot^{-1}[-x] = \pi - Cot^{-1}[x]$$
Therefore, $$Cot^{-1}[Cot(-a/2)]$$ = $$\pi - Cot^{-1}[Cot(a/2)]$$ = $$\pi-\frac{1}{2}a$$
A pole has to be erected on the boundary of a circular park of diameter 13 metres in such a way that the difference of its distances from two diametrically opposite fixed gates A and B on the boundary is 7 metres. The distance of the pole from one of the gates is:
Solution
Let us construct a diagram based on the given statements.
There are 2 diametrically opposite gates A and B.
A pole is erected on the circumference such that the distance of the pole from one of the gates is 7 m more than the distance of the pole from the other gate. Let the distances be x and x+7 m.

Now, APB is a right-angled triangle (since AB is the diameter).
Applying Pythagoras theorem, we get,
$$13^2 = x^2 + (x+7)^2$$
$$169=x^2+x^2+14x+49$$
$$120 = 2x^2 + 14x$$
$$x^2 + 7x - 60 = 0$$
$$(x+12)(x-5)=0$$
Therefore, $$x$$ can be $$-12$$ or $$5$$.
$$x$$ cannot be negative. Therefore, $$x$$ has to be $$5$$.
The distance of the pole from one of the gates is 5 m. Therefore, option C is the right answer.
A spiral is made up of 13 successive semicircles, with centres alternately at A and B, starting with the centre at A. The radii of semicircles thus developed are 0.5 cm, 1.0 cm, 1.5 cm, 2.0 cm and so on. The total length of the spiral is:
Solution
The length of the spiral will be equal to the length of the circular arc portions of the semicircles.
Length of the circular arc portion of a semicircle = $$\frac{22}{7}*r$$.
Length of the spiral = $$\frac{22}{7}*(0.5+1+1.5+2+...+6.5)$$
= $$\frac{22}{7}*0.5*[1+2+3+....+13]$$
= $$\frac{11}{7}*\frac{13*14}{2}$$
=$$143$$ cm.
Therefore, option B is the right answer.
The mean salary in ICM LTD. was Rs. 1,500, and the standard deviation was Rs. 400. A year later
each employee got a Rs. 100 raise. After another year each employee’s salary (including the above mentioned raise) was increased by 20%. The standard deviation of the current salary is:
Solution
Standard deviation is the measure of how much the values in the group differ from the average.
If the salary of each person is increased by 100, the average salary will also be increased by 100. Therefore, the standard deviation will remain unaltered in this case.
Every person is given a hike of 20%. Therefore, the standard deviation will also increase by 20%. Therefore, the new standard deviation will be 1.2*400 = 480. Therefore, option B is the right answer.
A medical clinic tests blood for certain disease from which approximately one person in a hundred suffers. People come to the clinic in group of 50. The operator of the clinic wonders whether he can increase the efficiency of the testing procedure by conducting pooled tests. In the pooled tests, the operator would pool the 50 blood samples and test them altogether. If the polled test was negative, he could pronounce the whole group healthy. If not, he could then test each person’s blood individually. The expected number of tests the operator will have to perform if he pools the blood samples are:
Solution
1 person in every 100 suffers from the disease.
Probability of a person being healthy = $$\ \frac{\ 99}{100}$$
In a group of 50 people if the test is positive, then he could then test each person’s blood individually otherwise he will consider that the entire group is healthy
The number of tests =50+1 = 51
The probability that all the people in the group are healthy = $$^{50}C_{50}\ \times\ \left(\ \frac{\ 99}{100}\right)^{50}$$
= approx 0.605
So the probability that atleast one person suffers in a group of 50 = 1-0.605= 0.395
Expected number of tests = 51*0.395 + 0.605*1
= 20.145+0.605
=20.75 = 21 tests.
C is the correct answer.
The game of “chuck-a-luck” is played at carnivals in some parts of Europe. Its rules are as follows: if you pick a number from 1 to 6 and the operator rolls three dice. If the number you picked comes up on all three dice, the operator pays you €3; if it comes up on two dice, you are paid €2; and if it comes up on just one die, you are paid €1. Only if the number you picked does not come up at all, you pay the operator €1. The probability that you will win money playing in this game is:
Solution
There are 3 ways to win money in the game.
The number you picked can come up in one dice, 2 dice or 3 dice.
The probability of the number you picked coming in all three dice = (1/6)*(1/6)*(1/6) = 1/216
The probability of the number picked coming on 2 dice = 3C2*(5/6)(1/6)(1/6) = 15/216
The probability of the number picked coming on 1 dice = 3C1*(5/6)(5/6)(1/6) = 75/216
Probability of winning = 1/216 + 15/214 + 75/216 = 91/216 = 0.421.
Therefore, option C is the right answer.
Answer the questions based on the following information.
Rajat is sales manager of Dubin Computers Ltd. and looks after Delhi market. The company sells laptops in India. He is currently trying to select a distributor for coming five years. The distributor ensures that the products are accessible to the customers in the market. Market share of a company depends on the coverage by the distributor. The total profit potential of the entire laptop market in Delhi is Rs. 5 crores in the current year and present value of next four years’ cumulative profit potential is Rs. 15 crores. The first choice for Rajat is to enter into long-term contract with a distributor M/s Jagan with whom Dubin has done business in the past, and whose distribution system reaches 55 percent of all potential customers. At the last moment, however, a colleague suggests Rajat to consider signing a one-year contract with other distributors. Distributors M/s Bola and M/s James are willing to be partner with Dubin. Although a year ago M/s Bola’s and M/s James’s coverage reached only 40 and 25 percent of customers respectively, they claim to have invested heavily in distribution resources and now expect to be able to reach 60 percent and 75 percent of customers respectively. The probability of M/s Bola’s claim and M/s James’s claim to be true is 0.60 and 0.20 respectively. The knowledge about distributors’ coverage will evolve over time. The assumption is that the true level of coverage offered by the new distributors could be discovered, with certainty, through a one-year trail, and this trail will reveal exactly one of the two levels of coverage: for example in case of M/s Bola – 40 percent (as it was last year) or 60 percent (as claimed). In addition, it is also assumed that whatever the coverage is for both distributors, it will not change over time. Rajat narrows down on three choices, which are as follows:
Choice 1. Give a five year contract to the familiar distributor M/s Jagan.
Choice 2. Give a one year contract to the new distributor M/s Bola, and base next year’s decision to renew contract with M/s Bola on observed coverage for next four years or enter into a four years' contract with M/s Jagan.
Choice 3. Give a one-year contract to the new distributor M/s James, and base next year’s decision to renew contract with M/s James on observed coverage for next four years or enter into a four years contract with M/s Jagan..
The expected present value of the five years cumulative profit with choice 3 is:
Solution
We are left with 3 choices.
Choice 1:
The first choice is to give the contract to M/S Jagan. In this case, we know that Jagan's market reach is 55%. It has been given that the total profit potential is 5 crores in the present year and 15 crores in the next 4 years.
Therefore, the expected value of profit earned for choice 1 is 0.55*(5+15) = Rs.11 crore.
Choice 2:
Give the contract to M/s Bola for one year and based on the performance, renew the contract with him for the next 4 years or give M/S Jagan the contract for the next 4 years.
Let us assume that M/S Bola retains the contract for all 5 years. Rajat will renew the contract only if M/S Bola's claim that their market reach is 60% is true. The probability of the claim being true is 0.6.
Therefore, the EV of return if M/S Bola bags the contract for all 5 years = 0.6*0.6*(5+15) = Rs. 7.2 crores.
Let us assume that M/S Bola's claim is false. The probability of the claim being false is 1-0.6 = 0.4.
Now, if the claim is false, Rajat will terminate the contract by the end of the year and will partner with M/S Jagan for the next 4 years. Also, we have historic data that M/S Bola reaches 40% of the customers. Even if the claim is false, the laptops will reach 40% of the customers in the first year and 55% of the customers from the second year (Since M/S Jagan will bag the contract).
Therefore, the EV of profit in this case is 0.4*0.4*5+0.4*0.55*15 = 0.8 + 3.3 = Rs.4.1 crores.
Therefore, the total EV if M/S Bola bags the contract the first year is 7.2+4.1 = Rs.11.3 crores.
Choice 3:
Give the contract to M/s James for one year and based on the performance, renew the contract with him for the next 4 years or give M/S Jagan the contract for the next 4 years.
Let us assume that M/S James retains the contract for all 5 years. Rajat will renew the contract only if M/S Jame's claim that their market reach is 75% is true. The probability of the claim being true is 0.2.
Therefore, the EV of return if M/S James bags the contract for all 5 years = 0.2*0.75*(5+15) = Rs. 3 crores.
Let us assume that M/S James's claim is false. The probability of the claim being false is 1-0.2 = 0.8.
Now, if the claim is false, Rajat will terminate the contract by the end of the year and will partner with M/S Jagan for the next 4 years. Also, we have historic data that M/S James reaches 25% of the customers. Even if the claim is false, the laptops will reach 25% of the customers in the first year and 55% of the customers from the second year (Since M/S Jagan will bag the contract).
Therefore, the EV of profit in this case is 0.8*0.25*5+0.8*0.55*15 = 1 + 6.6 = Rs.7.6 crores.
Therefore, the total EV if M/S Bola bags the contract the first year is 3+7.6 = Rs.10.6 crores.
EV of choice 1 = Rs. 11 crores
EV of choice 2 = Rs. 11.3 crores
EV of choice 3 = Rs. 10.6 crores
The expected value of choice 3 is Rs.10.6 crores. Therefore, option B is the right answer.
Which of the following statements is TRUE?
Solution
We are left with 3 choices.
Choice 1:
The first choice is to give the contract to M/S Jagan. In this case, we know that Jagan's market reach is 55%. It has been given that the total profit potential is 5 crores in the present year and 15 crores in the next 4 years.
Therefore, the expected value of profit earned for choice 1 is 0.55*(5+15) = Rs.11 crore.
Choice 2:
Give the contract to M/s Bola for one year and based on the performance, renew the contract with him for the next 4 years or give M/S Jagan the contract for the next 4 years.
Let us assume that M/S Bola retains the contract for all 5 years. Rajat will renew the contract only if M/S Bola's claim that their market reach is 60% is true. The probability of the claim being true is 0.6.
Therefore, the EV of return if M/S Bola bags the contract for all 5 years = 0.6*0.6*(5+15) = Rs. 7.2 crores.
Let us assume that M/S Bola's claim is false. The probability of the claim being false is 1-0.6 = 0.4.
Now, if the claim is false, Rajat will terminate the contract by the end of the year and will partner with M/S Jagan for the next 4 years. Also, we have historic data that M/S Bola reaches 40% of the customers. Even if the claim is false, the laptops will reach 40% of the customers in the first year and 55% of the customers from the second year (Since M/S Jagan will bag the contract).
Therefore, the EV of profit in this case is 0.4*0.4*5+0.4*0.55*15 = 0.8 + 3.3 = Rs.4.1 crores.
Therefore, the total EV if M/S Bola bags the contract the first year is 7.2+4.1 = Rs.11.3 crores.
Choice 3:
Give the contract to M/s James for one year and based on the performance, renew the contract with him for the next 4 years or give M/S Jagan the contract for the next 4 years.
Let us assume that M/S James retains the contract for all 5 years. Rajat will renew the contract only if M/S Jame's claim that their market reach is 75% is true. The probability of the claim being true is 0.2.
Therefore, the EV of return if M/S James bags the contract for all 5 years = 0.2*0.75*(5+15) = Rs. 3 crores.
Let us assume that M/S James's claim is false. The probability of the claim being false is 1-0.2 = 0.8.
Now, if the claim is false, Rajat will terminate the contract by the end of the year and will partner with M/S Jagan for the next 4 years. Also, we have historic data that M/S James reaches 25% of the customers. Even if the claim is false, the laptops will reach 25% of the customers in the first year and 55% of the customers from the second year (Since M/S Jagan will bag the contract).
Therefore, the EV of profit in this case is 0.8*0.25*5+0.8*0.55*15 = 1 + 6.6 = Rs.7.6 crores.
Therefore, the total EV if M/S Bola bags the contract the first year is 3+7.6 = Rs.10.6 crores.
EV of choice 1 = Rs. 11 crores
EV of choice 2 = Rs. 11.3 crores
EV of choice 3 = Rs. 10.6 crores
Arranging the choices in terms of their EV, we get, Choice 2 > Choice 1 > Choice 3.
Option A:
Choice 1 is more profitable than Choice 2
Option B:
Choice 3 is more profitable than Choice 2
Option C:
Choice 3 is more profitable than Choice 1
As we can see, all three options are false. Therefore, option D is the right answer.
If the distributor M/s James claims a coverage of 55% instead of 75% and probability of this claim to be true is 0.70 instead of 0.20 then which of the following statement is true?
Solution
We are left with 3 choices.
Choice 1:
The first choice is to give the contract to M/S Jagan. In this case, we know that Jagan's market reach is 55%. It has been given that the total profit potential is 5 crores in the present year and 15 crores in the next 4 years.
Therefore, the expected value of profit earned for choice 1 is 0.55*(5+15) = Rs.11 crore.
Choice 2:
Give the contract to M/s Bola for one year and based on the performance, renew the contract with him for the next 4 years or give M/S Jagan the contract for the next 4 years.
Let us assume that M/S Bola retains the contract for all 5 years. Rajat will renew the contract only if M/S Bola's claim that their market reach is 60% is true. The probability of the claim being true is 0.6.
Therefore, the EV of return if M/S Bola bags the contract for all 5 years = 0.6*0.6*(5+15) = Rs. 7.2 crores.
Let us assume that M/S Bola's claim is false. The probability of the claim being false is 1-0.6 = 0.4.
Now, if the claim is false, Rajat will terminate the contract by the end of the year and will partner with M/S Jagan for the next 4 years. Also, we have historic data that M/S Bola reaches 40% of the customers. Even if the claim is false, the laptops will reach 40% of the customers in the first year and 55% of the customers from the second year (Since M/S Jagan will bag the contract).
Therefore, the EV of profit in this case is 0.4*0.4*5+0.4*0.55*15 = 0.8 + 3.3 = Rs.4.1 crores.
Therefore, the total EV if M/S Bola bags the contract the first year is 7.2+4.1 = Rs.11.3 crores.
It has been given in this question that M/S James claims a coverage of 55% and the probability of this being true is 0.7.
Choice 3:
Give the contract to M/s James for one year and based on the performance, renew the contract with him for the next 4 years or give M/S Jagan the contract for the next 4 years.
Let us assume that M/S James retains the contract for all 5 years. Rajat will renew the contract only if M/S Jame's claim that their market reach is 55% is true. The probability of the claim being true is 0.7.
Therefore, the EV of return if M/S James bags the contract for all 5 years = 0.7*0.55*(5+15) = Rs. 7.7 crores.
Let us assume that M/S James's claim is false. The probability of the claim being false is 1-0.7 = 0.3.
Now, if the claim is false, Rajat will terminate the contract by the end of the year and will partner with M/S Jagan for the next 4 years. Also, we have historic data that M/S James reaches 25% of the customers. Even if the claim is false, the laptops will reach 25% of the customers in the first year and 55% of the customers from the second year (Since M/S Jagan will bag the contract).
Therefore, the EV of profit in this case is 0.3*0.25*5+0.3*0.55*15 = 0.375 + 2.475 = Rs.2.85 crores.
Therefore, the total EV if M/S Bola bags the contract the first year is 7.7+2.85 = Rs.10.55 crores.
EV of choice 1 = Rs. 11 crores
EV of choice 2 = Rs. 11.3 crores
EV of choice 3 = Rs. 10.55 crores
Arranging the choices by EV, we get, Choice 2 > Choice 1 > Choice 3.
Choice 2 is more profitable than choice 3. Therefore, option B is true and hence, option B is the right answer.
For the following questions answer them individually
McDonald’s ran a campaign in which it gave game cards to its customers. These game cards made it possible for customers to win hamburgers, French fries, soft drinks, and other fast-food items, as well as cash prizes. Each card had 10 covered spots that could be uncovered by rubbing them with a coin. Beneath three of these spots were “No Prize” signs. Beneath the other seven spots were names of the prizes, two of which were identical. For, example, one card might have two pictures of a hamburger, one picture of a coke, one of French fries, one of a milk shake, one of a $5, one of $1000, and three “No Prize” signs. For this card the customer could win a hamburger. To win on any card, the customer had to uncover the two matching spots (which showed the potential prize for that card)before uncovering a “No Prize”; any card with a “No Prize” uncovered was automatically void. Assuming that the two matches and the three “No Prize” signs were arranged randomly on the cards, what is the probability of a customer winning?
Solution
Case 2: When we win by uncovering just 3 spots.
_ _ P _ _ _ _ _ _ _
From the first two uncovered spots 1 will show up P. Out of remaining 7 spots, 3 spots will be filled by No prize. Total number of ways = 2C1*7C3*5!
There are a total of 10 spots out of which 3 are of one type (No Prize), 2 are of one time (The one which will give us prize) and 5 are different. Therefore, total number of combination in which we can uncover these spots = $$\dfrac{10!}{2!*3!}$$
We win if we win the two same card before any of the No prize spot. We can win by uncovering just 2 spots and a maximum of 7 spots. Let 'P' denotes the occurrence of winner card.
Case 1: When we win by uncovering just 2 spots.
P P _ _ _ _ _ _ _ _
Out of remaining 8 spots, 3 spots will be filled by No prize and 5 with different signs. Total number of ways = 8C3*5!
Case 2: When we win by uncovering just 3 spots.
_ _ P _ _ _ _ _ _ _
From the first two uncovered spots 1 will show up P. Out of remaining 7 spots, 3 spots will be filled by No prize. Total number of ways = 2C1*7C3*5!
Case 3: When we win by uncovering just 4 spots.
_ _ _ P _ _ _ _ _ _
From the first three uncovered spots 1 will show up P. Out of remaining 6 spots, 3 spots will be filled by No prize. Total number of ways = 3C1*6C3*5!
Case 4: When we win by uncovering just 5 spots.
_ _ _ _ P _ _ _ _ _
From the first four uncovered spots 1 will show up P. Out of remaining 5 spots, 3 spots will be filled by No prize. Total number of ways = 4C1*5C3*5!
Case 5: When we win by uncovering just 6 spots.
_ _ _ _ _ P _ _ _ _
From the first five uncovered spots 1 will show up P. Out of remaining 4 spots, 3 spots will be filled by No prize. Total number of ways = 5C1*4C3*5!
Case 6: When we win by uncovering just 7 spots.
_ _ _ _ _ _ P _ _ _
From the first six uncovered spots 1 will show up P. Out of remaining 3 spots, 3 spots will be filled by No prize. Total number of ways = 6C1*3C3*5!
Hence, the probability that a customer will win = $$\dfrac{8C3*5!+2C1*7C3*5!+3C1*6C3*5!+4C1*5C3*5!+5C1*4C3*5!+6C1*3C3*5!}{\dfrac{10!}{2!*3!}}$$
$$\Rightarrow$$ $$\dfrac{3!*2!*5!(56+70+60+40+20+6)}{10!}$$
$$\Rightarrow$$ $$\dfrac{1}{10}$$. Therefore, option A is the correct answer.
While packing for a business trip Mr. Debashis has packed 3 pairs of shoes, 4 pants, 3 half-pants, 6 shirts, 3 sweater and 2 jackets. The outfit is defined as consisting of a pair of shoes, a choice of “lower wear” (either a pant or a half-pant), a choice of “upper wear” (it could be a shirt or a sweater or both) and finally he may or may not choose to wear a jacket. How many different outfits are possible?
Solution
Let us find out the number of ways in which an outfit can be selected.
An outfit is defined as a pair of shoes, an upper wear, and a lower wear.
A pair of shoes can be selected in 3 ways.
There are 4 pants and 3 half-pants.
A pant or a half-pant can be selected in 7 ways.
A shirt can be selected in 6 ways.
A sweater can be selected in 3 ways.
A shirt and a sweater can be selected in 18 ways.
Therefore, an upper wear can be selected in 6+3+18 = 27 ways.
A jacket can be worn in 1 (no jacket is selected) + 2 (one of the 2 jackets is selected) = 3 ways.
Therefore, the total number of ways in which an outfit can be worn = 3*7*27*3 = 1701.
As the answer is not among the given choices, option D is the right answer.
If $$\tan x +\tan(x+\frac{\pi}{3}) + \tan(x+\frac{2\pi}{3})=3$$ then which of the following is correct?
Solution
Substituting $$x+\frac{\pi}{3} = a$$.
$$tan(a-\frac{\pi}{3}) +tan(a)+tan(a+\frac{\pi}{3})=3$$
We know that $$tan(a-b)=\dfrac{tan(a)-tab(b)}{1+tan(a)*tan(b)}$$
Therefore, $$tan(a-\frac{\pi}{3})$$=$$\dfrac{tan(a)-tab(\frac{\pi}{3})}{1+tan(a)*tan(\frac{\pi}{3})}$$
$$tan(a-\frac{\pi}{3})$$=$$\dfrac{tan(a)-\sqrt{3}}{1+\sqrt{3}tan(a)}$$
Similarly, $$tan(a+\frac{\pi}{3})$$=$$\dfrac{tan(a)+\sqrt{3}}{1-\sqrt{3}tan(a)}$$
Hence, $$tan(a-\frac{\pi}{3}) +tan(a)+tan(a+\frac{\pi}{3})$$ = $$\dfrac{tan(a)-\sqrt{3}}{1+\sqrt{3}tan(a)}$$ + tan(a) + $$\dfrac{tan(a)+\sqrt{3}}{1-\sqrt{3}tan(a)}$$
$$\Rightarrow$$ $$\dfrac{8tan(a)}{1-3tan^2(a)}+tan(a)$$
$$\Rightarrow$$ $$\dfrac{9tan(a)-3tan^3(a)}{1-3tan^2(a)}$$
$$\Rightarrow$$ $$3tan(3a)$$
It is given that, $$3tan(3a) = 3$$
Substituting $$a = x+\frac{\pi}{3}$$
$$tan[3(x+\frac{\pi}{3})] = 1$$
$$tan[\pi + 3x] = 1$$ i.e. $$tan(3x) = 1$$. Hence, option C is the correct answer.
If D is the midpoint of side BC of a triangle ABC and AD is the perpendicular to AC then:
Solution
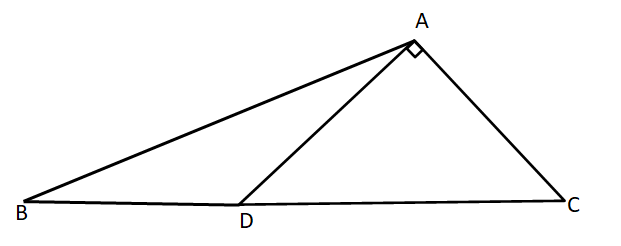
Using Apollonius theorem in $$\triangle$$ ABC, we can say that,
$$2(AD^2+BD^2) = AB^2+AC^2$$ ... (1)
In right-angle triangle ADC, $$DC^2 = AD^2 + AC^2$$ ... (2)
By equation (1) and (2), we can say that
$$2(DC^2 - AC^2 +BD^2) = AB^2+AC^2$$
$$3AC^2 = BC^2 - AB^2$$
Therefore, option A is the correct answer.
A cylinder, a Hemi-sphere and a cone stand on the same base and have the same heights. The ratio of the areas of their curved surface is:
Solution
The cylinder, hemisphere and cone stand on the same base and have the same height. Let the radius of the three solids be $$r$$ and the height be $$h$$.
Height of the hemisphere, $$h$$ = $$r$$ (Radius)
Curved surface area of the cylinder = $$2*\pi*r*r$$ = $$2*\pi*r^2$$
Curved surface area of the hemisphere = $$2*\pi*r^2$$
Curved surface area of the cone = $$\pi*r*\sqrt{r^2+r^2}$$ = $$\pi*r*\sqrt{r^2+r^2}$$ = $$\pi*r^2*\sqrt{2}$$
Ratio = $$2:2:\sqrt{2}$$ = $$\sqrt{2}:\sqrt{2}:1$$
As the answer is not among the given options, option D is the right answer.
Answer the questions based on the following table.

Find the TRUE Statement:
Solution
Option A:
In 2002:
Covered wagons = 71950
Total wagons = 216717
Thus the percentage of covered wagons = $$\frac{71950}{216717}\times\ 100\ =33.2\%$$
In 2003:
The percentage of covered wagons = $$\frac{68467}{214760}\times\ 100\ =31.88\%$$
Since the percentage decreased in 2003, this option is not true.
Option B:
In 2003, special type wagons = 37650
Total wagons = 214760
Percentage = $$\frac{37650}{214760}\times\ 100\ =17.5\%$$
From the above table, it can be observed that the least number of total wagons is in 2003.
After calculating in a similar way, it can be observed that the percentage was maximum in 2003.
Thus, the correct option is B.
The special type wagons expressed as a percentage of total wagons were at almost same level during the following pair of years:
Solution
In 2000, special type wagons = 40316
Total wagons = 234397
Percentage = $$\frac{40316}{234397}\times\ 100\ \approx\ 17.2\%$$
In 2002, special type wagons = 37275
Total wagons = 216717
Percentage = $$\frac{37275}{216717}\times\ 100\ \approx\ 17.2\%$$
Thus, the correct option is C.
The Departmental wagons expressed as a percentage of total wagons was maximum during:
Solution
In 2002, the percentage of departmental wagons to the total wagons = $$\frac{9536}{216717}\times\ 100\ =4.4\%$$
In 2003, the percentage of departmental wagons to the total wagons = $$\frac{10718}{214760}\times\ 100\ =\ 4.99\%$$
In 2004, the percentage of departmental wagons to the total wagons = $$\frac{11388}{227752}\times\ 100\ = 5\%$$
In 2005, the percentage of departmental wagons to the total wagons = $$\frac{10964}{222379}\times\ 100\ = 4.93\%$$
Thus, the correct option is C.
Find out the LOWEST annual growth rate among the following:
Solution
Option A) Annual growth rate of total wagons in 1999
The growth rate in 1999 over 1998 = $$\dfrac{\left(252944-263981\right)}{263981}\times\ 100=-4.18\%$$
Option B) Annual growth rate of covered wagons in 1998
The growth rate in 1998 over 1997 = $$\dfrac{\left(102217-106634\right)}{106634}\times\ 100=-4.14\%$$
Option C) Annual growth rate of special type wagons in 2002
The growth rate in 2002 over 2001 = $$\dfrac{\left(37275-38884\right)}{38884}\times\ 100=-4.13\%$$
Option D) Annual growth rate of total wagon capacity in 2000
The growth rate in 2000 over 1999 = $$\dfrac{\left(10.26-10.7\right)}{10.7}\times\ 100=-4.11\%$$
Thus, the correct option is A.
Find out the FALSE statement:
Solution
Option A: The growth rate of covered wagons in 1996 over 1995 = $$\frac{\left(114065-121946\right)}{121946}\times\ 100=-6.5\%$$
The growth rate of covered wagons in 2000 over 1999 = $$\frac{\left(86024-96371\right)}{96371}\times\ 100=-10.5\%$$
Since this is true, option A is not the correct answer.
Option B:
The annual growth rate of open high sided wagons in 1997 over 1996 = $$\frac{\left(98906-98297\right)}{98297}\times\ 100= 0.62\%$$
The annual growth rate of open high sided wagons in 2003 over 2002 = $$\frac{\left(90765-90371\right)}{90371}\times\ 100= 0.44\%$$
Since this option is also true, option B is not the correct answer.
Option C:
The annual percentage growth rate of average wagon capacity in 1999 over 1998 = $$\frac{\left(42.3-40.5\right)}{40.5}\times\ 100= 4.4\%$$
The annual percentage growth rate of average wagon capacity in 2001 over 2000 = $$\frac{\left(45.9-43.8\right)}{43.8}\times\ 100= 4.8\%$$
Since this option is false, this is the correct option.
Thus, the correct answer is C.
Find out the HIGHEST annual growth rate among the following:
Solution
By solving the options ,we can see
A: [(291360-312405)/312405]*100=-6.7%
B:[(71950-75768)/75768]*100=-5%
C:[(9726-10601)/10601]*100=-8.2%
D:[(8907-9612)/9612]*100=-7.3%
Hence B is the correct answer
Answer the questions based on the following graph.

In which year the annual growth rate of total production (of all products) is highest?
Solution
Production in 1991 = 25 + 40 + 91 + 159 = 315
Production in 1992 = 40 + 108 + 107 + 165 = 420
Production in 1993 = 35 + 60 + 62 + 140 = 297
Production in 1994 = 75 + 40 + 131 + 88 = 334
Thus, it is clear that the growth rate was maximum in 1992.
Thus, the correct answer is B.
If the stability of the production during 1990 to 1995 is defined as,
$$\frac{\text{Average Production}}{ \text{Maximum Production}\ -\text{Minimum Production}}$$
then, which product is most stable?
Solution
Stability of Product P = $$\frac{\left(45+25+40+35+75+55\right)}{\left(75-25\right)\times\ 6}=0.91$$
Stability of Product Q = $$\frac{\left(99+40+108+60+40+70\right)}{\left(108-40\right)\times\ 6}=1.02$$
Stability of Product R = $$\frac{\left(72+91+107+62+131+120\right)}{\left(131-62\right)\times\ 6}=1.408$$
Stability of Product S = $$\frac{\left(115+159+165+140+88+98\right)}{\left(165-88\right)\times\ 6}=1.65$$
Thus, the correct option is D.
If four products P, Q, R and S shown in the graph are sold at price of Rs. 9, Rs. 4, Rs.13 and Rs.3 respectively during 1990-1995, then the total revenue of all the products is lowest in which year?
Solution
Revenue of 1991 = $$\left(25\times\ 9\right)+\left(40\times\ 4\right)+\left(91\times13\right)+\left(159\times\ 3\right)=2045$$
Revenue of 1992 = $$\left(40\times\ 9\right)+\left(108\times\ 4\right)+\left(107\times13\right)+\left(165\times\ 3\right)=2678$$
Revenue of 1993 = $$\left(35\times\ 9\right)+\left(60\times\ 4\right)+\left(62\times13\right)+\left(140\times\ 3\right)=1781$$
Thus, the lowest revenue was in 1993.
Thus, the correct option is C.
Individual revenue of P, Q, R and S for the entire period (1990-1995) is calculated based on the price of Rs.9, Rs.4, Rs.13 and Rs.3 respectively. Which product fetches the lowest revenue?
Solution
Total revenue for P = $$\left(40+25+40+35+75+55\right)\times\ 9=2430$$
Total revenue for Q = $$\left(99+40+108+60+40+70\right)\times\ 4=1668$$
Total revenue for R = $$\left(72+91+101+62+131+120\right)\times\ 13=6019$$
Total revenue for S = $$\left(115+159+165+140+88+98\right)\times\ 3=2295$$
Thus, the correct option is B.
Four products P, Q, R and S shown in the graph are sold at price of Rs.9, Rs.4, Rs.13 and Rs.3 respectively during 1990-1995. Which of the following statements is TRUE?
Solution
Let's look at the options one by one ,
Option A: Revenue by products P = 25*9 = 225 , Q = 40*4 = 160 , R = 91*13 = 1183, S = 159*3 = 477
Revenue of R is the highest. Hence A is not the correct answer.
Option B: Revenue by products P = 75*9 = 675, Q = 40*4 = 160 , R = 131*13 = 1703, S = 88*3 = 264
Sum of revenues of P, Q, S =1094
The combined revenue of P, Q, S is less than the revenue from R in 1994.
Hence B is not the correct answer.
Option C: Revenue by products P = 35*9 = 315, Q = 60*4 = 240, R = 62*13 = 806, S = 140*3 = 420
The cumulative revenue of P and Q = 555
The cumulative revenue of P and Q is more than the revenue of S in 1993.
Hence C is the correct answer.
Answer the questions based on the following table.

Mark the HIGHEST FDI inflow growth rate among the following:
Solution
Let's calculate the options one by one,
Option A: Annual FDI inflow growth rate in Gujarat in 2006 = (82793-29648)/29648 = 1.7925
Option B: Annual FDI inflow growth rate in Kerala in 2004 = (199-70)/70 =1.8428
Option C: Annual FDI inflow growth rate in Haryana in 2007 = (16095-5577)/5577=1.8859
Option D: Annual FDI inflow growth rate in Punjab in 2004 = (1747-627)/627 =1.7863
Among all the growth rates, the Annual FDI inflow growth rate in Haryana in 2007 is the highest.
Hence C is the correct answer.
Mark the LOWEST FDI inflow growth rate among the following:
Solution
Let's calculate the options one by one,
Option A: Annual FDI inflow growth rate in West Bengal in 2001 = (2111-6706)/6706 = -0.685
Option B: Annual FDI inflow growth rate in Kerala in 2002 = (197-535)/535 = -0.6317
Option C: Annual FDI inflow growth rate in Maharashtra in 2004= (6909-21440)/21440 = -0.6777
Option D: Annual FDI inflow growth rate in Haryana in 2005. = (2685-8345)/8345=-0.6782
Among the above values, Annual FDI inflow growth rate in West Bengal in 2001 is the lowest.
Hence A is the correct answer.
Mark the TRUE statement:
Solution
Let's solve the options one by one,
Option A: Decline in annual FDI growth rate for Gujarat in 2001 (10889-14193)/14193 =23.3
Decline in annual FDI growth rate for Karnataka in 2005 [(10904-14071)/14071] =22.5
The Decline in Gujarath was greater than that of Karnataka. Hence A is not the correct answer
Option B: Annual growth rate of FDI in Kerala in 2001 = (535-376)/376=42.29
The Annual growth rate of FDI in Uttar Pradesh in 2004 [(3483-2419)/2419]=43.98
The Annual growth rate of FDI in Kerala in 2001 was lesser than that of Uttar Pradesh in 2004. Hence B is not the correct answer
Option C: Annual growth rate of FDI in Kerala in 2005 = (290-199)/199 =45.72
Annual growth rate of FDI in Punjab in 2007 [(9228-6340)/6340] = 45.55
The Annual growth rate of FDI in Kerala is greater than that of Punjab.
Hence C is the correct answer.
Mark the FALSE statement:
Solution
Let's solve the options one by one,
Option A: The absolute annual increase in FDI inflow in Bihar in 2001 (5586-659)=4927
The absolute annual increase in FDI inflow in Rajasthan in 2007 (10034-5077)=4957
Option B: Annual FDI growth rate in West Bengal in 2006 [(12028-13994)/13994]*100=-14%
Annual FDI growth rate in West Bengal in Uttar Pradesh in 2003 [(2419-2899)/2899]*100=-16%
Option C: The absolute annual increase in FDI inflow in Madhya Pradesh in 2004 17761-13891= 3870
The absolute annual increase in FDI inflow in Maharashtra in 2005 10675-6909= 3766
Hence C is the correct answer.
Mark the TRUE statement:
Solution
The absolute annual increase in FDI inflow in Haryana in 2006 is lower than the corresponding figure for Punjab in 2007.
Option (A): The absolute annual increase in FDI inflow for Haryana in 2006 = 2892
The absolute annual increase in FDI inflow for Punjab in 2007 = 2888
Option (B): The absolute annual increase in FDI inflow for MP in 2003 = 11419
The absolute annual increase in FDI inflow for Maharashtra in 20073 = 11660
Option (C): The absolute annual increase in FDI inflow in Bihar in 2003 = 294
The absolute annual increase in FDI inflow for Karnataka in 2001 = 254
We can see that option C is true.
Answer the questions based on the following table.

Mark the LOWEST percentage among the following:
Solution
Let's solve the options one by one,
Option A: Export from Canada expressed as a proportion of export from North America in 2000 = (276635/1224975)*100 = 22.58%
Option B: Export from Germany expressed as a proportion of export from Europe in 2004 = (909887/4051000)*100=22.46%
Option C: Export from China expressed as a proportion of export from Asia in 2004 = (593326/2653100)*100 =22.36%
Option D: Export from Japan expressed as a proportion of export from Asia in 2003 = (471817/2138300)*100=22.06%
Among the above values ,
Export from Japan expressed as a proportion of export from Asia in 2003 is the lowest.
Hence D is the correct answer.
Identify the TRUE statement:
Solution
Let's solve the options one by one,
Option A:Annual export growth rate of Argentina in 2003 [( 29566-25650)/25650]=0.153
Annual export growth rate of US in 2006 [(1038278-905978)/905978]=0.146
The annual export growth rate of Argentina in 2003 is greater than that of US in 2006.
Option B: Annual export growth rate of Africa in 2004 [(229900-176400)/176400]=0.303
The annual export growth rate of Latin America in 2004 [(284700-219100)/219100]=0.299
The annual export growth rate of Africa is greater than that of Latin America in 2004
Option C:Annual export growth rate of US in 2004 [(818520-724771)/724771]=0.129
The annual export growth rate of Canada in 2005 [(359399-316548)/359399]=0.135
The annual export growth rate of US in 2004 is lesser than that of Canada in 2005
Hence C is the correct answer.
Mark the HIGHEST annual growth rate among the following:
Solution
Let's solve the options one by one,
Option A: Annual growth rate of World export in 2005 = (10472000-9210000)/9210000 =0.137
Option B: Annual growth rate of North American export in 2004 = (1324235-1162965)/1162965 =0.138
Option C: Annual growth rate of India’s export in 2002 = (49250-43361)/43361 =0.136
Option D: Annual growth rate of Japan’s export in 2003 = (471817-416726)/416726=0.132
The annual growth rate of North American export in 2004 is the highest.
Hence B is the answer.
Mark the FALSE statement:
Solution
Option (A): The exports from Argentina expressed as a proportion of export from Latin America in 2001 was greater than the exports from Nigeria expressed as a proportion of exports from Africa in 2004.
The exports from Argentina expressed as a proportion of export from Latin America in 2001 = $$\dfrac{26543}{188600}$$ = 0.1407
The exports from Nigeria expressed as a proportion of exports from Africa in 2004 = $$\dfrac{31148}{229900}$$ = 0.135
Option (B): The exports from UK expressed as a proportion of exports from Europe in 2000 is lower than the exports from Argentina expressed as a proportion of exports from Latin America in 2005.
The exports from UK expressed as a proportion of exports from Europe in 2000 = $$\dfrac{285429}{2633930}$$ = 0.108
The exports from Argentina expressed as a proportion of exports from Latin America in 2005 = $$\dfrac{40351}{355000}$$ = 0.114
Option (C): The annual export growth rate of Argentina in 2004 was higher than the corresponding figure for Asia in 2005.
The annual export growth rate of Argentina in 2004 = $$\dfrac{34576-29566}{29566}\times 100$$ = 16.94 %
The annual export growth rate of Asia in 2005 = $$\dfrac{3059000-2653100}{2653100}\times 100$$ = 15.30 %
Option (D): The exports from South Africa in 2001 expressed as a proportion of exports from Africa is lower than the exports from China expressed as a proportion of exports from Asia in 2003.
The exports from South Africa in 2001 expressed as a proportion of exports from Africa = $$\dfrac{29258}{137400}$$ = 0.212
The exports from China expressed as a proportion of exports from Asia in 2003 = $$\dfrac{438228}{2138300}$$ = 0.204
Therefore, option D is the correct answer.
Mark the FALSE statement:
Solution
Let's solve the options one by one,
Option A: Absolute annual increase in exports from Asia in 2003 = (2138300-1807800)/1807800 = 0.183
The absolute annual increase in exports from Asia in 2006 = (3577700-3059000)/3059000 = 0.169
The absolute annual increase in exports from Asia in 2003 is lesser than that of the year 2006.
Option B: Absolute annual increase in exports from Germany in 2001 =(571645-551818)/551818 = 0.036
The absolute annual increase in exports from US in 2003 = (724771-693103)/693103 = 0.046
The absolute annual increase in exports from Germany in 2001 is lesser than that of US in 2003
Option C: Absolute annual increase in exports from Brazil in 2005 (118308-96475)/96475 = 0.226
The absolute annual increase in exports from Japan in 2002 = (416726-403496)/403496 = 0.0328
The absolute annual increase in exports from Brazil is lower than that of Japan in 2002.
Hence B is the answer.
Answer the questions based on the following two graphs, assuming that there is no fixed cost component and all the units produced are sold in the same year.
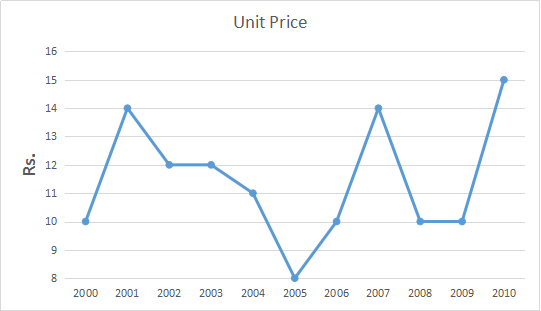
Year wise graph of price of a unit

Year wise graph of revenue and total profit.
In which year per unit cost is HIGHEST?
Solution
Let's calculate No of Units as Revenue / Unit price.
Per Unit cost as (Revenue - Profit ) / No of Units.
In that way, we calculate the table as follows.

It is clear from the table per unit cost in the year 2001 is the highest.
Hence B is the correct answer.
What is the approximate average quantity sold during the period 2000-2010?
Solution
Let's calculate No of Units as Revenue / Unit price.
Per Unit cost as (Revenue - Profit ) / No of Units.
In that way, we calculate the table as follows.
=70+100+100+75+100+50+20+50+60+80+60/11
=69.5
=Approx 70
Hence B is the correct answer.
If volatility of a variable during 2000-2010 is defined as $$\frac{Maximum Value - Minimum Value}{Average Value}$$, then which of the following is TRUE ?
Solution
Let's calculate No of Units as Revenue / Unit price.
Per Unit cost as (Revenue - Profit ) / No of Units.
In that way, we calculate the table as follows.
Let's solve the options one by one,
Option A : Volatility for price per unit : 14-8/11.45 = 0.524
Option B :Volatility for Cost per unit : 13-5/8.91 = 0.898
Option C:Volatility for Total profit : 400-0/154.54 = 2.588
Option D:Volatility for Revenue = 1400-200/809.1 = 1.48
Among the above values ,volatility for total profit is the highest .
Hence C is the correct answer.
If the price per unit decreases by 20% during 2000-2004 and cost per unit increases by 20% during 2005-2010, then during how many number of years there is loss?
Solution
Let's calculate No of Units as Revenue / Unit price.
Per Unit cost as (Revenue - Profit ) / No of Units.
Costs Incurred = Revenue - Profit
If there is a percent 20 % increase in the cost price for year 2005-10 and the 20% decrease in price during 2000-2004.
In that way, we calculate the table as follows.
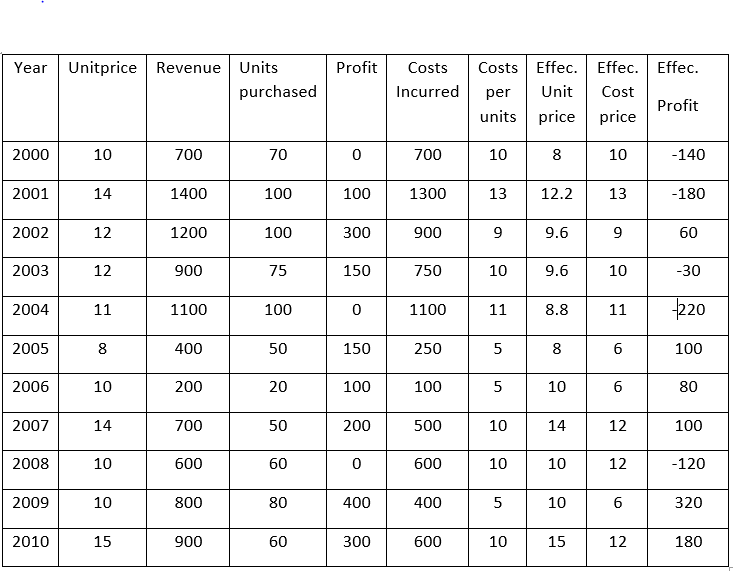
The company will incur a loss if unit price is lesser than unit cost price.
Thus for 2000, 2001, 2003, 2004 and 2008 there will be net loss. For 5 years there was a loss.
Hence C is the correct answer.
If the price per unit decreases by 20% during 2000-2004 and cost per unit increases by 20% during 2005-2010, then the cumulative profit for the entire period 2000-2010 decreases by:
Solution
Let's calculate No of Units as Revenue / Unit price.
Per Unit cost as (Revenue - Profit ) / No of Units.
Costs Incurred = Revenue - Profit
In that way, we calculate the table as follows.
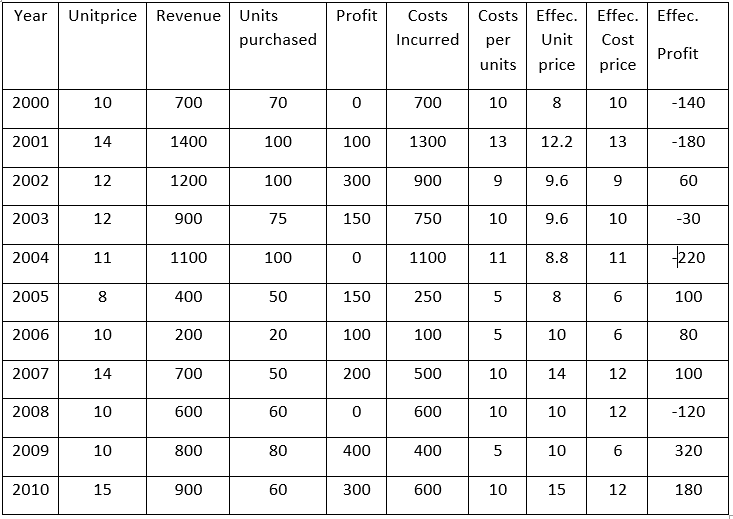
Profit before the changes=1700
Profit after the changes= 150
Cumulative change in the profit = 1550
Hence B is the correct answer.
Read the passage carefully and answer the questions given at the end of each passage:
Turning the business involved more than segmenting and pulling out of retail. It also meant maximizing every strength we had in order to boost our profit margins. In re-examining the direct model, we realized that inventory management was not just core strength; it could be an incredible opportunity for us, and one that had not yet been discovered by any of our competitors.
In Version 1.0 the direct model, we eliminated the reseller, thereby eliminating the mark-up and the cost of maintaining a store. In Version 1.1, we went one step further to reduce inventory inefficiencies. Traditionally, a long chain of partners was involved in getting a product to the customer. Let’s say you have a factory building a PC we’ll call model #4000. The system is then sent to the distributor, which sends it to the warehouse, which sends it to the dealer, who eventually pushes it on to the consumer by advertising, “I’ve got model #4000. Come and buy it.” If the consumer says, “But I want model #8000,” the dealer replies, “Sorry, I only have model #4000.” Meanwhile, the factory keeps building model #4000s and pushing the inventory into the channel.
The result is a glut of model #4000s that nobody wants. Inevitably, someone ends up with too much inventory, and you see big price corrections. The retailer can’t sell it at the suggested retail price, so the manufacturer loses money on price protection (a practice common in our industry of compensating dealers for reductions in suggested selling price). Companies with long, multi-step distribution systems will often fill their distribution channels with products in an attempt to clear out older targets. This dangerous and inefficient practice is called “channel stuffing”. Worst of all, the customer ends up paying for it by purchasing systems that are already out of date
Because we were building directly to fill our customers’ orders, we didn’t have finished goods inventory devaluing on a daily basis. Because we aligned our suppliers to deliver components as we used them, we were able to minimize raw material inventory. Reductions in component costs could be passed on to our customers quickly, which made them happier and improved our competitive advantage. It also allowed us to deliver the latest technology to our customers faster than our competitors.
The direct model turns conventional manufacturing inside out. Conventional manufacturing, because your plant can’t keep going. But if you don’t know what you need to build because of dramatic changes in demand, you run the risk of ending up with terrific amounts of excess and obsolete inventory. That is not the goal. The concept behind the direct model has nothing to do with stockpiling and everything to do with information. The quality of your information is inversely proportional to the amount of assets required, in this case excess inventory. With less information about customer needs, you need massive amounts of inventory. So, if you have great information – that is, you know exactly what people want and how much - you need that much less inventory. Less inventory, of course, corresponds to less inventory depreciation. In the computer industry, component prices are always falling as suppliers introduce faster chips, bigger disk drives and modems with ever-greater bandwidth. Let’s say that Dell has six days of inventory. Compare that to an indirect competitor who has twenty-five days of inventory with another thirty in their distribution channel. That’s a difference of forty-nine days, and in forty-nine days, the cost of materials will decline about 6 percent.
Then there’s the threat of getting stuck with obsolete inventory if you’re caught in a transition to a next- generation product, as we were with those memory chip in 1989. As the product approaches the end of its life, the manufacturer has to worry about whether it has too much in the channel and whether a competitor will dump products, destroying profit margins for everyone. This is a perpetual problem in the computer industry, but with the direct model, we have virtually eliminated it. We know when our customers are ready to move on technologically, and we can get out of the market before its most precarious time. We don’t have to subsidize our losses by charging higher prices for other products.
And ultimately, our customer wins. Optimal inventory management really starts with the design process. You want to design the product so that the entire product supply chain, as well as the manufacturing process, is oriented not just for speed but for what we call velocity. Speed means being fast in the first place. Velocity means squeezing time out of every step in the process.
Inventory velocity has become a passion for us. To achieve maximum velocity, you have to design your products in a way that covers the largest part of the market with the fewest number of parts. For example, you don’t need nine different disk drives when you can serve 98 percent of the market with only four. We also learned to take into account the variability of the lost cost and high cost components. Systems were reconfigured to allow for a greater variety of low-cost parts and a limited variety of expensive parts. The goal was to decrease the number of components to manage, which increased the velocity, which decreased the risk of inventory depreciation, which increased the overall health of our business system.
We were also able to reduce inventory well below the levels anyone thought possible by constantly challenging and surprising ourselves with the result. We had our internal skeptics when we first started pushing for ever-lower levels of inventory. I remember the head of our procurement group telling me that this was like “flying low to the ground 300 knots.” He was worried that we wouldn’t see the trees.
In 1993, we had $2.9 billion in sales and $220 million in inventory. Four years later, we posted $12.3 billion in sales and had inventory of $33 million. We’re now down to six days of inventory and we’re starting to measure it in hours instead of days. Once you reduce your inventory while maintaining your growth rate, a significant amount of risk comes from the transition from one generation of product to the next. Without traditional stockpiles of inventory, it is critical to precisely time the discontinuance of the older product line with the ramp-up in customer demand for the newer one. Since we were introducing new products all the time, it became imperative to avoid the huge drag effect from mistakes made during transitions. E&O; – short for “excess and obsolete” - became taboo at Dell. We would debate about whether our E&O; was 30 or 50 cent per PC. Since anything less than $20 per PC is not bad, when you’re down in the cents range, you’re approaching stellar performance.
Find out the TRUE statement:
Solution
"Inevitably, someone ends up with too much inventory, and you see big price corrections. The retailer can't sell it at the suggested retail price, so the manufacturer loses money on price protection (a practice common in our industry of compensating dealers for reductions in suggested selling price)..."
From the above lines of the third paragraph, it can be inferred that excess production of a product with no backing of demand results in big price corrections. Therefore, Option D is the true statement.
Statements A,B and C are not true statements.
Find out the FALSE statement:
Solution
"Because we were building directly to fill our customers' orders, we didn't have finished goods inventory devaluing on a daily basis."
From the above lines of the passage(fourth paragraph), option A can be inferred.
"The quality of your information is inversely proportional to the amount of assets required, in this case excess inventory"
Option B can be inferred from the above lines of the 5th para.
"As the product approaches the end of its life, the manufacturer has to worry about whether it has too much in the channel and whether a
competitor will dump products, destroying profit margins for everyone"
From the above lines of the 6th paragraph, it can be inferred that a competitor can reduce the price of products to kill the competition. Since there is no such conventional manufacturing system exists that stops this kind of action, option D cannot be inferred from the passage and hence,
The correct option is D.
Choose the option which best matches the following sets:

Solution
Inventory velocity has become a passion for us. Hence, we can say that (1 - iv) is a combination.
It is mentioned in the passage that 'We know when our customers are ready to move on technologically, and we can get out of the market before its most precarious'. Hence, we can say that (4 - i) is a combination. Hence, option C is the correct answer.
Find out the FALSE Statement:
Solution
"Companies with long, multi-step distribution systems will often fill their distribution channels with products in an attempt to clear out
older targets. This dangerous and inefficient practice is called "channel stuffing". Worst of all, the customer ends up paying for it by
purchasing systems that are already out of date"
From the above lines of the third paragraph, it can be inferred that the companies with a long distribution network can fall to the level of dumping their products in an attempt to clear out old targets. Since this also sometimes ends with the customer getting outdated products, option D is not a correct inference drawn from the passage.
Thus, the correct option is D.
Read the passage carefully and answer the questions given at the end of each passage:
My comrade and I had been quartered in Jamaica, and from there we had been drafting off to the British settlement of Belize, lying away west and north of the Mosquito Coast. At Belize there had been great alarm of one cruel gang of pirates (there were always more pirates than enough in those Caribbean Seas), and as they got the better of our English cruisers by running into out-of-the-way creeks and shallows, and taking the land when they were hotly pressed, the governor of Belize had received orders from home to keep a sharp look-out for them along shore. Now, there was an armed sloop came once a year from Port Royal, Jamaica, to the Island, laden with all manner of necessaries to eat, and to drink, and to wear, and to use in various ways; and it was aboard of that sloop which had touched at Belize, that I was standing, leaning over the bulwarks.
The Island was occupied by a very small English colony. It had been given the name of Silver-Store. The reason of its being so called, was, that the English colony owned and worked a silver-mine over on the mainland, in Honduras, and used this Island as a safe and convenient place to store their silver in, until it was annually fetched away by the sloop. It was brought down from the mine to the coast on the backs of mules, attended by friendly local people and guarded by white men; from thence it was conveyed over to Silver-Store, when the weather was fair, in the canoes of that country; from Silver-Store, it was carried to Jamaica by the armed sloop once a-year, as I have already mentioned; from Jamaica, it went, of course, all over the world.
How I came to be aboard the armed sloop is easily told. Four-and-twenty marines under command of a lieutenant - that officer’s name was Linderwood - had been told off at Belize, to proceed to Silver-Store, in aid of boats and seamen stationed there for the chase of the Pirates. The Island was considered a good post of observation against the pirates, both by land and sea; neither the pirate ship nor yet her boats had been seen by any of us, but they had been so much heard of, that the reinforcement was sent. Of that party, I was one. It included a corporal and a sergeant. Charker was corporal, and the sergeant’s name was Drooce. He was the most tyrannical non- commissioned officer in His Majesty’s service.
The night came on, soon after I had had the foregoing words with Charker. All the wonderful bright colours went out of the sea and sky in a few minutes, and all the stars in the Heavens seemed to shine out together, and to look down at themselves in the sea, over one another’s shoulders, millions deep.
Next morning, we cast anchor off the Island. There was a snug harbour within a little reef; there was a sandy beach; there were cocoa-nut trees with high straight stems, quite bare, and foliage at the top like plumes of magnificent green feathers; there were all the objects that are usually seen in those parts, and I am not going to describe them, having something else to tell about.
Great rejoicings, to be sure, were made on our arrival. All the flags in the place were hoisted, all the guns in the place were fired, and all the people in the place came down to look at us. One of the local people had come off outside the reef, to pilot us in, and remained on board after we had let go our anchor.
My officer, Lieutenant Linderwood, was as ill as the captain of the sloop, and was carried ashore, too. They were both young men of about my age, who had been delicate in the West India climate. I thought I was much fitter for the work than they were, and that if all of us had our deserts, I should be both of them rolled into one. (It may be imagined what sort of an officer of marines I should have made, without the power of reading a written order. And as to any knowledge how to command the sloop—Lord! I should have sunk her in a quarter of an hour!) However, such were my reflections; and when we men were ashore and dismissed, I strolled about the place along with Charker, making my observations in a similar spirit.
It was a pretty place: in all its arrangements partly South American and partly English, and very agreeable to look at on that account, being like a bit of home that had got chipped off and had floated away to that spot, accommodating itself to circumstances as it drifted along. The huts of the local people, to the number of five- and-twenty, perhaps, were down by the beach to the left of the anchorage. On the right was a sort of barrack, with a South American Flag and the Union Jack, flying from the same staff, where the little English colony could all come together, if they saw occasion. It was a walled square of building, with a sort of pleasure-ground inside, and inside that again a sunken block like a powder magazine, with a little square trench round it, and steps down to the door.
Charker and I were looking in at the gate, which was not guarded; and I had said to Charker, in reference to the bit like a powder magazine, “That’s where they keep the silver you see;” and Charker had said to me, after thinking it over, “And silver ain’t gold. Is it, Gill?”
Find out the TRUE statement:
Solution
Option A: "At Belize there had been great alarm of one cruel gang of pirates (there were always more pirates than enough in those Caribbean Seas)." From the above lines of the passage, it can be inferred that Belize is itself a Caribbean country. Thus, option A is false.
Option B: From the seventh paragraph, it can be inferred that the author had not much experience with commanding a ship. ("And as to any knowledge how to command the sloop—Lord! I should have sunk her in a quarter of an hour!"). Thus, option B is also false.
Option C: the passage states that Drooce was the most tyrannical non-commissioned officer in His Majesty’s service, not the most authoritarian. The term "tyrannical" suggests a harsh or oppressive style of leadership, which is different from being simply authoritarian.
Option D: "...On the right was a sort of barrack, with a South American Flag and the Union Jack, flying from the same staff, where the little English colony could all come together, if they saw occasion. It was a walled square of building, with a sort of pleasure-ground inside..." From the above lines, it can be inferred that the author comes across a barrack-like structure where English settlers can come together. Therefore, Option D is True
Hence, the correct option is D.
Find out the FALSE statement:
Solution
"...At Belize there had been great alarm of one cruel gang of pirates (therewere always more pirates than enough in those Caribbean Seas), and as they got the better of our English cruisers by running into out-of-the-way creeks and shallows,..."
There is a difference between a fleet and a group of pirates. A fleet means a group of ships sailing together, engaged in the same activity, or under the same ownership, whereas a group can refer to bunch of pirates also, without giving any information on the number of ships.
Also, the author was the part of the ship with less than thirty members. Thus, option C is false.
Options A, B, and D can be inferred from second and third paragraph of the passage. Thus, the correct option is C.
Find out the TRUE Statement:
Solution
"...My officer, Lieutenant Linderwood, was as ill as the captain of the sloop, and was carried ashore, too. They were both young men of about my age, who had been delicate in the West India climate..."
Since the above lines confirm the statement of option D, option D is true according to the passage.
In the first paragraph, it is mentioned that the author was posted in Jamaica, and from there, he sailed to Belize, in the West and North of the Mosquito Coast. Thus option A is false. From the last paragraph, it can be inferred that option B is also false. Also, from the penultimate paragraph, it cannot be assumed that the flags were flying on any port office.
Thus, the correct option is D.
Mark the FALSE statement:
Solution
"...and as they got the better of our English cruisers by running into out-of-the-way creeks and shallows, and taking the land when they were hotly pressed..."
The above lines from the first paragraph substantiate option A. Similarly, option B is supported in the second paragraph. Also, the following lines from the penultimate paragraph substantiate option C.
"It was a pretty place: in all its arrangements partly South American and partly English, and very agreeable to look at on that account, being like a bit of home that had got chipped off and had floated away to that spot, accommodating itself to circumstances as it drifted along."
In the third paragraph, the name of the Seargent was given as Drooce. ("Charker was corporal, and the sergeant's name was Drooce") Nowhere in the passage was Gill referred to as a Seargent. Thus, option D is a false statement.
The correct option is D.
Read the passage carefully and answer the questions given at the end of each passage:
We now come to the second part of our journey under the sea. The first ended with the moving scene in the coral cemetery which left a deep impression on my mind. I could no longer content myself with the theory which satisfied Conseil. That worthy fellow persisted in seeing in the Commander of the Nautilus one of those unknown servants who returns mankind contempt for indifference. For him, he was a misunderstood genius who, tired of earth’s deceptions, had taken refuge in this inaccessible medium, where he might follow his instincts freely. To my mind, this explains but one side of Captain Nemo’s character. Indeed, the mystery of that last night during which we had been chained in prison, the sleep, and the precaution so violently taken by the Captain of snatching from my eyes the glass I had raised to sweep the horizon, the mortal wound of the man, due to an unaccountable shock of the Nautilus, all put me on a new track. No; Captain Nemo was not satisfied with shunning man. His formidable apparatus not only suited his instinct of freedom, but perhaps also the design of some terrible retaliation.
That day, at noon, the second officer came to take the altitude of the sun. I mounted the platform, and watched the operation. As he was taking observations with the sextant, one of the sailors of the Nautilus (the strong man who had accompanied us on our first submarine excursion to the Island of Crespo) came to clean the glasses of the lantern. I examined the fittings of the apparatus, the strength of which was increased a hundredfold by lenticular rings, placed similar to those in a lighthouse, and which projected their brilliance in a horizontal plane. The electric lamp was combined in such a way as to give its most powerful light. Indeed, it was produced in vacuo, which insured both its steadiness and its intensity. This vacuum economized the graphite points between which the luminous arc was developed - an important point of economy for Captain Nemo, who could not easily have replaced them; and under these conditions their waste was imperceptible. When the Nautilus was ready to continue its submarine journey, I went down to the saloon. The panel was closed, and the course marked direct west.
We were furrowing the waters of the Indian Ocean, a vast liquid plain, with a surface of 1,200,000,000 of acres, and whose waters are so clear and transparent that any one leaning over them would turn giddy. The Nautilus usually floated between fifty and a hundred fathoms deep. We went on so for some days. To anyone but myself, who had a great love for the sea, the hours would have seemed long and monotonous; but the daily walks on the platform, when I steeped myself in the reviving air of the ocean, the sight of the rich waters through the windows of the saloon, the books in the library, the compiling of my memoirs, took up all my time, and left me not a moment of ennui or weariness.
From the 21 st to the 23 rd of January the Nautilus went at the rate of two hundred and fifty leagues in twenty- four hours, being five hundred and forty miles, or twenty-two miles an hour. If we recognized so many different varieties of fish, it was because, attracted by the electric light, they tried to follow us; the greater part, however, were soon distanced by our speed, though some kept their place in the waters of the Nautilus for a time. The morning of the 24 th , we observed Keeling Island, a coral formation, planted with magnificent cocos, and which had been visited by Mr. Darwin and Captain Fitzroy. The Nautilus skirted the shores of this desert island for a little distance. Soon Keeling Island disappeared from the horizon, and our course was directed to the north- west in the direction of the Indian Peninsula.
From Keeling Island our course was slower and more variable, often taking us into great depths. Several times they made use of the inclined planes, which certain internal levers placed obliquely to the waterline. I observed that in the upper regions the water was always colder in the high levels than at the surface of the sea. On the 25th of January the ocean was entirely deserted; the Nautilus passed the day on the surface, beating the waves with its powerful screw and making them rebound to a great height. Three parts of this day I spent on the platform. I watched the sea. Nothing on the horizon till about four o’clock then there was a steamer running west on our counter. Her masts were visible for an instant, but she could not see the Nautilus, being too low in the water. I fancied this steamboat belonged to the P.O. Company, which runs from Ceylon to Sydney, touching at King George’s Point and Melbourne.
At five o’clock in the evening, before that fleeting twilight which binds night to day in tropical zones, Conseil and I were astonished by a curious spectacle. It was a shoal of Argonauts travelling along on the surface of the ocean. We could count several hundreds. These graceful molluscs moved backwards by means of their locomotive tube, through which they propelled the water already drawn in. Of their eight tentacles, six were elongated, and stretched out floating on the water, whilst the other two, rolled up flat, were spread to the wing like a light sail. I saw their spiral-shaped and fluted shells, which Cuvier justly compares to an elegant skiff. For nearly an hour the Nautilus floated in the midst of this shoal of molluscs.
The next day, 26 th of January, we cut the equator at the eighty-second meridian and entered the northern hemisphere. During the day a formidable troop of sharks accompanied us. They were “cestracio philippi” sharks, with brown backs and whitish bellies, armed with eleven rows of teeth, their throat being marked with a large black spot surrounded with white like an eye. There were also some Isabella sharks, with rounded snouts marked with dark spots. These powerful creatures often hurled themselves at the windows of the saloon with such violence as to make us feel very insecure. But the Nautilus, accelerating her speed, easily left the most rapid of them behind.
About seven o’clock in the evening, the Nautilus, half- immersed, was sailing in a sea of milk. At first sight the ocean seemed lactified. Was it the effect of the lunar rays? No; for the moon, scarcely two days old, was still lying hidden under the horizon in the rays of the sun. The whole sky, though lit by the sidereal rays, seemed black by contrast with the whiteness of the waters. Conseil could not believe his eyes, and questioned me as to the cause of this strange phenomenon. Happily I was able to answer him.
“It is called a milk sea,” I explained. “A large extent of white waves is often to be seen on the coasts of Amboyna, and in these parts of the sea.” “But, sir,” said Conseil, “can you tell me what causes such an effect? For I suppose the water is not really turned into milk.” “No, my boy; and the whiteness which surprises you is caused only by the presence of myriads of luminous little worm, gelatinous and without colour, of the thickness of a hair, and whose length is not more than seven-thousandths of an inch. These insects adhere to one another sometimes for several leagues.”
“Several leagues!” exclaimed Conseil.
“Yes, my boy; and you need not try to compute the number of these infusoria. You will not be able, for, if I am not mistaken, ships have floated on these milk seas for more than forty miles.”
Towards midnight the sea suddenly resumed its usual colour; but behind us, even to the limits of the horizon, the sky reflected the whitened waves, and for a long time seemed impregnated with the vague glimmerings of an aurora borealis
Find the TRUE Sentence:
Solution
"Indeed, the mystery of that last night during which we had been chained in prison, the sleep, and the precaution so violently taken by the
Captain of snatching from my eyes the glass I had raised to sweep the horizon, the mortal wound of the man, due to an unaccountable shock of the Nautilus, all put me on a new track"
From the last lines of the first paragraph, it can be inferred that there had been instances when the author did not have his way.
Thus, the correct option is B.
Find the FALSE sentence:
Solution
"During the day a formidable troop of sharks accompanied us. They were “cestracio philippi” sharks, with brown backs and whitish bellies, armed with eleven rows of teeth, their throat being marked with a large black spot surrounded with white like an eye. There were also some Isabella sharks..These powerful creatures often hurled themselves at the windows of the saloon with such violence as to make us feel very insecure."
Option A can be inferred from the above lines of the 7th paragraph. Options C and D can be inferred from the fourth paragraph.
There was no mention of any second officer on the 25th of January in the passage. Although the incident mentioned was true, the date mentioned is false.
Thus, the correct option is B.
Match the following:

Solution
It is given that "These graceful molluscs moved backwards by means of their locomotive tube, through which they propelled the water already drawn in. Of their eight tentacles, six were elongated, and stretched out floating on the water, whilst the other two, rolled up flat, were spread to the wing like a light sail." Hence, we can say that (1- ii) is a correct combination.
Sharks and snouts are linked in seventh para. Coral formation with cocos is mentioned in the 4th paragraph.
Insufia being colorless is stated in eleventh para. Hence, option A is the correct answer.
Find the TRUE statement:
Solution
"...I examined the fittings of the apparatus, the strength of which was increased a hundredfold by lenticular rings, placed similar to those in a lighthouse and which projected their brilliance in a horizontal plane. The electric lamp was combined in such a way as to give its most
powerful light. Indeed, it was produced in vacuo, which insured both its steadiness and its intensity..."
From the above lines of the second paragraph, it can be inferred that the electric lamps were very effective in the submarines and were combined in a way to give their most efficient and powerful light.
Thus, the correct option is D.
Find the most appropriate word from the given choices which is described by the meaning provided in the question.
Meaning: a bowl-shaped drinking vessel
Solution
A 'rumble' is a term used to describe a deep, resonant sound.
A 'fracas' is a term used to describe a quarrel.
An 'aquifer' is a term used to describe the underground water or water table.
'Chalice' is a term used to describe a big bowl. Therefore, option D is the right answer.
Meaning: definition of a substance, especially a strong acid; erosive; mordant.
Solution
'Briny' is a term used to describe salty water.
'Puerile' is a term used to describe something that is childish by nature.
'Prophylactic' means to do something as a prevention anticipating something.
'Vitriolic' means acidic or bitter.
Therefore, option A is the right answer.
Meaning: an upward slope or grade (as in a road); rise; raise; climb; upgrade.
Solution
Maelstorm is a term used to describe a violent situation.
Alacrity is a term used to denote eagerness.
Slighting means disparaging.
Acclivity means an upward slope. Therefore, option B is the right answer.
Select the most appropriate word(s) from the given choices to fill the blank(s).
Justice Minister Bola Ige, confronted with the general incivility of local police, placed a ______ on the cads. Said the Hon. Bola Ige, “I pray that God will make big holes in their pockets.”
Solution
We can infer that the Justice is annoyed by the local cops and wishes that they suffer.
Let us evaluate the options.
Plea means to request. The Justice is not placing a request. He is cursing the local cops. Therefore, we can eliminate this option.
Sanction means to place a penalty. From the statement, we can infer that the author is not talking about a legal recourse. We can eliminate option A as well.
Proscription means to prohibit. 'Prohibit' does not fit in well with the context of the given sentence since the Justice did not prohibit the cops from doing something.
Malediction is a term used to indicate a curse. This word fits in the blank given in the sentence. Therefore, option A is the right answer.
I ____i____ that he will pass his exam and get a good job. I will make a ____ii____ .There will be a new government in less than a year.
Solution
The first blank should be filled by a verb since the sentence states that I foretell that he will pass. 'Prophesy' is a verb.
The second blank should be filled by a noun since the term 'make' has been used already. 'Prophecy' is a noun.
Therefore, option B is the right answer.
Imagine an _______ public figure attacked by press and public, who is facing an inquiry into allegations of having obtained money by deception.
Solution
From the given statement, we can infer that the public figure is in a turmoil.
'Endangered' means in grave danger or vulnerable to extinction.
'Engrossed' means to be deeply engaged in something (like in thoughts or reading a book).
We can eliminate these options since they deviate from the main theme of the statement.
'Empowered' means to be in a position of authority.
'Embattled' is a term used to describe someone in a hostile situation.
Between these 2 words, embattled is a better term to be used since it has been given that the person is in turmoil. Therefore, option C is the right answer.
His listeners enjoyed his ____ wit but his victims often _____ at its satire.
Solution
The sentence intends to convey that the person's listeners (or fans) enjoyed his wit but his victims hated the same.
Lugubrious means sad. Trenchant means incisive.
Among lugubrious, bitter and trenchant, trenchant is a better word.
The word that fills the second blank should mean that his victims did not like the satire.
'Wince' is the correct term to be used in this context.
The person discussed makes incisive comments. Though people enjoy it, the victims hate the same. Therefore, option D is the right answer.
In each of the following sentences, part or the entire sentence is underlined. The answer-choices offer four ways of phrasing the underlined part. If you think the original sentence is better than the alternatives, choose 1 which merely repeats the underlined part; otherwise choose one of the alternatives.
Had the President’s Administration not lost the vote on the budget reduction package, his first year in office would have been rated an A.
Solution
Since it is possible to rewrite the sentence by replacing 'his first year in office' with the pronoun 'it', a more concise manner to rephrase the given line will be to write in the manner shown in option B.
Thus, the correct option is B.
The rise in negative attitudes toward foreigners indicate that the country is becoming less tolerant, and therefore that the opportunities are ripe for extremist groups to exploit the illegal immigration problem.
Solution
The subject "The rise" is singular. Therefore, it should be 'indicates'. Hence, option A is not the correct answer.
We can directly rule out option C as it contains 'that' after therefore.
Between option B and D, the former is better as this shows a progressive process. As the period can't be defined. Hence, option B is the correct answer.
This century began with war brewing in Europe, the industrial revolution well- established, and a nascent communication age.
Solution
This question is about the parallelism. The parallel structure ""noun+adjective" has to be maintained across.
war brewing - noun+adjective
industrial revolution well-established - noun+adjective
communication age beginning - noun+adjective
Therefore, option C is the correct answer.
Due to the chemical spill, the commute into the city will be delayed by as much as 2 hours.
Solution
The form of a verb changes depending on whether it refers to an event taking place in the past, present, or future. Since the tense of the statement is future and that of option B is present continuous, option B can be ruled out. In a similar fashion, since the tense of option C is present perfect, option C can also be eliminated.
As the original sentence is better than the alternatives, the correct option is A.
Select the option which is having similar analogy vis-a-vis the analogy given in the question.
TRAVESTY: PARAGON ::
Solution
TRAVESTY is a term used to describe something absurd or distorted.
PARAGON is used to describe a thing or a person that epitomizes a quality.
The given words are opposite in meaning.
Option B:
Disqualification and Ineptitude (lack of ability to do something) cannot be termed as antonyms.
Option C:
A sentinel is a term used to describe a person whose duty is to watch something.
A creed is a term used to describe a system of beliefs, especially religious ones.
The 2 words are unrelated to each other.
Option D:
Conundrum is a term used to describe a difficult problem.
Accountability is expecting a person to be responsible for his actions.
The 2 words are unrelated.
Option A:
Autonomy means to do one's work without taking orders from others.
Subordination means to follow the orders given.
The 2 words are antonyms. Therefore, option A is the right answer.
CONTRITE: OBDURATE ::
Solution
Contrite means to be regret one's action. Obdurate means to refuse to change one's views. The 2 words are antonyms.
Let us evaluate the options.
Option A:
Grievous means to do something bad and severe.
Lamentable is a term used to denote that the action is bad or deplorable.
The 2 words are synonymous.
Option C:
Sophisticated is a term used to describe a high degree of development.
Cultured and sophisticated cannot be termed antonyms.
Option D:
Assenting means to give the nod. Favourable and assenting cannot be termed opposite in meaning.
Option B:
Aphoristic is a term used to describe that the claim is a general truth or widely accepted.
Esoteric is a term used to denote something that is understood by a limited set of people.
The 2 terms are opposite in meaning and hence, option B is the right answer.
PECCADILLO: FLAW ::
Solution
Peccadillo is a term used to describe a minor fault. The given words are synonymous. The second word is a bit severe in degree as compared to the first one.
'Clandestine' means to do something secretly. Clandestine and openness are antonyms. We can eliminate option A.
Forensics is used to refer to the team that preserves evidence and analyzes them. The function of a judiciary is to hear and judge cases. We cannot establish a relationship between the 2 terms.
An invasion means to attack a country from outside. A Putsch is a term used to describe a coup. The 2 terms cannot be said to be synonymous.
A 'nick' is a term used to describe a small cut or a small quantity. A 'score' is a term used to describe a cut or a scratch on the surface. Therefore, option B is the right answer.
MUTTER: INDISTINCT ::
Solution
A mutter is a term used to describe a sound that is barely audible. Indistinct also means the same (i.e, too low in volume to figure out the meaning). The terms given are synonyms.
Define and easy are unrelated terms.
Blunder means to commit a big mistake. Blunder and polished are unrelated terms.
Expedite means to increase the pace of something. Expedite and completed are not related.
Articulate is a term used to describe someone who communicates effectively. Well-spoken also means the same. Articulate and well-spoken are synonyms. Therefore, option C is the right answer.
Select the most OPPOSITE of the given word from the given choices.
REQUIEM
Solution
A requiem is a term used to describe a token of remembrance.
Humility means to be modest of one's achievements.
Prerequisite is a term used to describe the minimum qualification to be fulfilled to be considered eligible for something.
Resolution is a term used to describe a firm belief.
Reign is a term used to describe a period of rule by a King or Monarch.
None of the words given in the options are similar in meaning to requiem. Therefore, option E is the right answer.
ASPERSION
Solution
Aspersion means to tarnish someone's reputation.
Infamy also means the same.
Restriction and tradition are unrelated to the given word.
Obeisance means to show revere someone or to show deferential respect.
As we can see, obeisance and aspersion are opposite in meaning. Hence, option D is the right answer.
STOLIDITY
Solution
Stolidity means to be unmoved or resolute (in a negative sense) without listening to the arguments.
Posterity means 'for the future'.
Proximity is a term used to describe how near a place is with reference to something.
Agility is a term used to describe the ability to move quickly.
Sobriety is a term used to describe the state of being sober or to process thing rationally.
Sobriety is opposite in meaning to stolidity. Therefore, option D is the right answer.
A number of sentences are given below which, when properly sequenced form a COHERENT PARAGRAPH. Choose the most LOGICAL ORDER of sentences from the choices given to construct a COHERENT PARAGRAPH.
I. The economy’s performance in expenditure terms was even poorer with real GDP contracting by 0.6% after a gain of 0.5% in the October-December quarter.
II. On an output basis—the government’s preferred measure because it is less volatile thin expenditure-based GDP—the economy contracted by 0.3% in real terms from the previous quarter.
III. Data from Statistics New Zealand, a government agency, published on June 27th show an almost uniformly abysmal economic performance in January-March 2008.
IV. This was the first contraction since late 2005, made worse by the fact that the previous quarter’s growth rate was revised down from 1% to 0.8%.
Solution
By going option choices we can see that either statement I or III is an opening sentence. But in statement I, it is given that "the economy’s performance in expenditure terms was even poorer with real GDP" i.e. there should be preceding sentence that's the whole reason of comparison.
The contraction that is being talked in statement IV is mentioned in statement II. Hence, we can say that statement II and IV is a mandatory pair. Therefore, we can say that option C is the correct answer.
I. Matti Meri, a teacher-trainer at Helsinki University, was a teacher at the time.
II. By the time comprehensives reached the more populous south, teachers were eager to join in what was clearly a roaring success.
III. “Grammar-school teachers were quite afraid of the reforms,” he recalls.
IV. “They used to teach only one-third of the students. But the comprehensive schools used almost the same curriculum as the grammar schools had—and we discovered that the two- thirds were mostly able to cope with it.”
V. Comprehensive schools were introduced in 1972 in the sparsely populated north, and then over the next four years in the rest of the country.
Solution
Statement I talks about some time frame "at the time". Hence, it can't be an opening sentence. The time frame mentioned in statement I is given in statement V (year 1997) . Therefore, we can say that V, I is a mandatory pair.
“Grammar-school teachers were quite afraid of the reforms,” he recalls. Here, word 'he' refers to Matti Meri, therefore, we can say that statement I and III are mandatory pairs. Therefore, option A is the correct answer.
I. “It is a clear illustration of the major role played by diet and culture on your risk of chronic disorders,” he says.
II. Little is known about its effects, but changing its levels, possibly through diet or with different gut bacteria, might help to control high blood pressure.
III. Chinese and Japanese people are very similar at a genetic level, but Dr Nicholson found big differences in the type and variety of metabolites in their blood and urine.
IV. “Metabolomics can provide very specific pointers as to what is going wrong and new ways of intervening.”
V. For instance, he found an unexpected metabolic marker, called formate that seems to have a role in regulating blood pressure.
Solution
Statement II can't be the opening statement as "its effects" refers to something. Therefore, we can say that sentence III is the opening statement.
Statement I and IV are spoken by the same person (Dr Nicholson). Therefore, they should be together.
The metabolic marker which is mentioned in the statement V is introduced in statement IV. Hence, we can say that IV and V is a mandatory pair.
Hence, we can say that option D is the correct answer.
For the following questions answer them individually
There are four sentences S1, S2, S3, S4 where the underlined word is used either correctly or incorrectly. Choose the option which lists the sentences, where the underlined word is used correctly.
S1. Only 22% of the people voted. The rest were totally disinterested.
S2. The management and the union asked a completely disinterested party to mediate between them.
S3. I don’t know why he didn’t go to the exhibition. Perhaps he was too busy or just disinterested.
S4. France’s intervention in the dispute was not entirely disinterested. It gave her increased power and influence in the area.
Solution
'disinterested' here means 'not interested' in an unbiased manner. So we have to identify sentences where the context meaning is unbiased.
In sentence 2, the third party mediate will be disinterested.
In sentence 4, the author wants to highlight the point that France’s intervention in the dispute was not entirely disinterested. I.e. this is also a correct option choice.
Hence, option D is the correct answer.
There are four sentences S1, S2, S3, S4 where the underlined phrase is used either correctly or incorrectly. Choose the option which lists the sentences, where the underlined phrase is used correctly.
S1. Good Lord, I’m not rich! on the contrary, I’m constantly in debt.
S2. She’s very intelligent, but on the contrary she’s apt to be impatient.
S3. Yes, it’s a very cosmopolitan city. On the contrary, it’s very expensive.
S4. I don’t think he’ll pass the exam. On the contrary, I think he’ll almost certainly fail.
Solution
'On the contrary' is used in a sentence to put forth an opposite argument of fact.
Statement 1: Since the statement presents opposite scenarios, 'on the contrary' is used appropriately.
Statement 2: Here, the usage of 'but' has made the usage of 'on the contrary' redundant. Thus, this is a wrong statement.
Statement 3: As there is no contrast in the two lines, 'on the contrary' should not be used here. Thus, this is a wrong statement.
Statement 4: Since the statement presents opposite scenarios, 'on the contrary' is used in an appropriate manner.
Thus, the correct option is C.
Which of the following country is not a member of G8 group of countries?
Solution
G8 group of countries: France, Germany, Italy, Japan, the United Kingdom, and the United States, Canada and Russia.
Hence, option B is the correct answer.
Which prominent intergovernmental organization launched the movement, ‘Education For All’ (EFA):
Solution
Education For All (EFA) is a global movement led by UNESCO (United Nation Educational, Scientific and Cultural Organization), aiming to meet the learning needs of all children, youth and adults by 2015.
Which of the following country is a member of OECD group?
Solution
The Organisation for Economic Co-operation and Development is an intergovernmental economic organisation with 36 member countries, founded in 1961 to stimulate economic progress and world trade. It is a forum of countries describing themselves as committed to democracy and the market economy, providing a platform to compare policy experiences, seeking answers to common problems, identify good practices and coordinate domestic and international policies of its members.
Mexico is a member of OECD group.
Select the correct Year - Olympic host cities
match:

Solution
1964 - Tokyo
1976 - Montreal
1992 - Barcelona
2012 - London
Select the correct IPL Franchise - Owner match:

Solution
Mumbai Indians: Founded in 2008, Mumbai Indians play in the Indian Premier League (IPL). The team is owned by India's biggest conglomerate, Reliance Industries, through its 100% subsidiary IndiaWin Sports.
Royal Challengers: Royal Challenger Banglore is currently owned by United Breweries Group.
Chennai Super Kings: India Cements acquired the rights to the franchise for 10 years. Former ICC Chairman N. Srinivasanwas the de facto owner of the Chennai Super Kings, by means of his position as the vice-chairman and managing director of India Cements Ltd.
The Delhi Daredevils (often abbreviated as DD) are a franchise cricket team representing the city of Delhi in the Indian Premier League (IPL). Founded in 2008 one of the eight founding teams of the IPL, the Delhi franchise is owned by the GMR Group and JSW Group.
Which of the following country is not a member of Nuclear Suppliers Group?
Solution
Albania is not a member of Nuclear Suppliers Group (NSG).
Select the correct Bharat Ratna recipient-Year match:

Solution
Pandit Ravi Shanker was awarded by Bharat Ratna in 1999.
Ustad Bismillah Khan was awarded by Bharat Ratna in 2001.
M S Subbulakshmi was awarded by Bharat Ratna in 1998.
Satyajit Ray was awarded by Bharat Ratna in 1992.
Therefore, option A is the correct answer.
Select the match:

Solution
Nigeria's currency is Naira. The Benue River, previously known as the Chadda River or Tchadda, is the major tributary of the Niger River. The river is approximately 1,400 kilometres long and is almost entirely navigable during the summer months. As a result, it is an important transportation route in the regions through which it flows. Hence, option A is a correct match.
South Korea's currency is South Korean won. The Nakdong River or Nakdonggang is the longest river in South Korea, and passes through major cities such as Daegu and Busan. Hence, option B is a correct match.
Colombia's currency is Colombian peso. The Magdalena River is the principal river of Colombia, flowing northward about 1,528 kilometres through the western half of the country. Hence, option C is a correct match.
Malaysia's currency is Malaysian ringgit. The Xiuguluan River is a river in southeastern Taiwan. Hence, this is an incorrect match. Moreover, River's name is written incorrectly.
Select the WRONG International Organization - Location of Headquarter - Country match:

Solution
International Atomic Energy Agency - Vienna, Austria
World Health Organization (WHO) - Geneva, Switzerland
International Monetary Fund (IMF) - Washington DC, US
International Court of Justice - The Hague, The Netherland
Select the WRONG Venue of Hockey World Cup - Year - Winner match:

Solution
1975 - Kuala Lumpur, Malaysia - India
1986 - London, England - Australia
1994 - Sydney, Australia - Pakistan
2006 - Mönchengladbach, Germany - Germany
Hence, we can say that option C is the correct answer.
Select the WRONG Book - Author match:
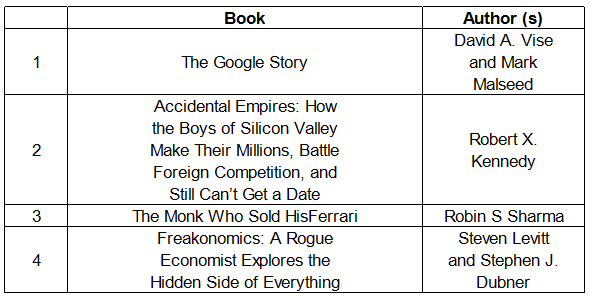
Solution
The Google Story is a book by David Vise and Mark Malseed that takes an in-depth look who founded the company and why it is unique.
Accidental Empires: How the Boys of Silicon Valley Make Their Millions, Battle Foreign Competition, and Still Can't Get a Date (1992, 1996), is a book written by Mark Stephens under the pen name Robert X. Cringely about the founding of the personal computer industry and the history of Silicon Valley.
The Monk Who Sold His Ferrari is a self-help book by Robin Sharma, a writer and motivational speaker. The book is a business fable derived from Sharma's personal experiences after leaving his career as a litigation lawyer at the age of 25.
Freakonomics: A Rogue Economist Explores the Hidden Side of Everything is the debut non-fiction book by University of Chicago economist Steven Levitt and New York Times journalist Stephen J. Dubner.
Hence, option B is the correct answer.
Select the WRONG Country - Name of Parliament match:

Solution
The Islamic Consultative Assembly, also called the Iranian Parliament, the Iranian Majlis, is the national legislative body of Iran.
The Storting is the supreme legislature of Norway, established in 1814 by the Constitution of Norway. It is located in Oslo.
The National Assembly of Tanzania (Swahili: Bunge la Tanzania) and the President of the United Republic make up the Parliament of Tanzania. The current Speaker of the National Assembly is Job Ndugai, who presides over a unicameral assembly of 393 members.
Knesset, (Hebrew: “Assembly”) unicameral parliament of Israel and supreme authority of that state. On Feb. 16, 1949, the Constituent Assembly—elected in January of that year to prepare the country's constitution—ratified the Transition Law and reconstituted itself as the First Knesset.
Hence, we can say that Row 2 is an incorrect match.
Which of the following books has been authored by P. Chidambaram?
Solution
A View from the Outside: Why Good Economics Works for Everyone is written by P. Chidambaram.
Which of the treaty was signed amongst the European nations for entering into the monetary union?
Solution
The Maastricht Treaty was approved by heads of government of the states making up the European Community (EC) in December 1991. The treaty required voters in each country to approve the European Union, which proved to be a hotly debated topic in many areas. The agreement took ended with the creation of the European Union and has since been amended by other treaties. The Maastricht Treaty was signed on February 7, 1992, by the leaders of 12 member nations (Belgium, Italy, Luxembourg, France, Netherlands, West Germany, Denmark, Ireland, United Kingdom, Greece, Portugal and Spain). The treaty entered into force November 1, 1993.
Which of the following Indian automobile major has a tie-up with a German insurer?
Solution
Bajaj Allianz General Insurance Company Limited is a joint venture between Bajaj Auto Limited and Allianz AG of Germany. Incorporated on September 19, 2000, Bajaj Allianz General Insurance Company received the Insurance Regulatory and Development Authority certificate of Registration on May 2, 2001 to conduct general insurance business (including health insurance business) in India. The company has an authorised and paid up capital of Rs 110 crores.
Which Indian company has acquired General Chemical Industrial Products Inc. of USA in 2008?
Solution
Tata Chemicals (TCL), part of the Tata group, has entered into definitive agreements to acquire the soda ash business of General Chemical Industrial Products Inc (GCIP), a US based chemical company, for US$1,005 million. Harbinger Capital Partners is GCIP's majority shareholder. The transaction is subject to shareholder and regulatory approvals.
GCIP's subsidiary, General Chemical (soda ash) Partners (GCSAP), is a significant soda ash producer in the US with a capacity of 2.5 million tpa of natural soda ash. GCSAP has mining and manufacturing facilities located at Green River Basin in Wyoming, USA, which provides it access to the world's largest and most economically recoverable trona ore deposits that is then converted into soda ash.
Which of the following is not part of the Central Police Forces under the Union Government of India?
In descending order, which of the following group of countries is correct about the length of India’s land borders with its neighbors?
Solution
Bangladesh border : 4096 km
China border : 4057 km
Pakistan border : 3323 km
Nepal border : 1751 km
Myanmar border : 1643 km
Hence, option D is the correct answer.
Chronologically which one of the following is correct?
Solution
(I) International Atomic Energy Agency set up = 29 July 1957
(2) France conducts first nuclear test = 13 February 1960
(3) China conducts its first nuclear test = 16 October 1964
Hence, option C is the correct answer.
Which of the following mountain peak is not located in India?
Solution
The Dhaulagiri massif in Nepal extends 120 km (70 mi) from the Kaligandaki River west to the Bheri. This massif is bounded on the north and southwest by tributaries of the Bheri River and on the southeast by Myagdi Khola. Dhaulagiri I is the seventh highest mountain in the world at 8,167 metres (26,795 ft) above sea level, and the highest mountain within the borders of a single country (Nepal). It was first climbed on May 13, 1960 by a Swiss/Austrian/Nepali expedition.
Select the correct Organization — Purpose
match:
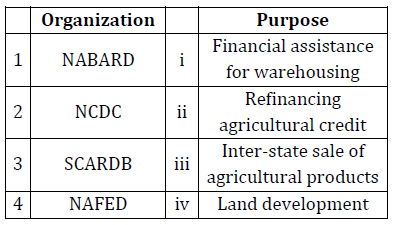
Solution
NABARD - NABARD role in rural development in India is phenomenal. National Bank For Agriculture & Rural Development (NABARD) is set up as an apex Development Bank by the Government of India with a mandate for facilitating credit flow for promotion and development of agriculture, cottage and village industries.
NCDC - Planning, promoting and financing programmes for production, processing, marketing, storage, export and import of agricultural produce, food stuffs, certain other notified commodities e.g. fertilisers, insecticides, agricultural machinery, lac, soap, kerosene oil, textile, rubber etc., supply of consumer goods and collection, processing, marketing, storage and export of minor forest produce through cooperatives, besides income generating stream of activities such as poultry, dairy, fishery, sericulture, handloom etc.
Loans and grants are advanced to State Governments for financing primary and secondary level cooperative societies and direct to the national level and other societies having objects extending beyond one State. Now, the Corporation can also go in for direct funding of projects under its various schemes of assistance on fulfillment of stipulated conditions.
SCARDB - State Cooperative Agriculture and Rural Development Banks (SCARDB) is a Central Sector Scheme of India which aims at raising resources of SLDBs(State Land Development Banks ) for long term lending to cultivators by way of floatation of debentures in vital areas such as Minor Irrigation, Farm Mechanization, Land Development, Horticulture, Wasteland Development, Rural Housing, Rural Godowns, Non-Farm Sector and Animal Husbandry. Under this scheme the SLDBs/SCARDBs raise resources for long term lending to cultivators by floatation of debentures in vital areas like Farm Mechanisation, Land Development etc. The debentures floated by the Banks are subscribed by NABARD, the concerned State Governments, Government of India and other financial institutions.
NAFED : The objective of NAFED is to organize, promote and develop marketing, processing, storage of agricultural, horticultural and forest produce, import and export of agricultural commodities to augment the supplies in domestic market.
Therefore, option A is the correct answer.
In descending order, which one of the following is the correct sex ratio of states in India?
Solution
Kerala - 1084
Chhattisgarh - 991
Andhra Pradesh - 993
Orissa - 979
Tamil Nadu - 996
Therefore, option A is the correct answer.
Select the correct Artists — Instruments match:

Solution
N. Rajam (born 1938) is an Indian violinist who performs Hindustani classical music.
Satish Vyas is an Indian santoor player. He is the son of the Indian classical singer C. R. Vyas. From 1978 he studied santoor with Shivkumar Sharma.
Ustad Vilayat Khan was an Indian classical sitar player. Along with Imdad Khan, Enayat Khan, and Imrat Khan, he is credited with the creation and development of gayaki ang on the sitar.
Asad Ali Khan was an Indian musician who played the plucked string instrument rudra veena. Khan performed in the style dhrupad and was described as the best living rudra veena player in India by The Hindu.
Hence, option B is the correct answer.
Select the correct Sobriquets — Primary Names
match:

Solution
It is easy to see from this true-color image why Ireland is called the "Emerald Island". Intense green vegetation, primarily grassland, covers most of the country except for the exposed rock on mountaintops. Ireland owes its greenness to moderate temperatures and moist air.
Bhutan is called Druk Yul - Land of Thunderbolt. Because of the violent and large thunderstorms that whip down through the valleys from the Himalayas, Bhutan is known as the Land of Thunderbolt. T
Bahrain is also known as the "Island of pearls".
Hold land is associated with Palestine. Hence, option C is the correct answer.
Which of the following is an incorrect Award - Person match?
Solution
Indra Nooyi received Padma Bhusan. She didn't receive Padma Shri.
The antibiotic penicillin is obtained from:
Select the correct Railway Zone — Head Quarter
match: Table

Solution
South East Central Railway zone. The South East Central Railway (abbreviated SECR and दपूमरे) is one of the seventeen railway zones in India. It is headquartered at Bilaspur and comprises the Bilaspur and Nagpur divisions (formerly part of the South Eastern Railway) and the new Raipur division.
The Northeast Frontier Railway (abbreviated NFR and पूसीरे), is one of the 17 railway zones in India. Headquartered in Maligaon, Guwahati in the state of Assam, it is responsible for rail operations in the entire Northeast and parts of West Bengal and Bihar.
The North Eastern Railway (abbreviated NER and पूर्वोत्तर रेलवे) is one of the 16 railway zones in India. It is headquartered at Gorakhpur and comprises Lucknow, Varanasi and Izzatnagar or Bareilly division.
The West Central Railway (abbreviated WCR and पमरे), one of the 16 zones of the Indian Railways, came into existence on 1 April 2003. It is headquartered at Jabalpur.
Select the correct Inventions/Discoveries — Inventors/ Discoverers match:
Solution
Sir Ian Wilmut, is an English embryologist and Chair of the Scottish Centre for Regenerative Medicine at the University of Edinburgh. He is best known as the leader of the research group that in 1996 first cloned a mammal from an adult somatic cell, a Finnish Dorset lamb named Dolly.
J.H. Van Tassel invented Super computer. Cassette (Audio) was invented by Phillips Co. HIV was discovered by Mortagnier. Hence, option A is the correct answer.
Select the correct Diseases — Plants affected match:
Solution
Black heart is a non-parasitic disease of the fruit of cultivated plants, such as potatoes, that causes them to rot from the inside. External signs of the disease may or may not be present. The internal blackening develops in plants exposed to environmental pathology such as drought conditions or poor soil.
Red rot is a very serious disease of sugarcane. It was first described by Went in 1893 (56). Since then it has been found to cause epiphytotics in different countries. The surest symptom of the disease is the reddening of the internal inter nodal tissues with crossbars of white patches in the reddened area. This red colour is caused by a dye which is secreted by the host and is antagonistic to the red rot fungus.
Karnal bunt (also known as partial bunt) is a fungal disease of wheat, durum wheat, and triticale. The smut fungus Tilletia indica, a basidiomycete, invades the kernels and obtains nutrients from the endosperm, leaving behind waste products with a disagreeable odor that makes bunted kernels too unpalatable for use in flour or pasta.
Powdery mildew can be a serious disease of field peas. It occurs sporadically when warm humid conditions favour its growth late in the season. Seed from infected pods can be discoloured and less palatable, which reduces its market value.
Hence, option B is the correct answer.
In April 2008 ISRO launched the following satellite form Sriharikota:
Solution
Kitsat-3 was a South Korean remote sensing minisatellite which carried MEIS and SENSE instruments to Low Earth orbit. Launched on 26 May 1999 by Indian space agency ISRO, on orbit the satellite was renamed to Uribyol 3.
Earth observation satellite CARTOSAT-2A was launched from the Satish Dhawan Space Centre (SDSC), Sriharikota (SHAR) in India on 28 April 2008.
HAMSAT was launched by PSLV-C6 on May 5, 2005. The main payload was an Indian Remote Sensing satellite, CARTOSAT-1 weighing 1,560 kilograms (3,440 lb). HAMSAT was placed into a polar sun synchronous orbit.
INSAT-4CR is a communications satellite operated by ISRO as part of the Indian National Satellite System. Launched in September 2007, it replaced the INSAT-4C satellite which had been lost in a launch failure the previous year.

