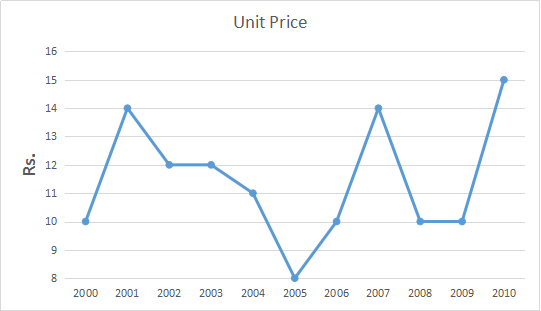
Answer the questions based on the following two graphs, assuming that there is no fixed cost component and all the units produced are sold in the same year.

Year wise graph of price of a unit

Year wise graph of revenue and total profit.
Solution
Let's calculate No of Units as Revenue / Unit price.
Per Unit cost as (Revenue - Profit ) / No of Units.
In that way, we calculate the table as follows.

=70+100+100+75+100+50+20+50+60+80+60/11
=69.5
=Approx 70
Hence B is the correct answer.
Create a FREE account and get:
- All Quant Formulas and shortcuts PDF
- 170+ previous papers with solutions PDF
- Top 5000+ MBA exam Solved Questions for Free

