Answer the questions based on the following two graphs, assuming that there is no fixed cost component and all the units produced are sold in the same year.
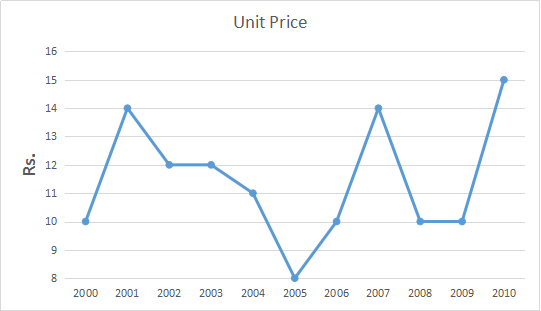
Year wise graph of price of a unit

Year wise graph of revenue and total profit.
If volatility of a variable during 2000-2010 is defined as $$\frac{Maximum Value - Minimum Value}{Average Value}$$, then which of the following is TRUE ?
Solution
Let's calculate No of Units as Revenue / Unit price.
Per Unit cost as (Revenue - Profit ) / No of Units.
In that way, we calculate the table as follows.

Let's solve the options one by one,
Option A : Volatility for price per unit : 14-8/11.45 = 0.524
Option B :Volatility for Cost per unit : 13-5/8.91 = 0.898
Option C:Volatility for Total profit : 400-0/154.54 = 2.588
Option D:Volatility for Revenue = 1400-200/809.1 = 1.48
Among the above values ,volatility for total profit is the highest .
Hence C is the correct answer.
Get AI Help
Create a FREE account and get:
- All Quant Formulas and shortcuts PDF
- 170+ previous papers with solutions PDF
- Top 5000+ MBA exam Solved Questions for Free

IIFT Quant Questions | IIFT Quantitative Ability
IIFT DILR Questions | LRDI Questions For IIFT
IIFT Verbal Ability Questions | VARC Questions For IIFT
Free IIFT DILR Questions
Book Free CAT Mentorship
Get personalized CAT strategy from a 99%iler
500+ students mentored
OTP Verification
Enter the 6-digit code sent to your phone
Booking Summary
Enter OTP
Didn't receive the OTP?


