Sign in
Please select an account to continue using cracku.in
↓ →
Join Our JEE Preparation Group
Prep with like-minded aspirants; Get access to free daily tests and study material.
Answer the questions based on the following two graphs, assuming that there is no fixed cost component and all the units produced are sold in the same year.
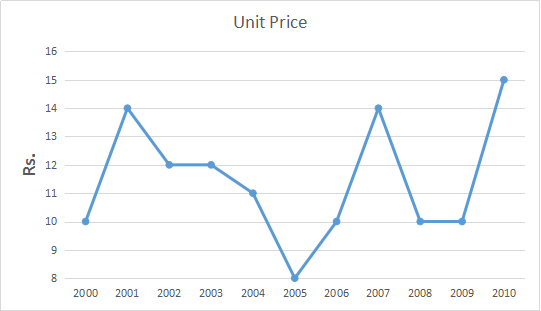

Year wise graph of revenue and total profit.
If the price per unit decreases by 20% during 2000-2004 and cost per unit increases by 20% during 2005-2010, then during how many number of years there is loss?
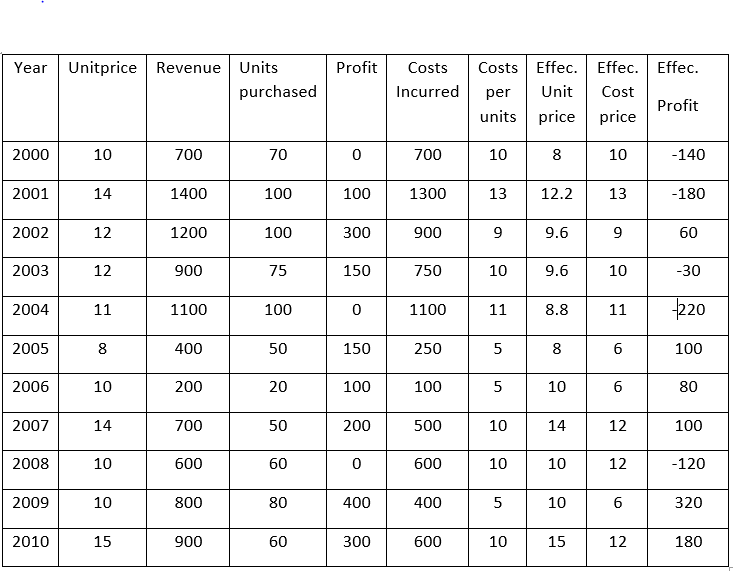
Let's calculate No of Units as Revenue / Unit price.
Per Unit cost as (Revenue - Profit ) / No of Units.
Costs Incurred = Revenue - Profit
If there is a percent 20 % increase in the cost price for year 2005-10 and the 20% decrease in price during 2000-2004.
In that way, we calculate the table as follows.
The company will incur a loss if unit price is lesser than unit cost price.
Thus for 2000, 2001, 2003, 2004 and 2008 there will be net loss. For 5 years there was a loss.
Hence C is the correct answer.
Create a FREE account and get:
Book Free CAT Mentorship
Get personalized CAT strategy from a 99%iler
500+ students mentored
OTP Verification
Enter the 6-digit code sent to your phone
Booking Summary
Enter OTP
Didn't receive the OTP?
Predict your JEE Main percentile, rank & performance in seconds

Educational materials for CAT preparation

Ask our AI anything

AI can make mistakes. Please verify important information.
AI can make mistakes. Please verify important information.