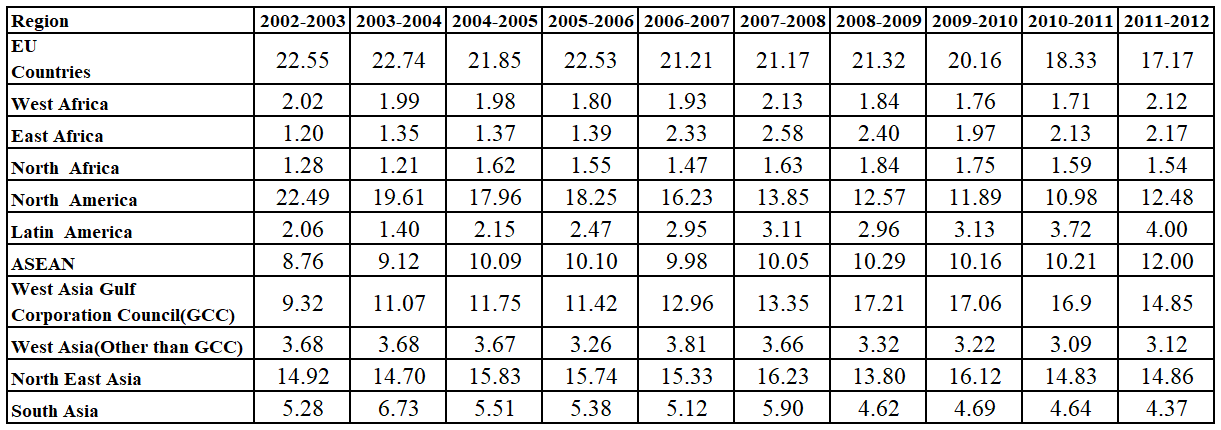
Given below are the shares of India’s export basket to different regions (figures in percentage). Answer the questions on the basis of following data.
Solution
India’s simple average export share to North Africa during 2008-09 and 2009-10 = $$\dfrac{1.89+1.75}{2} = 1.795$$
India’s simple average export share to East Africa during 2004-05 and 2007-08 = $$\dfrac{1.37+2.58}{2} = 1.975$$
India’s simple average export share to Latin America during 2002-03 and 2004-05 = $$\dfrac{2.06+2.15}{2} = 2.105$$
India’s simple average export share to West Africa during 2007-08 and 20010-11 = $$\dfrac{2.13+1.71}{2} = 1.92$$
Clearly, India’s simple average export share to East Africa during 2004-05 and 2007-08 is the highest among the given options.
Hence, option C is the correct answer.
Get AI Help
Create a FREE account and get:
- All Quant Formulas and shortcuts PDF
- 170+ previous papers with solutions PDF
- Top 5000+ MBA exam Solved Questions for Free

IIFT Quant Questions | IIFT Quantitative Ability
IIFT DILR Questions | LRDI Questions For IIFT
IIFT Verbal Ability Questions | VARC Questions For IIFT
Free IIFT DILR Questions
Book Free CAT Mentorship
Get personalized CAT strategy from a 99%iler
500+ students mentored
OTP Verification
Enter the 6-digit code sent to your phone
Booking Summary
Enter OTP
Didn't receive the OTP?


