Assume that only one client's order can be processed at any given point of time. So, Anish or Bani cannot start preparing a new order while a previous order is being prepared.
At what time is the order placed by Client 1 completely served?
Sign in
Please select an account to continue using cracku.in
↓ →
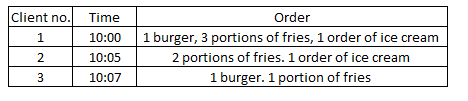
Healthy Bites is a fastfood joint serving three items, burgers, fries and ice cream. It has two employees Anish and Bani who prepare the items ordered by the clients. Preparation time is 10 minutes for a burger and 2 minutes for an order of Ice cream. An employee can prepare only one of these items at a time. The fries are prepared in an automatic fryer which can prepare upto to 3 portions of fries at a time, and takes 5 minutes irrespective of the number of portions. The fryer does not need an employee to constantly attend to it, and we can ignore the time taken by an employee to start and stop the fryer; thus, an employee can be engaged in preparing other items while the frying is on. However fries cannot be prepared in anticipation of future orders.
Healthy Bites wishes to serve the orders as early as possible. The individual items in any order are served as and when ready; however,the order is considered to be completely served only when all the items of that order are served.
The table below gives the orders of three clients and the times at which they placed their orders:
Assume that only one client's order can be processed at any given point of time. So, Anish or Bani cannot start preparing a new order while a previous order is being prepared.
At what time is the order placed by Client 1 completely served?
It is given that
1 burger takes 10 minutes
1 ice cream takes 2 minutes and 3 portions of fries take 5 min by the machine (operator is not required).
Client 1 ordered 1 burger, 3 portions of fries and 1 ice cream.
The burger will take 10 minutes to finish. Meantime, rest of the order can be completed.
Assume that only one client's order can be processed at any given point of time. So, Anish or Bani cannot start preparing a new order while a previous order is being prepared.
At what time is the order placed by Client 3 completely served?
It is given that
1 burger takes 10 minutes
1 ice cream takes 2 minutes and 3 portions of fries take 5 min by the machine (operator is not required).
Anish or Bani cannot start preparing a new order while a previous order is being prepared.
The first order will be completely done at 10:10.
The second order is two fries and one ice cream, which will be done by 10:15.
The third order is one 1 burger and 1 portion of fries.
The burger will take 10 minutes, by which fries will be ready.
Thus, the third order will be completed by 10:25.
Suppose the employees are allowed to process multiple orders at a time, but the preference would be to finish orders of clients who placed their orders earlier.
At what time is the order placed by Client 2 completely served?
It is given that
1 burger takes 10 minutes
1 ice cream takes 2 minutes and 3 portions of fries take 5 min by the machine (operator is not required).
The employees are allowed to process multiple orders at a time, but the preference would be to finish orders of clients who placed their orders earlier.
The first order is 1 burger, 1 ice cream and 3 portions of fries.
Anish can start working on the burger and Bani can start working on the ice cream for the first client at 10:00.
The burger will be done at 10:10, ice - cream at 10:02 and fries at 10:05.
The second order is placed at 10:05. (ice cream and fries)
Bani can work on the ice cream for the second client at 10:05 and also put the fries.
The ice cream will be done by 10:07 but the fries will be done by 10:10.
Thus, order will be completed by 10:10.
Suppose the employees are allowed to process multiple orders at a time, but the preference would be to finish orders of clients who placed their orders earlier.
Also assume that the fourth client came in only at 10:35. Between 10:00 and 10:30, for how many minutes is exactly one of the employees idle?
It is given that
1 burger takes 10 minutes
1 ice cream takes 2 minutes and 3 portions of fries take 5 min by the machine (operator is not required).
The employees are allowed to process multiple orders at a time, but the preference would be to finish orders of clients who placed their orders earlier.
The first order is 1 burger, 1 ice cream and 3 portions of fries.
Anish can start working on the burger and Bani can start working on the ice cream.
The burger will be done at 10:10, ice - cream at 10:02 and fries at 10:05.
The second order is placed at 10:05. (ice cream and fries)
Bani can work on the ice cream from 10:05 and also put the fries.
Only Bani will be free from 10:02 to 10:05 - 3 minutes.
The ice cream will be done by 10:07 but the fries will be done by 10:10.
Third order of 1 burger and 1 fries is placed at 10:07.
Bani will immediately start working on the burger. He will finish it by 10:17.
Anish would have finished the first burger at 10:10. Only he is free till 10:17 - 7 minutes.
Thus exactly one person is free for 10 minutes.
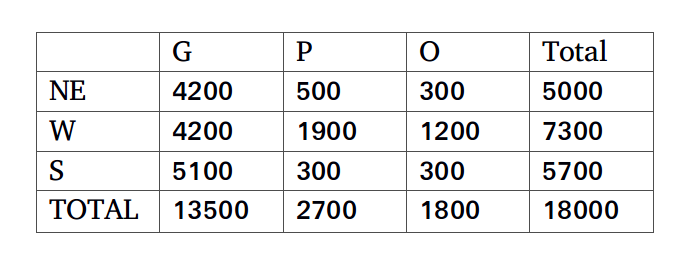
A study to look at the early learning of rural kids was carried out in a number of villages spanning three states, chosen from the North East (NE), the West (W) and the South (S). 50 four-year old kids each were sampled from each of the 150 villages from NE, 250 villages from W and 200 villages from S. It was found that of the 30000 surveyed kids 55% studied in primary schools run by government (G), 37% in private schools (P) while the remaining 8% did not go to school (O).
The kids surveyed were further divided into two groups based on whether their mothers dropped out of school before completing primary education or not.. The table below gives the number of kids in different types of schools for mothers who dropped out of school before completing primary education:
It is also known that:
1. In S, 60% of the surveyed kids were in G. Moreover, In S, all surveyed kids whose mothers had completed primary education were in school.
2. In NE, among the O kids, 50% had mothers who had dropped out before completing primary education.
3. The number of kids in G in NE was the same as the number of kids in G in W.
What percentage of kids from S were studying in P?
Let us make note of the information given in the set.
The set states that rural kids were surveyed from 3 regions NE, West and South.
50 students each were surveyed from 150 villages in the NE, 250 villages from the West and 200 villages from the South.
Total number of kids from the NE = 150*50 = 7500
Total number of kids from the West = 250*50 = 12500
Total number of kids from the South = 200*50 = 10,000.
The table, given in the question, gives the number of students whose mothers dropped out before completing primary education. Therefore, the mothers of the remaining students should have completed primary education.
There are 7500 students from the NE in total. The mothers of 5000 of those students dropped out before completing primary education. Therefore, the remaining 2500 kids should have mothers who have completed primary education.
Let us make 2 tables - one representing the number of students and the other representing the number of students whose mother has completed primary education.
55% of the surveyed kids studied in schools run by the Government.
Number of kids studying in Govt. School should be 0.55*30000 = 16,500
From the given table, we know that the mothers of 13,500 kids who went to Govt. Schools dropped out of primary school.
Therefore, the remaining 16,500 - 13,500 = 3000 kids should have mother who have completed primary school.
37% of the surveyed kids study in private schools.
Number of kids studying in private schools should be 0.37*30000 = 11,100.
Number of kids in private schools whose mothers have completed primary school = 11,100 - 2700 = 8400.
8% of the surveyed kids did not go to school.
Number of kids who did not go to school = 0.08* 30000 = 2400
Number of kids not going to schools whose mothers have completed primary school = 2400 - 1800 = 600.
In S, 60% of the surveyed kids were in G.
Therefore, 6000 kids in S must be from G.
In NE, among the O kids, 50% had mothers who had dropped out before completing primary education.
There are 300 O kids whose mothers dropped out before completing primary education. These kids represent 50% of the total number of O-kids. Therefore, there must be 600 O-kids from NE - 300 kids should have mothers who dropped out before completing primary education and 300 kids should have mothers who have completed primary education.
The number of kids in G in NE was the same as the number of kids in G in W. Therefore, the number of kids in G in NE and the number of kids in G in W should be equal to 5250. Total number of kids:

Number of kids whose mothers have completed primary education:

We have been given that in S, all surveyed kids whose mothers had completed primary education were in school. Therefore, the number of kids not going to school whose mothers have completed primary education in S should be 0. Filling the tables, we get,
Total number of kids:

Number of kids whose mothers have completed primary education:

As we can see from the table, 3700 kids out of the 10,000 kids from S are studying in P. 37% of the total number of students from S were studying in P. Therefore, option A is the right answer.
Among the kids in W whose mothers had completed primary education, how many were not in school?
Let us make note of the information given in the set.
The set states that rural kids were surveyed from 3 regions NE, West and South.
50 students each were surveyed from 150 villages in the NE, 250 villages from the West and 200 villages from the South.
Total number of kids from the NE = 150*50 = 7500
Total number of kids from the West = 250*50 = 12500
Total number of kids from the South = 200*50 = 10,000.
The table, given in the question, gives the number of students whose mothers dropped out before completing primary education. Therefore, the mothers of the remaining students should have completed primary education.
There are 7500 students from the NE in total. The mothers of 5000 of those students dropped out before completing primary education. Therefore, the remaining 2500 kids should have mothers who have completed primary education.
Let us make 2 tables - one representing the number of students and the other representing the number of students whose mother has completed primary education.
55% of the surveyed kids studied in schools run by the Government.
Number of kids studying in Govt. School should be 0.55*30000 = 16,500
From the given table, we know that the mothers of 13,500 kids who went to Govt. Schools dropped out of primary school.
Therefore, the remaining 16,500 - 13,500 = 3000 kids should have mother who have completed primary school.
37% of the surveyed kids study in private schools.
Number of kids studying in private schools should be 0.37*30000 = 11,100.
Number of kids in private schools whose mothers have completed primary school = 11,100 - 2700 = 8400.
8% of the surveyed kids did not go to school.
Number of kids who did not go to school = 0.08* 30000 = 2400
Number of kids not going to schools whose mothers have completed primary school = 2400 - 1800 = 600.
In S, 60% of the surveyed kids were in G.
Therefore, 6000 kids in S must be from G.
In NE, among the O kids, 50% had mothers who had dropped out before completing primary education.
There are 300 O kids whose mothers dropped out before completing primary education. These kids represent 50% of the total number of O-kids. Therefore, there must be 600 O-kids from NE - 300 kids should have mothers who dropped out before completing primary education and 300 kids should have mothers who have completed primary education.
The number of kids in G in NE was the same as the number of kids in G in W. Therefore, the number of kids in G in NE and the number of kids in G in W should be equal to 5250. Total number of kids:
Number of kids whose mothers have completed primary education:
We have been given that in S, all surveyed kids whose mothers had completed primary education were in school. Therefore, the number of kids not going to school whose mothers have completed primary education in S should be 0. Filling the tables, we get,
Total number of kids:
Number of kids whose mothers have completed primary education:
There are 300 students who are not in school in W whose mothers have completed primary education. Therefore, option A is the right answer.
In a follow up survey of the same kids two years later, it was found that all the kids were now in school. Of the kids who were not in school earlier, in one region, 25% were in G now, whereas the rest were enrolled in P; in the second region, all such kids were in G now; while in the third region, 50% of such kids had now joined G while the rest had joined P. As a result, in all three regions put together, 50% of the kids who were earlier out of school had joined G. It was also seen that no surveyed kid had changed schools.
What number of the surveyed kids now were in G in W?
Let us make note of the information given in the set.
The set states that rural kids were surveyed from 3 regions NE, West and South.
50 students each were surveyed from 150 villages in the NE, 250 villages from the West and 200 villages from the South.
Total number of kids from the NE = 150*50 = 7500
Total number of kids from the West = 250*50 = 12500
Total number of kids from the South = 200*50 = 10,000.
The table, given in the question, gives the number of students whose mothers dropped out before completing primary education. Therefore, the mothers of the remaining students should have completed primary education.
There are 7500 students from the NE in total. The mothers of 5000 of those students dropped out before completing primary education. Therefore, the remaining 2500 kids should have mothers who have completed primary education.
Let us make 2 tables - one representing the number of students and the other representing the number of students whose mother has completed primary education.
55% of the surveyed kids studied in schools run by the Government.
Number of kids studying in Govt. School should be 0.55*30000 = 16,500
From the given table, we know that the mothers of 13,500 kids who went to Govt. Schools dropped out of primary school.
Therefore, the remaining 16,500 - 13,500 = 3000 kids should have mother who have completed primary school.
37% of the surveyed kids study in private schools.
Number of kids studying in private schools should be 0.37*30000 = 11,100.
Number of kids in private schools whose mothers have completed primary school = 11,100 - 2700 = 8400.
8% of the surveyed kids did not go to school.
Number of kids who did not go to school = 0.08* 30000 = 2400
Number of kids not going to schools whose mothers have completed primary school = 2400 - 1800 = 600.
In S, 60% of the surveyed kids were in G.
Therefore, 6000 kids in S must be from G.
In NE, among the O kids, 50% had mothers who had dropped out before completing primary education.
There are 300 O kids whose mothers dropped out before completing primary education. These kids represent 50% of the total number of O-kids. Therefore, there must be 600 O-kids from NE - 300 kids should have mothers who dropped out before completing primary education and 300 kids should have mothers who have completed primary education.
The number of kids in G in NE was the same as the number of kids in G in W. Therefore, the number of kids in G in NE and the number of kids in G in W should be equal to 5250. Total number of kids:
Number of kids whose mothers have completed primary education:
We have been given that in S, all surveyed kids whose mothers had completed primary education were in school. Therefore, the number of kids not going to school whose mothers have completed primary education in S should be 0. Filling the tables, we get,
Total number of kids:
Number of kids whose mothers have completed primary education:
Number of kids who were out of school in the initial survey = 2400.
The number of kids who were out of school in NE is 600, W is 1500 and S is 300.
25% of the kids from one area, 100% of the kids from one area and 50% of the kids from another area are transferred to G. As a result, the number of kids who were not in school earlier but studying in G now became 50% of 2400 = 1200.
100% of the kids in W could not have been transferred to G (Since the total number of kids transferred to G is 1200 and the number of kids in W alone is 1500).
Let us assume that 100% of the kids from NE transferred (600). In this case, if 25% of the kids from W are transferred (375), 50% of the kids from S (300) will be transferred. The total in this case would be 600 + 375+ 300 = 1275. Therefore, we can eliminate this case.
If 100% of the kids from NE (600), 25% of the kids from S (75) and 50% of the kids from W (750) are transferred, then the total would have been 1425. Therefore, we can eliminate this case as well.
If 50% of the kids from W (750), 25% of the kids from NE (150) and 100% of the kids from S (300) are transferred, then the total number of kids transferred to G would have been 750 + 150 + 300 = 1200. Therefore, this must have been the case.
Number of students transferred to G in W = 750.
Number of students present in G in W earlier = 5250
Total = 6000
Therefore, option A is the right answer.
In a follow up survey of the same kids two years later, it was found that all the kids were now in school. Of the kids who were not in school earlier, in on.e region, 25% were in G now, whereas the rest were enrolled in P; in the second region, all such kids were in G now; while in the third region, 50% of such kids had now joined G while the rest had joined P. As a result, in all three regions put together, 50% of the kids who were earlier out of school had joined G. It was also seen that no surveyed kid had changed schools.
What percentage of the surveyed kids in S, whose mothers had dropped out before completing primary education, were in G now?
Let us make note of the information given in the set.
The set states that rural kids were surveyed from 3 regions NE, West and South.
50 students each were surveyed from 150 villages in the NE, 250 villages from the West and 200 villages from the South.
Total number of kids from the NE = 150*50 = 7500
Total number of kids from the West = 250*50 = 12500
Total number of kids from the South = 200*50 = 10,000.
The table, given in the question, gives the number of students whose mothers dropped out before completing primary education. Therefore, the mothers of the remaining students should have completed primary education.
There are 7500 students from the NE in total. The mothers of 5000 of those students dropped out before completing primary education. Therefore, the remaining 2500 kids should have mothers who have completed primary education.
Let us make 2 tables - one representing the number of students and the other representing the number of students whose mother has completed primary education.
55% of the surveyed kids studied in schools run by the Government.
Number of kids studying in Govt. School should be 0.55*30000 = 16,500
From the given table, we know that the mothers of 13,500 kids who went to Govt. Schools dropped out of primary school.
Therefore, the remaining 16,500 - 13,500 = 3000 kids should have mother who have completed primary school.
37% of the surveyed kids study in private schools.
Number of kids studying in private schools should be 0.37*30000 = 11,100.
Number of kids in private schools whose mothers have completed primary school = 11,100 - 2700 = 8400.
8% of the surveyed kids did not go to school.
Number of kids who did not go to school = 0.08* 30000 = 2400
Number of kids not going to schools whose mothers have completed primary school = 2400 - 1800 = 600.
In S, 60% of the surveyed kids were in G.
Therefore, 6000 kids in S must be from G.
In NE, among the O kids, 50% had mothers who had dropped out before completing primary education.
There are 300 O kids whose mothers dropped out before completing primary education. These kids represent 50% of the total number of O-kids. Therefore, there must be 600 O-kids from NE - 300 kids should have mothers who dropped out before completing primary education and 300 kids should have mothers who have completed primary education.
The number of kids in G in NE was the same as the number of kids in G in W. Therefore, the number of kids in G in NE and the number of kids in G in W should be equal to 5250. Total number of kids:
Number of kids whose mothers have completed primary education:
We have been given that in S, all surveyed kids whose mothers had completed primary education were in school. Therefore, the number of kids not going to school whose mothers have completed primary education in S should be 0. Filling the tables, we get,
Total number of kids:
Number of kids whose mothers have completed primary education:
Number of kids who were out of school in the initial survey = 2400.
The number of kids who were out of school in NE is 600, W is 1500 and S is 300.
25% of the kids from one area, 100% of the kids from one area and 50% of the kids from another area are transferred to G. As a result, the number of kids who were not in school earlier but studying in G now became 50% of 2400 = 1200.
100% of the kids in W could not have been transferred to G (Since the total number of kids transferred to G is 1200 and the number of kids in W alone is 1500).
Let us assume that 100% of the kids from NE transferred (600). In this case, if 25% of the kids from W are transferred (375), 50% of the kids from S (300) will be transferred. The total in this case would be 600 + 375+ 300 = 1275. Therefore, we can eliminate this case.
If 100% of the kids from NE (600), 25% of the kids from S (75) and 50% of the kids from W (750) are transferred, then the total would have been 1425. Therefore, we can eliminate this case as well.
If 50% of the kids from W (750), 25% of the kids from NE (150) and 100% of the kids from S (300) are transferred, then the total number of kids transferred to G would have been 750 + 150 + 300 = 1200. Therefore, this must have been the case.
Already, 5100 kids whose mothers had dropped out were in G in S.
After the transfer, 300 more students will be added to the count.
Therefore, 5400 students whose mothers had dropped out will be in G in S.
Total number of kids whose mothers had dropped out in S = 5700
Percentage = 5400/5700 = 94.73%.
Therefore, option A is the right answer.
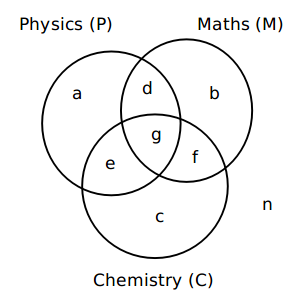
Applicants for the doctoral programmes of Ambi Institute of Engineering (AIE) and Bambi Institute of Engineering (BIE) have to appear for a Common Entrance Test (CET). The test has three sections: Physics (P), Chemistry (C), and Maths (M). Among those appearing for CET, those at or above the 80th percentile in at least two sections, and at or above the 90th percentile overall, are selected for Advanced Entrance Test (AET) conducted by AIE. AET is used by AIE for final selection.
For the 200 candidates who are at or above the 90th percentile overall based on CET, the following are known about their performance in CET:
1. No one is below the 80th percentile in all 3 sections.
2. 150 are at or above the 80th percentile in exactly two sections.
3. The number of candidates at or above the 80th percentile only in P is the same as the number of candidates at or above the 80th percentile only in C. The same is the number of candidates at or above the 80th percentile only in M.
4. Number of candidates below 80th percentile in P: Number of candidates below 80th percentile in C: Number of candidates below 80th percentile in M = 4:2:1.
BIE uses a different process for selection. If any candidate is appearing in the AET by AIE, BIE considers their AET score for final selection provided the candidate is at or above the 80th percentile in P. Any other candidate at or above the 80th percentile in P in CET, but who is not eligible for the AET, is required to appear in a separate test to be conducted by BIE for being considered for final selection. Altogether, there are 400 candidates this year who are at or above the 80th percentile in P.
What best can be concluded about the number of candidates sitting for the separate test for BIE who were at or above the 90th percentile overall in CET?
It is given that 200 candidates scored above 90th percentile overall in CET. Let the following Venn diagram represent the number of persons who scored above 80 percentile in CET in each of the three sections:

From (1), n = 0
From (2), d + e + f = 150
From (3), a = b = c
Since, there are a total of 200 candidates
a + b + c + g = 200 - 150 = 50
3a + g = 50 => a < 17
From (4), (b + f + c) : (a + d + b) : (a + e + c) = 4 : 2: 1
Or (2a + f) : (2a + d) : (2a + e) = 4 : 2 : 1
or, 6a + (d + e + f) = 7x
Or, 6a + 150 = 7x
So, a can be 3 or 10
x can be 24 or 30
2a + e can be 24 or 30 => e can be 18 or 10
2a + d can be 48 or 60 = > d can be 42 or 40
2a + f can be 96 or 120 => f can be 90 or 100
3a + g = 50 => g can be 41 or 20
Among the candidates who are at or above 90th percentile, the candidates who are at or above 80th percentile in at least two sections are selected for AET. Hence, the candidates represented by d, e, f and g are selected for AET.
BIE will consider the candidates who are appearing for AET and are at or above 80th percentile in P. Hence, BIE will consider the candidates represented by d, e and g, which can be 104 or 80.
BIE will conduct a separate test for the other students who are at or above 80th percentile in P. Given that there are a total of 400 candidates at or above 80th percentile in P, and since there are 104 or 80 candidates at or above 80th percentile in P and are at or above 90th percentile overall, there must be 296 or 320 candidates at or above 80th percentile in P who scored less than 90th percentile overall.
a can be 3 or 10
Hence, Option A is the correct answer.
If the number of candidates who are at or above the 90th percentile overall and also at or above the 80th percentile in all three sections in CET is actually a multiple of 5, what is the number of candidates who are at or above the 90th percentile overall and at or above the 80th percentile in both P and M in CET?
It is given that 200 candidates scored above 90th percentile overall in CET. Let the following Venn diagram represent the number of persons who scored above 80 percentile in CET in each of the three sections:
From (1), n = 0
From (2), d + e + f = 150
From (3), a = b = c
Since, there are a total of 200 candidates
a + b + c + g = 200 - 150 = 50
3a + g = 50 => a < 17
From (4), (b + f + c) : (a + d + b) : (a + e + c) = 4 : 2: 1
Or (2a + f) : (2a + d) : (2a + e) = 4 : 2 : 1
or, 6a + (d + e + f) = 7x
Or, 6a + 150 = 7x
So, a can be 3 or 10
x can be 24 or 30
2a + e can be 24 or 30 => e can be 18 or 10
2a + d can be 48 or 60 = > d can be 42 or 40
2a + f can be 96 or 120 => f can be 90 or 100
3a + g = 50 => g can be 41 or 20
Among the candidates who are at or above 90th percentile, the candidates who are at or above 80th percentile in at least two sections are selected for AET. Hence, the candidates represented by d, e, f and g are selected for AET.
BIE will consider the candidates who are appearing for AET and are at or above 80th percentile in P. Hence, BIE will consider the candidates represented by d, e and g, which can be 104 or 80.
BIE will conduct a separate test for the other students who are at or above 80th percentile in P. Given that there are a total of 400 candidates at or above 80th percentile in P, and since there are 104 or 80 candidates at or above 80th percentile in P and are at or above 90th percentile overall, there must be 296 or 320 candidates at or above 80th percentile in P who scored less than 90th percentile overall.
From the given condition, g is a multiple of 5.
So, g = 20.
The number of candidates at or above 90th percentile overall and at or above 80th percentile in both P and M = d + g = 60.
Hence, 60 is the correct answer.
If the number of candidates who are at or above the 90th percentile overall and also at or above the 80th percentile in all three sections in CET is actually a multiple of 5, then how many candidates were shortlisted for the AET for AIE?
It is given that 200 candidates scored above 90th percentile overall in CET. Let the following Venn diagram represent the number of persons who scored above 80 percentile in CET in each of the three sections:

From (1), n = 0
From (2), d + e + f = 150
From (3), a = b = c
Since, there are a total of 200 candidates
a + b + c + g = 200 - 150 = 50
3a + g = 50 => a < 17
From (4), (b + f + c) : (a + d + b) : (a + e + c) = 4 : 2: 1
Or (2a + f) : (2a + d) : (2a + e) = 4 : 2 : 1
or, 6a + (d + e + f) = 7x
Or, 6a + 150 = 7x
So, a can be 3 or 10
x can be 24 or 30
2a + e can be 24 or 30 => e can be 18 or 10
2a + d can be 48 or 60 = > d can be 42 or 40
2a + f can be 96 or 120 => f can be 90 or 100
3a + g = 50 => g can be 41 or 20
Among the candidates who are at or above 90th percentile, the candidates who are at or above 80th percentile in at least two sections are selected for AET. Hence, the candidates represented by d, e, f and g are selected for AET.
BIE will consider the candidates who are appearing for AET and are at or above 80th percentile in P. Hence, BIE will consider the candidates represented by d, e and g, which can be 104 or 80.
BIE will conduct a separate test for the other students who are at or above 80th percentile in P. Given that there are a total of 400 candidates at or above 80th percentile in P, and since there are 104 or 80 candidates at or above 80th percentile in P and are at or above 90th percentile overall, there must be 296 or 320 candidates at or above 80th percentile in P who scored less than 90th percentile overall.
In this question, g = 20.
Number of candidates shortlisted for AET
= d + e + f + g
= 40 + 10 + 100 + 20
= 170
Hence, 170 is the correct answer.
If the number of candidates who are at or above the 90th percentile overall and also are at or above the 80th percentile in P in CET, is more than 100, how many candidates had to sit for the separate test for BIE?
It is given that 200 candidates scored above 90th percentile overall in CET. Let the following Venn diagram represent the number of persons who scored above 80 percentile in CET in each of the three sections:

From (1), n = 0
From (2), d + e + f = 150
From (3), a = b = c
Since, there are a total of 200 candidates
a + b + c + g = 200 - 150 = 50
3a + g = 50 => a < 17
From (4), (b + f + c) : (a + d + b) : (a + e + c) = 4 : 2: 1
Or (2a + f) : (2a + d) : (2a + e) = 4 : 2 : 1
or, 6a + (d + e + f) = 7x
Or, 6a + 150 = 7x
So, a can be 3 or 10
x can be 24 or 30
2a + e can be 24 or 30 => e can be 18 or 10
2a + d can be 48 or 60 = > d can be 42 or 40
2a + f can be 96 or 120 => f can be 90 or 100
3a + g = 50 => g can be 41 or 20
Among the candidates who are at or above 90th percentile, the candidates who are at or above 80th percentile in at least two sections are selected for AET. Hence, the candidates represented by d, e, f and g are selected for AET.
BIE will consider the candidates who are appearing for AET and are at or above 80th percentile in P. Hence, BIE will consider the candidates represented by d, e and g, which can be 104 or 80.
BIE will conduct a separate test for the other students who are at or above 80th percentile in P. Given that there are a total of 400 candidates at or above 80th percentile in P, and since there are 104 or 80 candidates at or above 80th percentile in P and are at or above 90th percentile overall, there must be 296 or 320 candidates at or above 80th percentile in P who scored less than 90th percentile overall.
From the given condition, the number of candidates at or above 90th percentile overall and at or above 80th percentile in P in CET = (3 + 18 + 42 + 41) = 104.
The number of candidates who have to sit for separate test = (400 - 104 + 3) = 296 + 3 = 299 (we have added 3 for those who have scored more than 80th percentile only in P which is ‘a’).
Hence, option A is the correct answer.
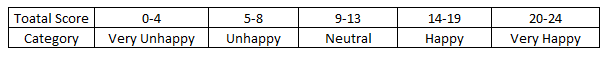
Simple Happiness index (SHI) of a country is computed on the basis of three, parameters: social support (S),freedom to life choices (F) and corruption perception (C). Each of these three parameters is measured on a scale of 0 to 8 (integers only). A country is then categorised based on the total score obtained by summing the scores of all the three parameters, as shown in the following table:
Following diagram depicts the frequency distribution of the scores in S, F and C of 10 countries - Amda, Benga, Calla, Delma, Eppa, Varsa, Wanna, Xanda,Yanga and Zooma:
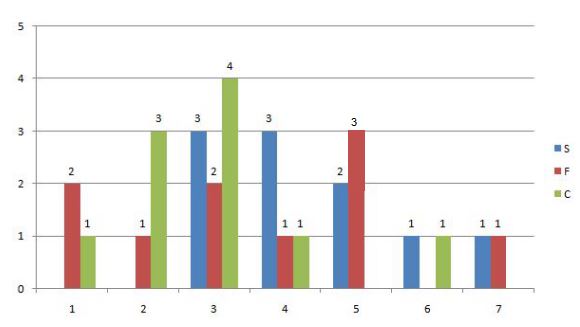
Further, the following are known.
1. Amda and Calla jointly have the lowest total score, 7, with identical scores in all the three parameters.
2. Zooma has a total score of 17.
3. All the 3 countries, which are categorised as happy, have the highest score ln exactly one parameter.
What is Amda's score in F?
The frequency distribution is:
S: 3,3,3,4,4,4,5,5,6,7
F: 1,1,2,3,3,4,5,5,5,7
C: 1,2,2,2,3,3,3,3,4,6
or
S: 3,3,3,4,4,4,5,5,6,7
F: 1,1,2,3,3,4,5,5,5,7
C: 1,2,2,2,3,3,3,3,4,6
Given Amda and Cadella score is 7 each with identical in all parameters. So it can score either 3,1,3 in S,F,C respectively or 4,1,2 in S,F,C respectively. In both the cases, its score in F is 1.
What is Zooma's score in S?
The frequency distribution is:
S: 3,3,3,4,4,4,5,5,6,7
F: 1,1,2,3,3,4,5,5,5,7
C: 1,2,2,2,3,3,3,3,4,6
or
S: 3,3,3,4,4,4,5,5,6,7
F: 1,1,2,3,3,4,5,5,5,7
C: 1,2,2,2,3,3,3,3,4,6
Zooma(Z) has a total score of 17 (comes under happy category), and other 2 countries, which are categorized as happy, have the highest score in exactly one parameter.
Suppose the other two countries are P and Q
Z have two possibilities for S, F, C : (6,7,4) & (6,5,6)
All the other cases are negated because "All the 3 countries, which are categorised as happy, have the highest score ln exactly one parameter."
For Example : 7,7,3 is not possible because 7 being the highest score is there in two parameters.
So, it scored 6 in S in both the cases.
Benga and Delma, two countries categorized as happy, are tied with the same total score. What is the
maximum score they can have?
S: 3,3,3,4,4,4,5,5,6,7
F: 1,1,2,3,3,4,5,5,5,7
C: 1,2,2,2,3,3,3,3,4,6
Benga and Delma, two countries categorized as happy, are tied with the same total score.
The best numbers remaining are 7,5,6 which adds upto 18, If Benga scores 18, then Delma can't score 18.
Similarly both can't score 17 and 16. Both can score 15 and their distribution will be:
Benga: 7,5,3
Delma: 4,5,6 or 5,4,6
If Benga scores 16 and Delma scores 15, then what is the maximum number of countries with a score of 13?
S: 3,3,3,4,4,4,5,5,6,7
F: 1,1,2,3,3,4,5,5,5,7
C: 1,2,2,2,3,3,3,3,4,6
Given that Benga scores 16, and Delma scores 15.
The possibility is Benga: 5,5,6 and Delma: 7,5,3
If Benga's distribution is 7,3,6 then Delma can't score 15.
Strike off those numbers.
S: 3,3,3,4,4,4,5,5,6,7
F: 1,1,2,3,3,4,5,5,5,7
C: 1,2,2,2,3,3,3,3,4,6
We have to maximum number of countries with score 13. This score does not comes under the category of happy. So to score 13, the distribution can be 5,5,3. Hence, maximum 1 country is possible.
There are 21 employees working in a division, out of whom 10 are special-skilled employees (SE) and the remaining are regular-skilled employees (RE). During the next five months, the division has to complete five projects every month. Out of the 25 projects, 5 projects are "challenging", while the remaining ones are "standard". Each of the challenging projects has to be completed in different months. Every month, five teams — T1 T2, T3, T4 and T5, work on one project each. T1, T2, T3, T4 and T5 are allotted the challenging project in the first, second, third, fourth and fifth month, respectively. The team assigned the challenging project has one more employee than the rest.
In the first month, T1 has one more SE than T2, T2 has one more SE than T3, T 3 has one more SE than T4, and T4 has one more SE than T5. Between two successive months, the composition of the teams changes as follows:
a. The team allotted the challenging project, gets two SE from the team which was allotted the challenging project in the previous month. In exchange, one RE is shifted from the former team to the latter team.
b. After the above exchange, if T1 has any SE and T5 has any RE, then one SE is shifted from T1 to T5, and one RE is shifted from T5 to T1. Also, if T2 has any SE and T4 has any RE, then one SE is shifted from T2 to T4, and one RE is shifted from T4 to T2.
Each standard project has a total of 100 credit points, while each challenging project has 200 credit points. The credit points are equally shared between the employees included in that team.
The number of times in which the composition of team T2 and the number of times in which composition of team T4 remained unchanged in two successive months are:
The table looks like this in Month 1.
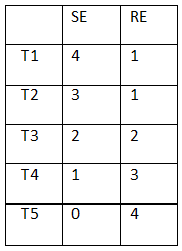
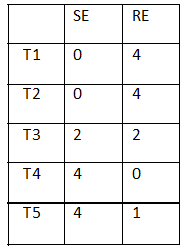
Table in month 2. (after exchanging employees according to conditions)
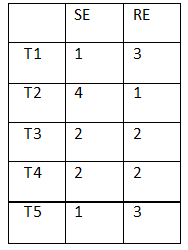
Table in month 3.
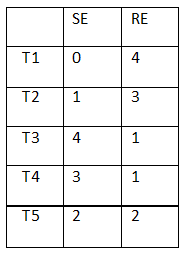
Table in month 4.
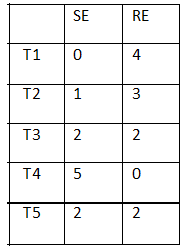
Table in month 5.
T2 remained unchanged in Month 3 and Month 4, and composition of T4 was never unchanged. Hence (1,0)
The number of SE in T1 and T5 for the projects in the third month are, respectively:
The table looks like this in Month 1.
Table in month 2. (after exchanging employees according to conditions)
Table in month 3.
Table in month 4.
Table in month 5.
Refer to table of Month 3, the number of SE employees in T1 and T5 are respectively (0,2)
Which of the following CANNOT be the total credit points earned by any employee from the projects?
When challenging project is given, each employee gets 40 points.
When standard project is given, each employee gets 25 points.
Suppose:
If a particular employee is involved in all standard projects then his credit points will be: 125
If a particular employee is involved in 4 standard projects and 1 challenging project then his credit points will be: 140
If a particular employee is involved in 3 standard projects and 2 challenging projects then his credit points will be: 155
If a particular employee is involved in 2 standard projects and 3 challenging projects then his credit points will be: 170
If a particular employee is involved in 1 standard project and 4 challenging projects then his credit points will be: 185
If a particular employee is all challenging projects then his credit points will be: 200
Hence, an employee cannot earn 150 points.
One of the employees named Aneek scored 185 points. Which of the following CANNOT be true?
Check option A,
It is possible to move to T2 after working in T1 for the first month. From T2, either movement to T3 or T4 is possible. If moved to T3, then in next month he can move to T4, because of challenging project. Hence this option can be true.
Check option B,
It is possible to move to T2 after working in T1 for the first month. From T2, either movement to T3 or T4 is possible. If moved to T4, next movement can be in T5. Hence this option can be true.
Check option C,
T2, T3, T4, T5. This sequential movement is also possible.
Check option D,
If Aneek is there in T1 for the first month, then he will shift to T2, T5 or remain in T1 in the subsequent month.
Consider he remained in T1, then he will either move to T5 or remain in T1. So, if this happens the sequence given in option can never follow.
Suppose he has shifted to T2, but T2 is not mentioned in option, so ruled out.
And if he moved to T5, in the next month then he will remain there only.
Hence option D is not correct.
In a square layout of site 5m ~ 5m 25 equal-sized square platforms of different heights are built. The heights (in metre) of individual platforms are as shown below:
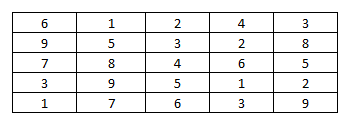
Individuals (all of same height) are seated on these platforms. We say an individual A can reach individual B, if all the three following conditions are met;
(i) A and B are In the same row or column
(ii) A is at a lower height than B
(iii) If there is/are any individuals (s) between A and B, such individual(s) must be at a height lower than that of A.
Thus in the table given above, consider the Individual seated at height 8 on 3rd row and 2nd column. He can be reached by four individuals. He can be reached by the individual on his left at height 7, by the two individuals on his right at heights of 4 and 6 and by the individual above at height 5.
Rows in the layout are numbered from top to bottom and columns are numbered from left to right.
How many individuals in this layout can be reached by just one individual?
The table represent the platforms and by how many platforms can it be reached. For example, in row 1 and column 1, platform with height 6 can be reached by 3 people.
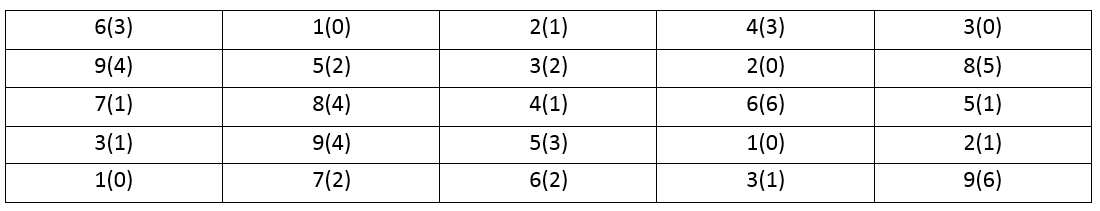
Hence, there are a total of 7 people.
Which of the following is true for any individual at a platform of height 1 m in this layout?
Since, we have been given that a person can be reached only by those who are smaller than him. Hence, 1 cannot be reached by anyone. Thus, option D is the correct answer.
We can find two individuals who cannot be reached by anyone in
Check out the options.
In last row, only one individual can't be reached by anyone.
In the fourth row, only one individual can't be reached by anyone.
In the middle column, every individual can be reached by atleast another individual.
In the fourth column, both 1 and 2 cannot be reached by any person. Hence, fourth column is the correct answer.
Which of the following statements is true about this layout?
Let us go by options.
Option A: In first row, 6 is reached by 3, 1 by none, 2 by none, 4 by 3, 3 by none. Hence, ruled out.
Option B: Third row, every individual is approached by other.
Option D: In first row, 6 is reached by 3, 1 by none, 2 by none, 4 by 3, 3 by none. Hence, ruled out.
Hence, Option C is correct.
A new airlines company is planning to start operations in a country. The company has identified ten different cities which they plan to connect through their network to start with. The flight duration between any pair of cities will be less than one hour. To start operations, the company has to decide on a daily schedule.
The underlying principle that they are working on is the following:
Any person staying in any of these 10 cities should be able to make a trip to any other city in the morning and should be able to return by the evening of the same day.
If the underlying principle is to be satisfied in such a way that the journey between any two cities can be performed using only direct (non-stop) flights, then the minimum number of direct flights to be scheduled is:
There are ten cities. We need to find the minimum number of flights required to travel from any city to any city. Any two cities can be selected in 10C2 ways. Now for these two cities, a person will need minimum 4 flights. (1 to go from A to B, 1 to go from B to A. Similarly, 1 to return to A and 1 to return to B) Thus, minimum number of required flights = 45*4 = 180.
Suppose three of the ten cities are to be developed as hubs. A hub is a city which is connected with every other city by direct flights each way, both in the morning as well as in the evening. The only direct flights which will be scheduled are originating and/or terminating in one of the hubs. Then the minimum number of direct flights that need to be scheduled so that the underlying principle of the airline to serve all the ten cities is met without visiting more than one hub during one trip is:
From each hub, there will be flights to 7 cities. So total total number of flights originating or terminating at each hub = 7*4 = 28. For all three hubs, it would be 28*3 = 84
There are three hubs in total. Each hub must also be interconnected. The total number of flights between any two hubs will be 4. For three hubs it will be 12.
Hence, the required number will be 84 + 12 = 96.
Suppose the 10 cities are divided into 4 distinct groups G1, G2, G3, G4 having 3, 3, 2 and 2 cities respectively and that G1 consists of cities named A, B and C. Further, suppose that direct flights are allowed only between two cities satisfying one of the following:
1. Both cities are in G1
2. Between A and any city in G2
3. Between B and any city in G3
4. Between C and any city in G4
Then the minimum number of direct flights that satisfies the underlying principle of the airline is:
In G1, we have three cities namely A, B, C. Person living in any of these three cities should be able to travel to other city once in the morning nad one in the night. Therefore, a total of 4 flights are required between a pair of cities.
A ---> B (Morning flight)
A ---> B (Evening flight)
B ---> A (Morning flight)
B ---> A (Evening flight)
Number of flights between the cities of G1 = 3c2*4 = 12
Between cities in A and any city in G2 = 3*4 = 12
Between B and any city in G3 = 2*4 = 8
Between C and any city in G4 = 2*4 = 8
Total = 12*2 + 8*2 = 40
Suppose the 10 cities are divided into 4 distinct groups Gl, G2, G3, G4 having 3, 3, 2 and 2 cities respectively and that Gl consists of cities named A, B and C. Further, suppose that direct flights are allowed only between two cities satisfying one of the following:
1. Both cities are in G1
2. Between A and any city in G2
3. Between B and any city in G3
4. Between C and any city in G4
However, due to operational difficulties at A, it was later decided that the only flights that would operate at A would be those to and from B. Cities in G2 would have to be assigned to G3 or to G4.
What would be the maximum reduction in the number of direct flights as compared to the situation before the operational difficulties arose?
The cities those were a part of G2 will be shifted to either G3 or G4 but that will not have any impact on the number of the total flights from G1. The only reduction which will take place due to the number of flights shutting down from A to C.
Hence, the maximum reduction in the number of direct flights as compared to the situation before the operational difficulties arose = 4
Alternate method :
Let us determine the number of flights under new conditions.
Flights between A and B = 4
Between B and any city in G3 = 4*4 = 16
Between C and B = 4
Between C and any city in G4 = 4*4 = 12
Hence, total flights = 36
Thus, reduction = 40 - 36 = 4.
Four cars need to travel from Akala (A) to Bakala (B). Two routes are available, one via Mamur (M) and the other via Nanur (N). The roads from A to M, and from N to B, are both short and narrow. In each case, one car takes 6 minutes to cover the distance, and each additional car increases the travel time per car by 3 minutes because of congestion. (For example, if only two cars drive from A to M, each car takes 9 minutes.) On the road from A to N, one car takes 20 minutes, and each additional car increases the travel time per car by 1 minute. On the road from M to B, one car takes 20 minutes, and each additional car increases the travel time per car by 0.9 minute.
The police department orders each car to take a particular route in such a manner that it is not possible for any car to reduce its travel time by not following the order, while the other cars are following the order.
How many cars would be asked to take the route A-N-B, that is Akala-Nanur-Bakala route, by the police department?
Since there are two routes i.e A-M-B and A-N-B and four cars, then 2 cars must be allowed to take each route. In case if one car tried to break rule, then its travel time will increase. Now assume that on route A-M-B three cars are allowed and on route A-N-B one car is allowed, then one car running on A-M-B can break the rule and reduce its travel time. Hence, two cars must be allowed on each route.
If all the cars follow the police order, what is the difference in travel time (in minutes) between a car which takes the route A-N-B and a car that takes the route A-M-B?
Since, two cars are allowed on each route, The A-M part and N-B will take same time. The difference will be in travelling M-B part and A-N part, and that difference is 0.1 minute. In route M-B car will take 20+0.9 = 20.9 min and in route A-N car will take 20+1 = 21 min. So difference = 0.1 min
A new one-way road is built from M to N. Each car now has three possible routes to travel from A to B: A-M-B, A-N-B and A-M-N-B. On the road from M to N, one car takes 7 minutes and each additional car increases the
travel time per car by 1 minute. Assume that any car taking the A-M-N-B route travels the A-M portion at the same time as other cars taking the A-M-B route, and the N-B portion at the same time as other cars taking the A-N-B route.
How many cars would the police department order to take the A-M-N-B route so that it is not possible for any car to reduce its travel time by not following the order while the other cars follow the order? (Assume that the police department would never order all the cars to take the same route.)
Case 1: Let us assume 1 car takes AMB route, 3 cars take ANB route
Then travel time of AMB will be A-M + M-B = 6 + 20 = 26
Then travel time of ANB will be A-N + N-B = (20+2) + (6+3*2) = 34
Now, one car(A) travelling on ANB broke the rule and decided to move on AMB route. then
Case 2: Let us assume 2 cars take AMB route, 2 cars take ANB route
Then travel time of AMB will be A-M + M-B =(6+3) + (20+0.9) = 29.9
Then travel time of ANB will be A-N + N-B = (20+1) + (6+3) = 30
Since the car A reduced its time from 34 to 29.9, the case-1 route is not optimal, hence case 1 is invalid.
Now, one car(B) travelling on ANB broke the rule and decided to move on AMB route. then, case
Case 3: Let us assume 3 cars take AMB route, 1 car take ANB route
Then travel time of AMB will be A-M + M-B = (6+3*2) + (20+0.9*2) = 33.8
Then travel time of ANB will be A-N + N-B = (20) + (6) = 29
Now, one car(C) travelling on AMB broke the rule and decided to move on AMNB route. then
Case 4: Let us assume 2 cars take AMB route, 1 car take AMNB route and other take ANB route.
Then travel time of AMB will be A-M + M-B = (6+3*2) + (20+0.9) = 32.9
Then travel time of AMNB will be A-M + M-N + N-B = (6+3*2) + (7) + (6+3) = 28
Then travel time of ANB will be A-N + N-B = (20) + (6+3) = 29
Since this car(C) reduced its time from 33.8 to 28, the route is not optimal, hence case 3 is invalid.
Since this car(B) reduced its time from 30 to 28, the route is not optimal, hence case 2 is invalid.
Now, one car(D) travelling on AMB broke the rule and decided to move on AMNB route. then
Case 5: Let us assume 1 car takes AMB route, 2 cars take AMNB route and other takes ANB route.
Then, the portion A-M will be travelled by 3 cars, M-B by one car, M-N by 2 cars, A-N by 1 car and N-B by 3 cars.
Then, travel time of AMB will be A-M + M-B = (6+3*2) + (20) = 32
Then, travel time of AMNB will be A-M + M-N + N-B = (6+3*2) + (7+1) + (6+3*2) = 32
Then, travel time of ANB will be A-N + N-B = (20) + (6+3*2) = 32
It is clear that the car D reduced its time from 32.9 min to 32 min if it broke the rule. Hence, case 4 is invalid.
In this arrangement of case 5, no car can improve their travel time by changing their path
Hence, the optimal allocation will be to order 2 cars on A-M-N-B route.
A new one-way road is built from M to N. Each car now has three possible routes to travel from A to B: A-M-B, A-N-B and A-M-N-B. On the road from M to N, one car takes 7 minutes and each additional car increases the travel time per car by j. minute. Assume that any car taking the A-M-N-B route travels the A-M portion at the same time as other cars taking the A-M-B route, and the N-B portion at the same time as other cars taking the A-N-B route.
If all the cars follow the police order, what is the minimum travel time (in minutes) from A to B? (Assume that the police department would never order all the cars to take the same route.)
From the previous question we have found that
1 car take AMB route, 2 cars take AMNB route and other take ANB route.
Then the portion A-M will be travelled by 3 cars, M-B by one car, M-N by 2 cars, A-N by 1 car and N-B by 3 cars.
Then travel time of AMB will be A-M + M-B = (6+3*2) + (20) = 32
Then travel time of AMNB will be A-M + M-N + N-B = (6+3*2) + (7+1) + (6+3*2) = 32
Then travel time of ANB will be A-N + N-B = (20) + (6+3*2) = 32
The minimum travel time from A to B is 32 min.

Educational materials for CAT preparation
