Sign in
Please select an account to continue using cracku.in
↓ →
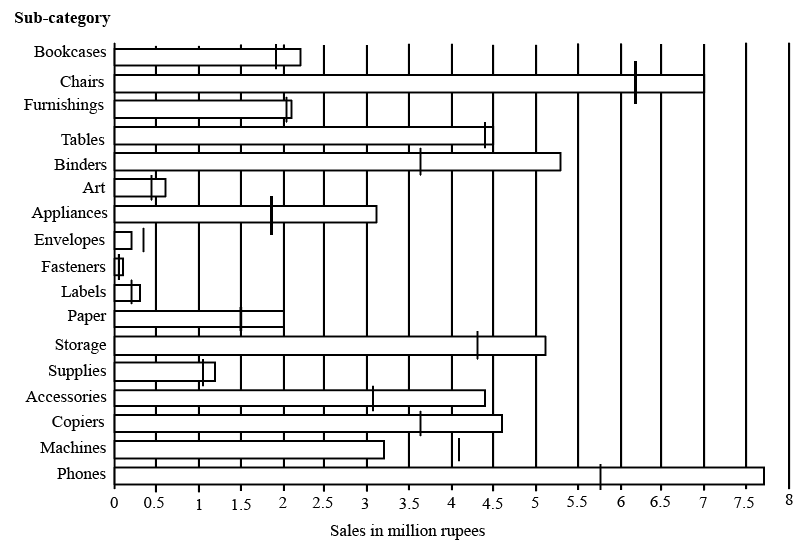
The horizontal bars in the above diagram represent 2020 aggregate sales (in ₹ million) of a company for the different subcategories of its products. The top four product subcategories (Bookcases, Chairs, Furnishings, Tables) belong to furniture product category; the bottom four product subcategories (Accessories, Copiers, Machines, Phones) belong to the technology product category while all other product subcategories belong to the office supply product category. For each of the product subcategories, there is a vertical line indicating the sales of the corresponding subcategory in 2019.
How many subcategories had sales of ₹ 4 million or more in 2019 and registered an increase in sales in excess of 25% in 2020?
Correct Answer: 1

The number of subcategories had sales of ₹ 4 million or more in 2019 and registered an increase in sales in excess of 25% in 2020 :
The subcategories with more than 4 million in sales in 2019 are :
Chairs: 6.2 million in 2019 and 7 million in 2020. ( For a 25 percent increase the sales must be at least 7.8 million and hence fails)
Tables: 4.4 million in 2019 and 4.5 million in 2020. ( For a 25 percent increase the sales must be at least 5.5 million and hence fails)
Storage: 4.3 million sales in 2019 and 5.1 million in 2020. ( For a 25 percent increase the sales must be at least 5.4 and hence fails)
Phones: 5.75 million in 2019 and 7.5 million in 2020. ( An increase of 30.5 percent)
Hence only one subcategory satisfies the condition.

Click on the Email ☝️ to Watch the Video Solution
Create a FREE account and get:
Book Free CAT Mentorship
Get personalized CAT strategy from a 99%iler
500+ students mentored
OTP Verification
Enter the 6-digit code sent to your phone
Booking Summary
Enter OTP
Didn't receive the OTP?

Educational materials for CAT preparation

Ask our AI anything

AI can make mistakes. Please verify important information.
AI can make mistakes. Please verify important information.


