Sign in
Please select an account to continue using cracku.in
↓ →
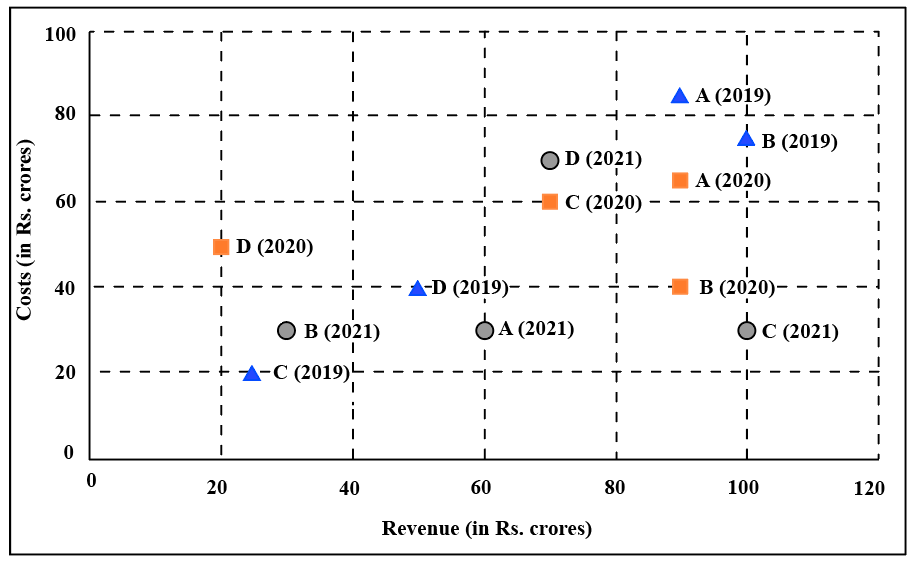
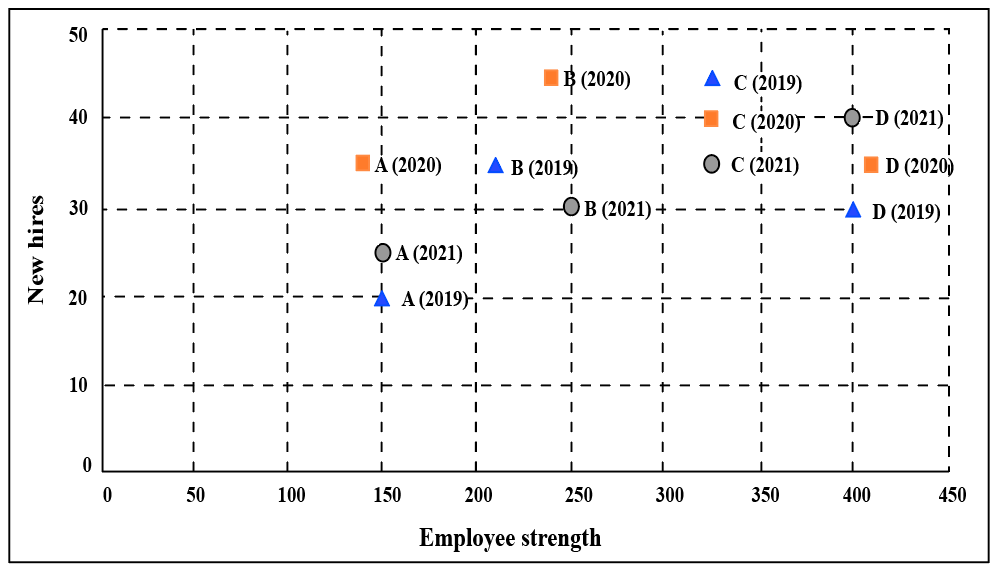
The two plots below show data for four companies code-named A, B, C, and D over three years - 2019, 2020, and 2021.
The first plot shows the revenues and costs incurred by the companies during these years. For example, in 2021, company C earned Rs.100 crores in revenue and spent Rs.30 crores. The profit of a company is defined as its revenue minus its costs
The second plot shows the number of employees employed by the company (employee strength) at the start of each of these three years, as well as the number of new employees hired each year (new hires). For example, Company B had 250 employees at the start of 2021, and 30 new employees joined the company during the year.
The ratio of a company's annual profit to its annual costs is a measure of its performance. Which of the four companies had the lowest value of this ratio in 2019?

It is given,
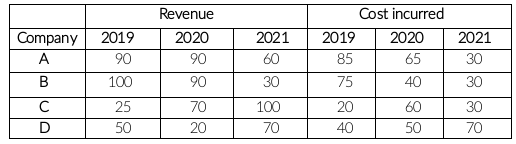
Measure of A's performance in 2019 = $$\frac{90-85}{85}=\frac{5}{85}=0.06$$
Measure of B's performance in 2019 = $$\frac{100-75}{75}=\frac{25}{75}=0.33$$
Measure of C's performance in 2019 = $$\frac{25-20}{25}=\frac{5}{25}=0.2$$
Measure of D's performance in 2019 = $$\frac{50-40}{40}=\frac{10}{40}=0.25$$
Company A had the lowest value.
The answer is option A.

Click on the Email ☝️ to Watch the Video Solution
Create a FREE account and get:
Book Free CAT Mentorship
Get personalized CAT strategy from a 99%iler
500+ students mentored
OTP Verification
Enter the 6-digit code sent to your phone
Booking Summary
Enter OTP
Didn't receive the OTP?

Educational materials for CAT preparation

Ask our AI anything

AI can make mistakes. Please verify important information.
AI can make mistakes. Please verify important information.


