The defense proposes to show that the incident that the prosecution so _____________ rejects as _______ did indeed take place.
XAT 2014 Question Paper
Fill in the blanks with the most appropriate option that follows:
Solution
Option B is the correct answer.
"Cavalierly"< text> means in a dismissive or nonchalant manner, which aligns with the idea of the prosecution rejecting the incident with indifference. "Apocryphal" refers to something of doubtful authenticity, which fits the context of the prosecution dismissing the incident as something that is not believed to be true.
Option A: "Blithely" is too casual and doesn’t fit the strong rejection. "Undesirable" doesn’t capture rejecting something as false.
Option C: "Vehemently" works, but "factual" contradicts the rejection of the incident as false.
Option D: "Persuasively" doesn’t fit the prosecution’s rejection, and "pointless" doesn’t match the context.
Option E: "Convincingly" suits the defense, not the prosecution; "inevitable" doesn’t fit with rejection.
Not just the absence of ____________ , but also the presence of ____________ and honesty is required to bind up the nation’s wound.
Solution
From the given context, we can infer that the first blank is filled with a negative word. Religion in second blank is not in line with the given context. Therefore, options B, C and D are eliminated.
Option B: Retribution means punishment, which isn’t about healing the nation's wounds. Camaraderie refers to friendship, but the sentence is looking for something deeper, like insight (understanding) to heal.
Option E: This is the appropriate answer. "Recrimination" refers to mutual accusations or blame, which should be absent for healing, while "insight" refers to understanding or wisdom, which would help mend the nation's wounds.
In many cases in physics, one has to deal simultaneously with collective and single-particle excitations of the system. The collective excitations are usually bosonic in nature while the single-particle excitations are often fermionic. One is therefore led to consider a system which includes bosons and fermions. Hence, _____________ Which of the following options is most likely to follow the paragraph given above?
Solution
The blank is preceded by the idea of systems which include both bosons and fermions. Therefore, the following sentence must talk about mixed bosons fermions systems.
Hence, option B is the correct answer.

Peter has suggested to me that the _____________ of highly systematic and _____________ planning techniques may have led to a substantial ______ in firms’ notions of what is likely to happen in the future, and thus to a _______ in the incidence of mistakes, especially on the part of the ____modern corporations.
Solution
In the given question as they are talking about planning techniques, precision is appropriate than exact. Therefore, options A, B and E are eliminated. In the given context, improvement correspond with the notions.
The answer is option C.
Clinical practitioners ___________ integrated mindfulness _____________ treatment of ________ host of emotional and behavioural disorders, ________ borderline personality disorder, major depression, chronic pain, or eating disorders. Number of such practitioners _________ increased substantially.
Solution
In the given sentence, treatment should be preceded by 'the' as we are talking about particular treatment for given disorders. Therefore, options C and D are eliminated. In the given sentence, number of such practitioners is followed by a singular verb, i.e. has is used instead of have.
The use of "have" in the first blank is appropriate because "Clinical practitioners" is a plural subject, and the present perfect tense ("have integrated") indicates an action that started in the past and continues to be relevant in the present.
The answer is option A.
Ontologies are _____________ equated with taxonomic hierarchies of classes, class definitions, and _______ subsumption relation, _____________ ontologies need not be limited to _____________ forms.
Solution
'the' is used before subsumption relation. Options A, C and D are eliminated. In the given context, 'but' is the appropriate word.
Ontologies are often equated with taxonomic hierarchies of classes, class definitions, and the subsumption relation, but ontologies need not be limited to these forms.
The answer is option E.
.webp)
For the following questions answer them individually
The MBA (1) is hardly a prerequisite for success, but it (2) certainly helps (3), and it has been getting more important (4) in recent years. Most (5) MBA programs equip their graduates to understand how (6) to deal with many of the important questions that their organizations will need to tackle (7) over time, and (8) that they will face in their careers.
The above italicized numbered words will be correctly represented by the following parts of speech:
Solution
1 - Noun
2- Pronoun
3 - Verb
4 - Adjective
5 - Adjective
6 - Adverb
7 - Verb
8 - Conjunction
Hence, option E is the correct answer.
Read the following paragraph carefully and answer the question that follows:
It is one week since Uttarakhand’s worst disaster in living memory. Flash floods resulting from extremely intense rainfall swept away mountainsides, villages and towns, thousands of people, animals, and agricultural fields, irrigation canals, domestic water sources, dams, roads, bridges, and buildings - anything that stood in the way. A week later, media attention remains riveted on the efforts to rescue tens of thousands of pilgrims and tourists visiting the shrines in the uppermost reaches of Uttarakhand’s sacred rivers. But the deluge spread far
beyond th Char Dhams - Yamunotri, Gangotri, Kedarnath and Badrinath - to cover the entire state. The catchments of many smaller rivers also witnessed flash floods, but the media has yet to report on the destruction there. Eyewitness accounts being gathered by official agencies and voluntary organisations have reported devastation from more than 200 villages so far, and more affected villages are being reported every day.
Which of the following would the author agree with the most?
Solution
Option A: From the last part of the paragraph, it can be inferred that the damage was not limited to the Char Dhams. The intensity of the destruction is yet to be reported. Thus, this is not the correct option.
Option D: This is a very extreme statement and hence cannot be the answer.
Option E: Since the author did not draw any comparison between media and voluntary organizations, this is not the correct option.
Options B and: "But the deluge spread far beyond the Char Dhams - Yamunotri, Gangotri, Kedarnath and Badrinath - to cover the entire state. The catchments of many smaller rivers also witnessed flash floods but the media has yet to report on the destruction there."
Although both the options are true, option C is the correct option, as this option also covered the reporting part of the disaster.
Thus, the correct option is C.
Which of the following is the correct form of expression for the underlined part of the
sentence below?
Patna is not only the capital of Bihar, but it is also one of the oldest cities in the world and the largest city in the state.
Solution
Whenever we use "the" we use the superlative form of the adjective(oldest), hence C, D, E is incorrect. "Nevertheless" in the second option is erroneous. Option A is the correct answer.

Read the definitions below and select the best match between the numbered sentences and the
definitions.
Premise: A proposition from which another statement is inferred or follows a conclusion.
Assumption: Something, which is accepted as true.Facts: Something, which can be checked.
Reason: A cause, explanation or justification for an action or event.
Conclusion: An end, finish or summarization of process or argument.
Proposition: A statement that expresses judgment or opinion.
Question: A sentence worded or expressed so as to elicit opinion.
Inductive inference: An end, finish or summarization reached for “the whole”, based on “a particular” real incidence.
Deductive Inference: An end, finish or summarization reached based on the combining and recombining two or more than two assumptions
When you look at the people who make fundamental, revolutionary breakthroughs in any field, you keep noticing over and over again a high preponderance of them have some sort of disability when they were younger, whether it was a physical disability or mental disability, which leads to lower expectations from others, whom they always wanted to prove wrong (1). And what does it do (2)? What does that do to you, when you try to prove someone wrong (3)? You increase your engagement in something because you want to fight against those expectations (4). So it seems like it actually can be a gift having what we label as a disability, or disorder, and cause people to overcompensate and engage in things in other ways (5). A research study shows that higher number of people with dyslexia become social entrepreneurs because they over- compensate their disability through nonverbal communication, initiative and grit (6). And this overcompensation leads to greatness (7).The best match would be:
Solution
The first sentence is like the speaker's main idea that they haven't proven yet, so it's an assumption.
The second part is a direct question.
The fourth part gives the reason why people might act a certain way.
The last part is the speaker's final thought or conclusion based on what they've said.
Hence, Option B is correct.
The fatal consequences of having a routine midday meal for at least twenty-two children in Bihar's Saran district expose the chronic neglect of school education in a large part of India (1). That governments cannot find a small piece of land for a school and are unable to store food materials without the risk of contamination is a telling commentary on their commitment to universal primary education (2). The Bihar horror clearly points to the absence of strong normative procedures for the provision of infrastructure, even for a new school (3).
The best match would be:
Solution
Each of the given sentences are summaries of particular events. Therefore, all are inductive inferences as mentioned in the definition.
The answer is option D.
For the following questions answer them individually
Read the following sentences and choose the option that best arranges them in a logical order.
- The mechanism of electroweak symmetry breaking is one of the most important issues in the present Particle Physics.
- They are required to give masses for all quarks and leptons and to guarantee the absence of the gauge anomaly.
- In the standard electroweak model a fundamental Higgs doublet is introduced to cause the spontaneous symmetry breaking.
- Supersymmetry (SUSY), eliminating all quadratic divergences, may provide a better theoretical basis to describe a fundamental Higgs boson with a relatively small mass to a high energy cutoff scale, say the Planck scale for example.
- In the minimal SUSY extension of the standards electroweak model the Higgs sector consists of two chiral superfields of Higgs doublets (H1 and H2 with opposite hypercharges).
Solution
4-5-2 form a logical sequence as the supersymmetry mentioned in 4 is explained in 5 and the "they" mentioned in 2 refers to the Higgs doublet mentioned in 5.
Only option A has 4-5-2 as a sequence and is hence, the answer.

Read the following sentences and choose the option that best arranges them in a logical order.
Read the following sentences and choose the option that best arranges them in a logical order.
Choose the best option:
1. Shakespeare did not personally prepare his plays for publication, and no official collection of them appeared until after his death.
2. Some were probably based on actors’ memories of plays.
3. Many of these quartos are quite unreliable.
4. A collection of his sonnets, considered by critics to be among the best ever written in English, appeared in 1609.
5. Many individual plays were published during his lifetime in unauthorized editions known as quartos.
Solution
5-3-2 forms a logical sequence as the quatros introduced in 5 are talked about in 3 and 2.
1-4 form a logical pair 1 introduces Shakespeare's plays and 4 talks about them further.
1 is the opening line as it introduces the topic of discussion.
Hence, the required sequence is 1-4-5-3-2.
Analyze the following passage and provide appropriate answers for the questions that follow.
The assumption of rationality puts an economist in a position to “explain” some features of market behavior, such as the dispersion of prices of psychophysically identical goods such as beer according to the amount spent on advertising them (no doubt, the fact that most beer is bought by individuals rather than as raw material by firms, which could be expected to be more rational than individuals, is part of the explanation.) Clearly something is wrong somewhere with the usual model of a competitive market with perfect information, for the virtually content less advertising cannot be considered as increasing the utility of beer in an obvious way. But if one can keep the assumption of rational actors, one need not get into the intellectual swamp of sentiment nor of preferences that depend on price. If one agrees, for example, that consumers use advertising as an index of the effort a producer will put into protecting its reputation and so as a predictor of quality control efforts, one can combine it with the standard mechanism and derive testable consequences from it.
But why, logically speaking, does it not matter that any of us, with a few years’ training, could disprove the assumptions? It is for the same reason that the statistical mechanics of gases is not undermined when Rutherford teaches a lot of only moderately bright physicists to use X-ray diffraction to disprove the assumption that molecules are little hard elastic balls. The point is, departures that Rutherford teaches us to find from the mechanism built into statistical mechanics are small and hardly ever systematic at level of gases. Ignorance and error about the quality of beer is also, unlikely to be systematic at the level of the consumers’ beer market, though it would become systematic if buyers imposed quality control procedures on sellers in contracts of sale (as corporations very often do in their contracts with suppliers). So when we find beers that advertising can make the ignorance and error systematic at the level of markets, just as lasers with wavelengths resonant with the internal structures and sizes of molecules can make molecular motions in gases systematic. The interesting one is that virtually content-less advertising is nevertheless information to a rational actor.
Which of the following statements would be the closest to the arguments in the passage?
Solution
In first paragraph it is mentioned that the firms could be expected to be more rational than the individuals. This implies that firms, most of the times or may be sometimes are more rational than the individuals.
The answer is option D.
Why has the author referred to Rutherford in the passage?
Solution
The author refers to Rutherford in the passage to emphasize that deviations from assumptions in scientific models, such as statistical mechanics, do not necessarily undermine the validity of those models on a larger scale. This analogy suggests that while there may be minor errors or deviations (such as disproving the assumption that molecules are hard elastic balls), these are typically not systematic at the level of gases. Similarly, in the beer market, minor errors or ignorance about quality are unlikely to be systematic unless certain conditions (like quality control procedures) are introduced. Through this, the author conveys that we should not mix or compare these matters. Option B best captures this point.
Option A: The author is not discussing whether molecules are elastic. The key point is that the assumptions in statistical mechanics can be questioned or disproven; however, these deviations do not significantly affect the overall functioning of the theory.
Option C: There’s no focus on students' quality or ability in the passage.
Option D: The author isn’t directly equating beer with elastic balls. Instead, Rutherford’s work on statistical mechanics is used to make a broader point about how small deviations from assumptions don’t invalidate the overall model.
Option E: The passage doesn't argue that mechanics is more amenable to statistics than gases.

Which of the following, as per author, are psychophysical goods?
1.Concrete
2.Car
3.Mobile Phone
Solution
The author specifically mentions "beer" as an example of psychophysical goods, but no other goods are categorized in the passage as psychophysical goods. Concrete, car, and mobile phone are not mentioned in the passage in the context of psychophysical goods. Therefore, Option E is the correct answer.
Analyze the following passage and provide appreciate answers for the questions that follow.
Ideas involving the theory probability play a decisive part in modern physics. Yet we will still lack a satisfactory, consistence definition of probability; or, what amounts to much the same, we still lack a satisfactory axiomatic system for the calculus of probability. The relations between probability and experience are also still in need of clarification. In investigating this problem we shall discover what will at first seem an almost insuperable objection to my methodological views. For although probability statements play such a vitally important role in empirical science, they turn out to be in principle impervious to strict falsification. Yet this very stumbling block will become a touchstone upon which to test my theory, in order to find out what it is worth. Thus, we are confronted with two tasks. The first is to provide new foundations for the calculus of probability. This I shall try to do by developing the theory of probability as a frequency theory, along the lines followed by Richard von Mises, But without the use of what he calls the ‘axiom of convergence’ (or ‘limit axiom’) and with a somewhat weakened ‘axiom of randomness’ The second task is to elucidate the relations between probability and experience. This means solving what I call the problem of decidability statements. My hope is that the investigations will help to relieve the present unsatisfactory situation in which physicists make much use of probabilities without being able to say, consistently, what they mean by ‘probability’.
The statement, “The relations between probability and experience are still in need of clarification” implies that:
Solution
Option C is the correct answer.
The passage discusses the need for clarification in the relationship between probability and experience. It acknowledges that probability plays a crucial role in empirical science but lacks a consistent definition or axiomatic system. However, it also highlights the difficulty in strictly falsifying probability statements.
The sentence, “The relations between probability and experience are still in need of clarification”, suggests that there's a distinction between probability, which is conceptualized and expressed mathematically, and experience, which refers to real-world observations and phenomena. The need for clarification in their relationship implies that they are not directly interchangeable or equivalent, supporting the idea that probability is mathematical while experience is real.
Author has talked about the two tasks in the above passage. Choose the best option from the following statements relevant to the tasks.
Solution
Author in the given passage aims for a exact and satisfactory definition of probability by clarifying the relationship between probability and experience. There are two tasks mentioned in the passage. The first is to provide new foundations for the calculus of probability. The second task is to elucidate the relations between probability and experience. Both the tasks would be important for the author to test his theory.
The answer is option E.

Which one of the following statements can be inferred from the passage?
Solution
Options A and B are obviously incorrect because "only" in the option makes it dubious. Similarly, the passage only talks about physics and not other subjects, thus neglecting option C. The passage talks about clarification as far as experience is concerned, rendering Option E wrong. Hence D is the correct answer, as the mathematical nature of physics can be inferred from the passage.
Analyze the following passage and provide appropriate answers for the questions that follow.
The ways by which you may get money almost exception lead downwards. To have done anything by which you earned money merely is to have been truly idle or worse. If the laborer gets no more than the wages which his employer pays him, he is cheated, he cheats himself. If you would get money as a writer or lecturer, you must be popular, which is to go down perpendicularly. Those services which the community will most readily pay for, it is most disagreeable to render. You are paid for being something less than a man. The State does not commonly reward a genius any more wisely. Even the poet laureate would rather not have to celebrate the accidents of royalty. He must be bribed with a pipe of wine; and perhaps another poet is called away from his muse to gauge that very pipe. The aim of the laborer should be, not to get his living, to get “a good job” but to perform well a certain work; and even in a pecuniary sense, it would be economy for a town to pay its laborers so well that they would not feel that they were working for low ends, for a livelihood merely, but for scientific, or even moral ends. Do not hire a man who does your work for money, but him who does it for love of it.
The community has no bribe that will tempt a wise man. You may raise money enough to tunnel a mountain, but you cannot raise money enough to hire a man who is minding his own business. An efficient and valuable man does what he can, whether the community pays him for it or not. The inefficient offer their inefficiency to the highest bidder, and are forever expecting to be put into office. One would suppose that they were rarely disappointed. God gave the righteous man a certificate entitling him to food and raiment, but the unrighteous man found a facsimile of the same in God’s coffers, and appropriated it, and obtained food and raiment like the former. It is one of the most extensive systems of counterfeiting that the world has seen. I did not know that mankind was suffering for want of gold. I have seen a little of it. I know that it is very malleable, but not so malleable as wit. A grain of gold will gild a great surface, but not so much as a grain of wisdom.
Which of the following would the author disagree most with?
Solution
In the first paragraph, the author mentions that to have done anything for which you earned money is to have been truly idle or worse. Here, the author’s perspective is that many forms of earning money are driven by self-interest and lower purposes, emphasizing work being done for love or intrinsic value rather than for monetary gain. Given this, the author would most likely disagree with the notion of doing work that is primarily motivated by money or that involves services or roles appealing to the public's desires in a superficial or materialistic way. Among the given options, Option D is the correct choice because betting in a casino involves gaining without effort.
Option A: This might be viewed as contributing positively to society by providing jobs
Option B: Advertising for a product like toothpaste appeals to commercial needs and might be seen as trivial or not serving a higher purpose, but the author would disagree more with Option D than the idea of advertising.
Option C: Business school can be seen as a place where one learns the tools to run businesses, which could involve both positive and negative motivations. The author need not necessarily disagree with others.
Option E: The author might criticize investment banking for focusing too much on monetary gain. However, it could still be seen as contributing to the economy in a way that gambling doesn't.
Which of the following could be a good title for the above passage?
Solution
Option A is the correct answer. The passage focuses on the relationship between money, labor, and how people work for it. It discusses how laborers are often exploited for money, the idea that work should be done for love or higher purposes, and how money can corrupt one's motivations. The other titles don't directly capture the central theme of work and money as well as this one.

The author of the passage went on to say: “We are provincial, because we do not find at home our standards; because we do not worship truth, but the reflection of truth; because we are warped and narrowed by an exclusive devotion to trade and commerce and manufactures and agriculture and the like, which are but means, and not the end.”
Which of the following, as per author, could have been the end (last words in the lines above)?
Solution
Option B is the correct answer. The author discusses the idea that people focus too much on means (like trade, commerce, and agriculture), which are necessary but should not be the end goal. The passage emphasizes the need for something higher, like performing work for love or moral purposes rather than just for a livelihood. This suggests that the "end" the author refers to could be the realization of self, which aligns with the pursuit of truth, wisdom, and higher moral or intellectual goals.
The other options are not the correct interpretation of the "end" as per the given lines of the passage.
I heartily accept the motto, “That government is best which governs least”; and I should like to see it acted up to more rapidly and systematically. Carried out, it finally amounts to this, which also I believe--“That government is best which governs not at all”; and when men are prepared for it, that will be the kind of governments which they will have. Government is at best but an expedient; but most government are usually, and all governments are sometimes, inexpedient. The objection which have been brought against a standing army, and they are many and weighty, and deserve to prevail, may also at last be brought against a standing government. The standing army is only an arm of the standing government. The government itself, which is only the mode which the people have chosen to execute their will, is equally liable to be abused and perverted before the people can act through it.
After all, the practical reason why, when the power is once in the hands of the people, a majority are permitted, and for a long period continue, to rule is not because they are most likely to be in the right, nor because this seems fairest to the minority, but because they are physically the strongest. But a government in which the majority rules in all cases cannot be based on justice, even as far as men understand it. Can there not be a government in which the majorities do not virtually decide right and wrong, but conscience? -- in which majorities decide only those questions to which the rule of expediency is applicable? Must the citizen ever for a moment or in the least degree, resign his conscience to legislator? Why has every man a conscience then? I think that we should be men first, and subjects afterward. It is not desirable to cultivate a respect for the law, so much as for the right The only obligation which I have a right to assume is to do at any time what I think right. It is truly enough said that a corporation has no conscience; but a corporation of conscientious men is a corporation with a conscience. Law never made men a whit more just; and, by means of their respect for it, even the well-disposed are daily made the agents on injustice.
According to the author of the paragraph, army is _____________ ?
Solution
The author argues against a standing army by stating that the objections to it are "many and weighty" and that they "deserve to prevail." This means that there are many valid objections against the standing army rendering it unnecessary. Therefore, Option E is the correct answer.
Option A: The author does not argue that an army is necessary. Instead, he criticizes standing armies and suggests that objections to them "deserve to prevail."
Option B: The author does not point out its fallibility but rather criticizes standing armies and suggests that objections to them "deserve to prevail." s
Option C: The author does not say that an army is essential. Instead, he suggests that it is not needed.
Option D: The author does not claim that an army is a "necessary" evil; instead, he argues against its very existence.
In general, when would government of majority be good for minorities?
Solution
In the second paragraph, author mentioned, 'Can there not be a government in which the majorities do not virtually decide right and wrong, but conscience?'. He says that conscience should be the one which decides right or wrong. The answer is option D.
While Options A,B and C could seem plausible, the author suggests that the government of majorities would be good for minorities when it is conscientious.
Option E is an extreme option and can be eliminated.

Which of the following statements would the author agree the most with?
Solution
The author argues that individuals should follow their conscience rather than blindly obeying government laws. He says "I think that we should be men first, and subjects afterward."
From this, we can infer that the author believes people should prioritize doing what is morally right over merely following laws. He also states that governments can be abused and are not inherently just, reinforcing the idea that individuals are more important than governments. This is captured in Option A.
Option B: The passage does not discuss about business .
Option C: The author critiques the government but does not outright reject its existence in all cases.
Option D: The author neither addresses the concept of nations nor states that they are redundant.
Option E: The author critiques democracy, arguing that majority rule is not always just. He suggests that conscience, not the majority, should determine what is right.
Analyze the following passage and provide appropriate answers for the questions that follow.
Either explicitly or implicitly, our informants suggest that the objects that transfix them are hoped to be conduits to, rather than surrogates for, love, respect, recognition, status, security, escape, or attractiveness. These are the social relations we desire, consciously or subconsciously, beneath the objects that we find so compelling. The value of the objects that we focus our longing upon inheres less in the object or in a Lacanian search for childhood love than in the culture. The hope for the hope that an altered state of being may result keeps the cycle of desire moving. Desires are nurtured by self-embellished fantasies of a wholly different self, and they may be stimulated by external sources, including advertising, retail displays, films, television programs, stories told by other people, and the consumption behavior of real or imaginary others. But we find that the person who feels strong desire has almost always actively stimulated this desire by attending, seeking out, entertaining, and embellishing such images. The desires that occupy us are vivid and riveting fantasies that we participate in nurturing, growing, and pursuing, through self-seduction.
The social nature of desire implies that preferences of consumers are far from being independent. Yet, choice models assume that preferences of consumers act as individuals. The mimetic aspect of desire creates difficulties for using individual attitude or intention measures to predict adoption of new products whose use will be visible. The notion of desire we have derived suggests that the appeal of the desired object is not inherent in the object itself. Models that begin with preferences for product attributes or benefits are therefore problematic. The consumer, individually and jointly, has a role in constructing the object of desire, within a social context. What makes consumer desire attach to a particular object is not so much the object’s particular characteristics as the consumer’s own hopes for an altered state of being,involving an altered set of social relationships.
Consider the statement given below as true:
“The failure of men to transition from being shoppers and consumers to producers and creators has implications about their manliness.”
Which of the following statements would concur with the above idea and the theme of the main paragraph?
Solution
The paragraph states that the man wants to portray himself better than what he actually is. Option E is in accordance with this.
Hence, option E is the correct answer.
Consider the statement given below as true:
“Men use the plasticity of consumer identity construction to forge atavistic masculine identities based upon an imagined life of self-reliant, pre-modern men who lived outside the confines of cities, families, and work bureaucracies.” Which of the following statements would concur with the above idea and the theme of the main paragraph?
Solution
The passage discusses how consumer desires are often shaped by social context and nurtured through external sources like advertising, media, and social interactions. In the given context of men constructing atavistic masculine identities, this desire for a masculine identity is likely to be fulfilled through consumption that is visible to others, fitting the social and cultural framework described in the passage. Option D captures this idea.
Option A: The passage does not state or suggest that pre-modern men were anti-social. Instead, it emphasizes how desires, including those for identity construction, are socially influenced.
Option B: This is wrong.The passage highlights that consumer desires are socially constructed and often visible, but it does not suggest that products fulfilling antisocial behavior will sell more.
Option C: This is an extreme statement that is not supported by the passage.
Option E: This statement is too broad and vague. The passage discusses how desires are nurtured through social and cultural influences and are expressed through consumption.

Consider the statement given below as true:
“By appropriating fashion discourse, consumers generate personalized fashion narratives and metaphoric and metonymic references that negotiate key existential tensions and that often express resistance to dominant fashion norms in their social milieu or consumer culture at large.”
Which of the following statements would concur with the above idea and the theme of the main paragraph?
Solution
The passage discusses how desires are influenced by social context and external sources like advertising and media. It emphasizes how consumers actively engage in fantasies and desires and how those desires can reflect resistance to societal norms. The statement provided in the question suggests that consumers create personalized fashion narratives as a form of resistance to dominant fashion norms. Therefore, Option D concur with the above idea and the theme of the main paragraph.
In the given context, there is no gender discrimination or anything regarding attractiveness is mentioned. Therefore, options A, C and E are eliminated.
The phrase "Resist all social norms" makes option B extreme.
Answer questions based on information that is provided.
The main issues of interpretation arising from the work of professionally trained anthropologists are that they are late in colonial/post - colonial trajectories, because professional training shapes their interpretations. However, within field of interest and training, their works are most thorough and systematic
The best conclusion drawn from the above paragraph is analogous to:
Solution
The given paragraph refers to two different aspects of work and how professional training makes their work systematic, but there is no update on trajectories. The main idea is that we cannot simultaneously achieve two different aspects of a single entity. Among the given options, the same idea is reflected in option A.
The answer is option A.
Consider merit pay for teachers. Schools face constant pressure to change their management approaches to improve performance, which is usually assessed by standardized reading, math, and science scores. In most school teacher’s pay is determined by seniority, years of total teaching experience, and credentials. Pay is rarely based on performance, which is contrary to the belief among parents and private sector. Parents and business leaders lament that there are no carrots/sticks used to motivate teachers.
Consequently, there has been greater push to implement some form of merit pay to improve
the motivation. Which of the following statements will disapprove the claim of the parents and business leaders?
Solution
Parents push to implement some form of merit pay to motivate teachers. In this question, we need to disapprove of the statement made by parents. Options A states that teachers are self-motivated and don't need external input.
The answer is option A.
Read the following newspaper report: In a new study by Harvard School of Public Health (HSPH), researchers explored how caffeine can serve as a “mild anti - depressant”. They concluded that “drinking
several cups of coffee daily appears to reduce the risk of suicide”. Data pulled in from three large studies in the US showed that the suicide risk of those who drank two to four cups of caffeinated coffee a day was
about half of those who drank decaffeinated coffee or very little or no coffee. In the studies, a respondent’s caffeine consumption was assessed every four years through a questionnaire. The respondents were all adults, and the study was published online. The authors, however, cautioned the public from increasing coffee intake as it could result in “unpleasant side effects”. “Overall, our results suggest that there is
little further benefit for consumption above two to three cups/day or 400 mg of caffeine/day,” wrote the researchers. The authors observed that there` was no major difference in suicide risk for adults who drank two to three cups a day from those who drank four cups or more.
Which of the following shaped graph would best capture the above paragraph(x - axis represents “coffee intake” and “Y - axis represents “suicidal tendency”)?
Solution
According to the given paragraph, coffee intake is indirectly proportional to suicidal tendency, i.e. when caffeine intake is low the risk of suicide is higher and decreases with the increase of coffee intake. Graph should be similar to the graph of xy = c.

The answer is option E.
A group of nine runners will finish the 400 meters race in a certain order. The runners are:
Ashok, Benjamin, Chetan, Divya, Eshant, Girish, Himani, and Irravaty. They all finish at different times, and their finishing order is as follow:
1.Faneesh finishes before Ashok
2.Divya finishes before Benjamin and Eshant
3.Irravaty finishes after Chetan
4.Girish finishes after Ashok
Which is the best position Girish can finish?
Solution
Girish finishes after Ashok who finishes after Faneesh. No information about anybody else finishing before Girish can be deduced from the given clues. So, the best positon at which Girish can finish the race is third.
Hence, option C is the correct answer.
Read the following case – let and answer the that follow
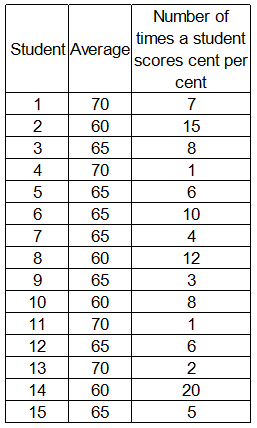
Ms. Banerjee, class teacher for 12th standard, wants to send teams (based on past performance) of three students each to district, state, national, and international competition in mathematics.Till now, every student of the class has appeared in 100 school level tests. The students had following distribution of marks in the tests, in terms of “average” and “number of times a student scored cent per cent marks”.
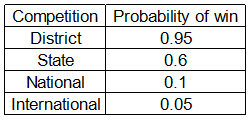
Ms. Banerjee has carefully studied chances of her school winning each of the competitions. Based on in - depth calculations, she realized that her school is quite likely to win district level competition but has low chances of winning the international competition. She listed down the following probabilities of wins for different competitions. Prize was highest for international competition and lowest for district level competition (in that order).
All the students are studying in the school for last twelve years. She wanted to select the best team for all four competitions (Ms. Banerjee had no other information to select students).
Which of three members should form the team for the International competition?
Solution
The probability of winning an international competition is the lowest. So, most consistent scorers must be chosen who have scored the highest most number of times. Thus, 2, 8 and 14 is an appropriate choice.
Hence, option B is the correct answer.
Which of the following members should constitute the team for the district level competition?
Solution
Since the probability of winning is highest at the district level, the students who have the highest average and scored 100 least number of times must be selected. So, she must select 4, 11 and 13.
Hence, option D is the correct answer.
Ms. Banerjee has to select the team for national competition after she has selected the team for
international competition. A student selected for international competition cannot be a part of national competition. Which is the best team for the national competition?
Solution
Ms Banarjee selects the national team only after selecting the international team :
For selection of international team our choices must be focused on people with high number of cent percents because the probability of success is low need some one securing high cent percent and low averages so that we do not waste people with higher averages in a case where the chances of success are very low .
Hence we select 2, 8, 14 who are having an average of 60 which is the lowest and high cent percents which are 12 +15+20 =47.
Since 2,8,14 are selected they cannot be used while selecting the national team.Now while selecting the national team the probability is success is relatively low but still improved from the international competition and since 2,8,14 are already selected we cannot use them and coming to the first option 1,4,7 has people with very high averages and lower cent percentage and hence does not fit our criteria.
The best option is option D where people are averaged in relatively better and also holds good number of cent percents.
Read the following case - let and answer the question that follow
Krishna Reddy was the head of a pharmaceutical company that was trying to develop a new product. Reddy, along with his friend Prabhakar Rao, assessed that such products had mixed success. Reddy and Rao realized that if a new product (a drug) was a success, it may result in sales of 100 crores but if it is unsuccessful, the sales may be only 20 crores. They further assessed that a new drug was likely to be successful 50% of times. Cost of launching the new drug was likely to be 50 crores.
How much profit can the company expect to earn if it launches the new drug(suppose there are no additional costs)?
Solution
The total cost incurred =50 Cr
The earning = 100$$\times\ $$1/2 + 20$$\times\ $$1/2=60 Cr.
Hence the net profit=10 Cr.
Now, Reddy and Rao were in a quandary whether the company should go ahead and market the drug. They
contacted Raj Adduri, a common friend for advice. Adduri was of the opinion that given the risky nature of the launch, it may be a better idea to test the market. Rao and Reddy realized test marketing would cost 10
crores. Adduri told them the previous test marketing results have been favourable 70% of times and success rate of products favourably tested was 80%. Further, when test marketing results were unfavourable; the products have been successful 30% of the times.
How much profit can the company expect to make if the product is launched after favourable test marketing results(assume there are no additional costs)?
Solution
Total Cost = 50+10=60 Cr
Chances of success after favorable results= 80%
Expected return = 100$$\times\ $$0.8+ 20$$\times\ $$0.2=84Cr
Expected profit= 84-60=24Cr
Now, Reddy and Rao were in a quandary whether the company should go ahead and market the drug. They
contacted Raj Adduri, a common friend for advice. Adduri was of the opinion that given the risky nature of launch, it may be a better idea to test the market. Rao and Reddy realized test marketing would cost 10
crores. Adduri told them the previous test marketing results have been favorable 70% of times and success
rate of products favorably tested was 80%.Further, when test marketing results were unfavorable; the products have been successful 30% of the times.
What is the probability of product failure if Reddy and Rao decide to test market it?
Solution
Results have been favourable 70% of times and success rate of products favourably tested was 80%.
Further, when test marketing results were unfavourable i.e. 30 %; the products have been successful 30% of the times.
The probability of product failure if Reddy and Rao decide to test market it= 7/10$$\times\ $$2/10 + 3/10$$\times\ $$7/10=35/100
=0.35
Now, Reddy and Rao were in a quandary whether the company should go ahead and market the drug. They
contacted Raj Adduri, a common friend for advice. Adduri was of the opinion that given the risky nature of launch, it may be a better idea to test the market. Rao and Reddy realized test marketing would cost 10
crores. Adduri told them the previous test marketing results have been favorable 70% of times and success
rate of products favorably tested was 80%.Further, when test marketing results were unfavorable; the products have been successful 30% of the times.
If Rao and Reddy decide to launch the product despite unfavourable test marketing, how much profit can the company expect to earn?
Solution
After testing the market the total cost incurred= 50+10=60Cr.
The product will be a success 30% of times after the marketing test is unfavourable. So the probability of success is 0.3.
The probability of failure= 0.7.
The expected return is = 20 $$\times\ $$ 0.7+100$$\times\$$0.3 = 44Cr.
Total profit= 44-60 Cr=-16Cr.
Please read the three reports (newspaper articles) on ranking of different players and products in smart phones industry and answer the questions that follow.
Report 1: (Feb, 2013)
Apple nabs crown as current top US mobile phone vendor
Apple’s reign may not be long, as Samsung is poised to overtake Apple in April, 2013. For the first time since Apple entered the mobile phone market in 2007, it has been ranked the top mobile phone vendor in the US. For the latter quarter of 2012, sales of its iPhone accounted for 34 percent of all mobile phone sales in the US - including feature phones - according to the latest data from Strategy Analytics.
While the iPhone has consistently been ranked the top smartphone sold in the US, market research firm NPD noted that feature phone sales have fallen off a cliff recently, to the point where 8 out of every 10 mobile phones sold in the US are now smartphones. That ratio is up considerably from the end of 2011, when smartphones had just cracked the 50 percent mark. Given this fact it’s no surprise that Apple, which only sells smartphones, has been able to reach the top of the overall mobile phone market domestically. For the fourth quarter of 2012, Apple ranked number one with 34 percent of the US mobile market, up from 25.6 percent year over year. Samsung grew similarly, up to 32.3 percent from 26.9 percent - but not enough to keep from slipping to second place. LG dropped to 9 percent from 13.7 percent, holding its third place spot. It should be noted that Samsung and LG both sell a variety of feature phones in addition to smartphones. Looking only at smartphones, the ranking is a little different according to NPD. Apple holds the top spot with 39 percent of the US smartphone market, while Samsung again sits at number two with 30 percent. Motorola manages to rank third with 7 percent, while HTC dropped to fourth with 6 percent. In the US smartphone market, LG is fifth with 6 percent. Note how the percentages aren’t all that different from overall mobile phone market share - for all intents and purposes, the smartphone market is the mobile phone market in the US going forward. Still, Samsung was the top mobile phone vendor overall for 2012, and Strategy Analytics expects Samsung to be back on top soon. “Samsung had been the number one mobile phone vendor in the US since 2008, and it will surely be keen to recapture that title in 2013 by launching improved new models such as the rumored Galaxy S4”. And while Apple is the top vendor overall among smartphones, its iOS platform is still second to the Android platform overall. Samsung is the largest vendor selling Android-based smartphones, but Motorola, HTC, LG, and others also sell Android devices, giving the platform a clear advantage over iOS both domestically and globally.
Report 2: Reader’s Response (2013, Feb)
I don’t actually believe the numbers for Samsung. Ever since the debacle in early 2011, when Lenovo called into question the numbers Samsung was touting for tablet shipments, stating that Samsung had only sold 20,000 of the 1.5 million tablets they shipped into the US the last quarter of 2010, Samsung (who had no response to Lenovo) has refused to supply quarterly sales numbers for smartphones or tablets. That’s an indication that their sales aren’t what analysts are saying. We can look to several things to help understand why. In the lawsuit between Apple and Samsung here last year, both were required to supply real sales numbers for devices under contention. The phones listed turned out to have sales between one third and one half of what had been guessed by IDC and others. Tablet sales were even worse. Of the 1.5 million tablets supposedly shipped to the US during that time, only 38,000 were sold. Then we have the usage numbers. Samsung tablets have only a 1.5% usage rate, where the iPad has over 90%. Not as much a difference with the phones but it’s still overwhelmingly in favor of iPhone. The problem is that with Apple’s sales, we have actual numbers to go by. The companies who estimate can calibrate what they do after those numbers come out. But with Samsung and many others, they can’t ever calibrate their methods, as there are no confirming numbers released from the firms. A few quarters ago, as a result, we saw iSupply estimate Samsung’s smartphone sales for the quarter at 32 million, with estimates from others all over the place up to 50 million. Each time some other company reported a higher number for that same quarter, the press dutifully used that higher number as THE ONE. But none of them was the one. Without accurate self-reporting of actual sales to the end users, none of these market share charts are worth a damn!
Report 3: Contradictory survey (Feb, 2013)
iPhone5 Ranks Fifth In U.S. Customer Satisfaction Survey inShare. The iPhone5 ranks fifth in customer satisfaction according to the results of a recent survey from OnDevice Research, a mobile device research group. In the poll, they asked 320,000 smartphone and tablet users from six different countries, how satisfied they were with their devices. According to 93,825 people from the US, Motorola Atrix HD is the most satisfying and Motorola’s Droid Razr took second spot. HTC Corp (TPE : 2498)’s Rezound 4G and Samsung Galaxy Note 2 took third and fourth spots, while Apple’s iPhone5 landed in fifth spot. It appears that Apple may be lagging in consumer interest. OnDevice Research, Sarah Quinn explained, “Although Apple created one of the most revolutionary devices of the past decade, other manufactures have caught up, with some Android powered devices now commanding higher levels of user satisfaction.” Despite the lower rankings, things aren’t looking too bad for Apple Inc. (NASDAQ:AAPL) elsewhere. In the United Kingdom, they ranked second place, right after HTC One X. Interesting enough, Apple did take top spot for overall satisfaction of mobile device, whereas Google Inc. (NASDAQ:GOOG) ranked second. Motorola Mobility Holdings Inc. (NYSE:NOK) took third, fourth, and fifth places respectively, while Sony Ericsson trailed behind at sixth place. The survey sampled mobile device users in the following countries: United States, United Kingdom, France, Germany, Japan, and Indonesia. Although OnDevice didn’t share the full list of devices mentioned in the survey, it does show some insight to what customers want. Unfortunately, there were still many questions regarding the survey that were left unanswered. Everyone wants to know why Google Inc. (NASDAQ:GOOG) was on the list when they are not an actual smartphone maker and why was Samsung Electronics Co., Ltd. (LON:BC94) on the bottom of the satisfaction list when the brand is leading elsewhere.

Source: 92.825 US mobile users, July 2012 - January 2013
Fortunately, those questions were answered by OnDevice Research’s representative. He explained that the survey was conducted on mobile web where the survey software could detect the taker’s device and since user’s rate their satisfaction levels on a 1 to 10 scale, thanks to the Nexus device, Google was included.
If you analyze the three reports above, which of the following statements would be the best inference?
Solution
We do have any information to state that the given information is wrong and we do not know the sources of content given in the reports. Therefore, options A and B cannot be inferred. Options D and E cannot be inferred from the given reports.
The answer is option C.
Assume report1 and report3 are both correct, which of the following can be a reason for seemingly divergent ranks of different companies and their products?
Solution
Option A doesn't explain report 3, i.e. customer satisfaction. Option B and C are not where related to the given statement. Option D is incorrect, from given statement we cannot infer that customer satisfaction never leads to higher customer loyalty.
The answer is option E.
If report1 and report3 are both correct, which of the following can be a reason for seemingly divergent ranks reported for different companies and their products?
Solution
Report 1 talks about sales data and report 3 presents data on customer satisfaction. Among the given options, only option D answers the question. The answer is option D.
Which of the following is more likely to be a correct conclusion about the respondent/reader in report2?
Solution
The reader doesn't believe the numbers published by Samsung. He says without accurate self-reporting of actual sales to the end users, none of these market share charts are correct. The reader wants more objective data to be released by the companies.
The answer is option E.
Read the following case-let and choose the best alternative for the questions that follow.
Ajay was thinking deeply about a problem that his organization, a business consulting company, faced. Globalization had affected his company like many other companies. Despite the downturn, the current revenues remained healthy. However, Ajay knew it was inevitable that the company could not do business the same way. The complexity of managing the business had increased with time. Consultants were under pressure to deliver good and innovative solutions. The organization had consultants from different age groups having a good mix of domain and industry expertise. It was a flat organization with three levels. The biggest challenge for Ajay was to have consultants with latest knowledge who would also earn revenues. Getting additional business was a challenge as all the consultants were busy and it was very difficult to hire new consultants.
Some of the consultants were adept at applying old solutions to new problems. Ajay was not very
sure if this would work for long. Some of the clients had complained about the performance of
old and reputed consultants. Ajay was mulling over the following five solutions to tackle this problem.
1.Decrease time spent on client interaction and increase time spent for generating solutions.
2.Increase support staff to help consultants to remain updated.
3.Decrease the number of simultaneous projects handled by consultants.
4.Make it compulsory for consultants to work on inter-industry and inter-domain problems.
5.Recruit more consultants.
Which of the following would be the best sequence of decisions taken by Ajay (starting from immediate to distant)?
Solution
Statement 1 as the course of action is out of the question. Therefore, 1 is the course of action which need not be taken immediately. Therefore, options A and E are eliminated. Given that Ajay wants to make situations better, statement 3 should be one of his initial course of actions. Therefore, option D is eliminated. Among the remaining options, option B is the appropriate one.
The answer is option B.
After Ajay implemented some of the steps mentioned above, consultants wanted to renegotiate their contract with the organization. It seems that the organization had never mentioned that consultants have to work across industries and domains. Some of the old consultants were reluctant to change their ways,
while many of the younger consultants were willing to follow Ajay’s advice. Which of the following decision can be taken by Ajay to handle this situation?
Solution
Among the given approaches, only option E is the appropriate one. Only option E is a step to find the solution for the concerns raised by old consultants.
The answer is option E.
Ajay was to retire in five years and he wanted to leave behind a legacy. Order the following
activities, from the most important to the least important, that Ajay should undertake in next five year:
1.Do nothing.
2.Set a future direction for the organization in these challenging times.
3.Benchmark performance with respect to the best consulting company in industry.
4.Empower senior consultants and at the same time seek opinion of all others for handling future challenges.
5.Infuse fresh thinking by hiring outsiders.
Choose the best option from the following sequences
Solution
Doing nothing will not progress the organization. Therefore, (1) is ruled out. It is important to set a direction for the organization in this challenging time. Therefore, (2) is the most important step followed by (3) and (4). In view of necessity of ideas, it is important to hire new consultants. Hence, the order is 2, 3, 4, and 5.
The answer is option B.
Read the following case - let and answer the questions that follow
Intercontinental Business Manufacturing (IBM) was doing a roaring business. Demand of the products was high and supply of raw - material was abundant. IBM was manufacturing three different products. Some customers bought two types of products and some bought only one. The three products were “quickie - quick”, “run - of - the - mill”, and “maxi - max”. Customers were not complaining loudly. Ram, the product manager, was confused! Demand for “quickie - quick “was increasing .Raw material suppliers wanted to supply lower quality at cheaper price. It was profitable for the company to increase production .Quality department was not happy with the product. Ram met Rahim, the CEO, who, as always, wanted higher profits. He said that IBM will set up a committee for improving the quality.
What must not be done by Ram?
Solution
Since there is good demand for quickie-quick it is essential that the quality is maintained to ensure the demand doesn't fall. Therefore, options B and C can be done. Options D and E may reduce the sales for some period but it is good keeping the market in view. Only producing quickie-quick products not concerning about the quality is not a good idea. Therefore, the answer is option A.
Rahim set up a “brand” committee comprising of a few selected managers, headed by Robert. The
committee proposed that IBM should continue to manufacture the three differently branded products. It also proposed to recruit a new brand manager for improving brand image of the products. It agreed with Rahim that the company should increase the price. Rocket Singh, head of sales, was confused because he realized that customers were miffed with “run - of - the - mill” and “maxi - max”.
What should Rocket Singh do?
Solution
Options A and B doesn't address the dissatisfaction of customers. Options C and D also doesn't help in finding the reason for customer's dissatisfaction. The answer is option E.
Some of the managers in production department were discussing the problems faced in shipping
products in time. They complained that they had to undertake responsibility of creating financial and marketing plans in addition to responsibility of production planning. At the same time, finance
and marketing managers were to be involved in preparing production plans. It was expected that
this will reduce customer complaints. It was rumored that these changes were initiated by the managers educated in the U.S.
Which of the following is the best possible course of action available to the affected managers?
Solution
In the given context, we can infer that no rights violated in any manner. Therefore, options A, B and D are incorrect. Going to US for further education is irrelevant in the given context. Creating a forum for discussion may resolve the issues. The answer is option C.
Read the following case-let and answer the questions that follow
Rajinder Singh was 32 years old from the small town of Bhathinda, Punjab. Most of the families living there had middle class incomes, with about 10% of the population living below the poverty level. The population consisted of 10 percent small traders, 30 percent farmers, besides others. Rajinder liked growing up in Bhathinda, where people knew and cared about each other.
Even as a youngster it was clear that Rajinder was smart and ambitious. Neighbors would often say, “Someday you’re going to make us proud!” He always had a job growing up at Singh’s General Store - Uncle Balwant’s store. Balwant was a well-intentioned person. Rajinder loved being at the store and not just because Balwant paid him well. He liked helping customers, most of who were known by the nicknames. Setting up displays and changing the merchandise for different seasons and holidays was always exciting. Uncle Balwant had one child and off late, his interest in business had declined. But he had taught Rajinder ‘the ins and outs of retailing’. He had taught Rajinder everything, including ordering merchandise, putting on a sale, customer relations, and keeping the books.
The best part about working at the store was Balwant himself. Balwant loved the store as much as Rajinder did. Balwant had set up the store with a mission to make sure his neighbors got everything they needed at a fair price. He carried a wide variety of goods, based on the needs of the community. If you needed a snow shovel or piece of jewelry for your wife, it was no problem - Singh’s had it all. Rajinder was impressed by Balwant’s way of handling and caring for customers. If somebody was going through “hard times”, Balwant somehow knew it. When they came into the store, Balwant would make them feel comfortable, and say something like, “you know Jaswant, let’s put everything on credit today”. This kind of generosity made it easy to understand why Balwant was loved and respected throughout the community.
Rajinder grew up and went to school and college in Bhathinda. Later on, he made it to an MBA program in Delhi. Rajinder did well in the MBA course and was goal oriented. After first year of his MBA, the career advisor and Balwant advised Rajinder for an internship at Bigmart. That summer, Rajinder was amazed by the breadth and comprehensiveness of the internship experience. Rajinder got inspired by the life story of the founder of Bigmart, and the value the founder held. Bigmart was one of the best companies in the world.
The people that Rajinder worked for at Bigmart during the internship noticed Rajinder’s work ethic, knowledge, and enthusiasm for the business. Before the summer ended, Rajinder had been offered a job as a Management Trainee by Bigmart, to start upon graduation. Balwant was happy to see Rajinder succeed. Even for Rajinder, this was a dream job - holding the opportunity to move up the ranks in a big company. Rajinder did indeed move up the ranks quickly, from management trainee, to assistant store manager, to supervising manager of three stores, to the present position - Real Estate Manager, North India. This job involved locating new sites within targeted locations and community relations.
One day Rajinder was eagerly looking forward to the next assignment. When he received email for the same, his world came crashing down. He was asked to identify next site in Bhathinda. It was not that Rajinder didn’t believe in Bigmart’s explanation. What was printed in the popular press,especially the business press, only reinforced Rajinder’s belief in Bigmart. An executive viewed as one of the wisest business persons in the world was quoted as saying, “Bigmart had been a major force in improving the quality of life for the average consumer around the world offering great prices on good, giving them one stop solution for almost everything.” Many big farmers also benefitted through low prices, as middlemen were removed. At the same time, Rajinder knew that opening a new Bigmart could disrupt small business in Bhathinda. Some local stores in small towns went out of business within a year of the Bigmart’s opening.
In Bhathinda, one of the local stores Singh’s,now run by Balwant’s son, although Balwant still came in every day to “straighten out the merchandise.” As Rajinder thought about this assignment, depression set in, and the nightmares followed. Rajinder was frozen in time and space. Rajinder’s nightmares involved Balwant screaming something- although Rajinder could not make out what Balwant was saying. This especially troubled Rajinder, since Balwant never raised his voice.
Rajinder didn’t know what to do - who might be helpful? Rajinder’s spouse, who was a housewife? Maybe talking it through could lead to some positive course of action. Rajinder’s boss?Would Bigmart understand? Could Rajinder really disclose the conflict without fear? Uncle Balwant? Should Rajinder really disclose the situation and ask for advise? He wanted a solution that would make all satkeholders happy.
Who is the best person for Rajinder to talk to?
Solution
The passage doesn't mention about the knowledge Rajinder's wife has. Therefore, option A is incorrect. His boss will only be interested in expanding Bigmart's business. Therefore, option B is incorrect. Talking to his uncle Balwant, would help him in finding a way out.
The answer is option D.
After delibertation with many people and a lot of research, Rajinder came across a study published
in leading journal, which stated that most local farmers benefited because Bigmart bought agricultural produce directly from the farmers.
Which of the following actions would you prefer Rajinder to take, after he got this fresh information?
Solution
Neither (D) nor (E) will help in the expansion of Bigmark's market. Therefore, options D and E are incorrect. Options A or B cannot be the answer. Rajinder is worried about small traders. Rajinder should see this as an opportunity to take concerns of local traders and find a way out to benefit the small traders. The answer is option C.
Which is the right ascending order, in terms of proportion of population, benefitting from Bigmart, in and around Bhathinda?
Solution
Correct order: Retailers, Farmers, Customers
The answer is option C.
For the following questions answer them individually
$$x, 17, 3x - y^{2} - 2$$, and $$3x + y^{2} - 30$$, are four consecutive terms of an increasing arithmetic sequence. The sum of the four number is divisible by:
Solution
The terms $$x, 17, 3x - y^{2} - 2$$ and $$3x + y^{2} - 30$$ are in A.P.
=> Common difference = $$d = 17 - x$$ ----------Eqn(I)
$$d = 3x - y^2 - 19$$ ----------Eqn(II)
$$d = 2y^2 - 28$$ ----------Eqn(III)
From eqn(I) & (II), => $$17 - x = 3x - y^2 - 19$$
=> $$4x - y^2 = 36$$ -------Eqn(IV)
From eqn(II) & (III), => $$3x - y^2 - 19 = 2y^2 - 28$$
=> $$x - y^2 = -3$$ ---------Eqn(V)
Solving eqn(IV) & (V), we get :
$$x = 13 , y^2 = 16$$
=> Terms are = $$13,17,21,25$$
$$\therefore$$ Sum = $$13+17+21+25 = 76$$, which is divided by 2. (among the given options)
In quadrilateral PQRS, PQ = 5 units, QR = 17 units, RS = 5 units, and PS = 9 units. The length of the diagonal QS can be:
Solution

In a triangle , sum of two sides is greater than the third side and difference of two sides is less than third side.
In $$\triangle$$ PQS
=> $$QS < 9 + 5$$ => $$QS < 14$$ ------Eqn(I)
In $$\triangle$$ QRS
=> $$QS > 17 - 5$$ => $$QS > 12$$ ------Eqn(II)
From eqn(I) & (II)
=> $$12 < QS < 14$$
The sum of the possible values of X in the equation |X + 7| + |X - 8| = 16 is:
Solution
Expression : $$|x + 7| + |x - 8| = 16$$
Case 1 : $$x < -7$$
=> $$-(x + 7) - (x - 8) = 16$$
=> $$-2x + 1 = 16$$
=> $$x = \frac{-15}{2} = - 7.5$$
Case 2 : $$-7 \leq x < 8$$
=> $$(x + 7) - (x - 8) = 16$$
=> $$15 = 16$$, which is not possible.
Case 3 : $$x \geq 8$$
=> $$(x + 7) + (x - 8) = 16$$
=> $$2x - 1 = 16$$
=> $$x = \frac{17}{2} = 8.5$$
$$\therefore$$ Sum of all possible values of $$x = 8.5 - 7.5 = 1$$
There are two windows on the wall of a building that need repairs. A ladder 30 m long is placed
against a wall such that it just reaches the first window which is 26 m high. The foot of the
ladder is at point A. After the first window is fixed, the foot of the ladder is pushed backwards
to point B so that the ladder can reach the second window. The angle made by the ladder with the
ground is reduced by half, as a result of pushing the ladder. The distance between points A and B is
Solution

Given : Length of ladder = PA = P'B = 30 m and PQ = 26 m
$$\angle$$ PAQ = 2 $$\angle$$ P'BQ
To find : AB = ?
Solution : In $$\triangle$$ PAQ
=> $$(QA)^2 = (PA)^2 - (PQ)^2$$
=> $$(QA)^2 = 30^2 - 26^2 = 900 - 676$$
=> $$QA = \sqrt{224} \approx 15$$
Also, $$cos 2 \theta = \frac{QA}{PA}$$
=> $$2 \theta = cos^{-1}(\frac{15}{30})$$
=> $$2 \theta = 60$$ => $$\theta = \frac{60}{2} = 30$$
In $$\triangle$$ P'QB
=> $$cos 30 = \frac{QB}{P'B}$$
=> $$QB = \frac{\sqrt{3}}{2} \times 30$$
=> $$QB = 15 \times 1.732 = 25.98$$
$$\therefore$$ AB = QB - QA = 25.98 - 15 = 10.98 m
Amitabh picks a random integer between 1 and 999, doubles it and gives the result to Sashi. Each
time Sashi gets a number from Amitabh, he adds 50 to the number, and gives the result back to Amitabh, who doubles the number again. The first person, whose result is more than 1000, loses the game. Let ‘x’ be the smallest initial number that results in a win for Amitabh. The sum of the digits of ‘x’ is:
Solution
Let the no. chosen by Amitabh be x
In the first step, the result got by Amitabh is 2x and the result got by Shashi is 2x+50.
In the second step, the result got by Amitabh is 4x+100 and the result got by Shashi is 4x+150.
In the third step, the result got by Amitabh is 8x+300 and the result got by Shashi is 8x+350.
In the fourth step, the result got by Amitabh is 16x+700 and the result got by Shashi is 16x+750.
In the fifth step, the result got by Amitabh is 32x+1500 and the result got by Shashi is 32x+1550.
In step 5, since both of their results are greater than 1000, so step 4 will be the last step.
Since Amitabh wins the game the result of Shashi must be greater than 1000.
Now, $$16x+750\ge\ 1000$$
or $$x\ge\ 16$$
Hence the minimum value of x should be 16 and the its sum of digits is 7.
Consider four natural numbers: x, y, x + y, and x - y. Two statements are provided below:
I. All four numbers are prime numbers.
II. The arithmetic mean of the numbers is greater than 4.
Which of the following statements would be sufficient to determine the sum of the four numbers?
Solution
Natural numbers = $$x , y , (x+y) , (x-y)$$
Statement I : As all the numbers are prime, therefore, either x or y has to be 2 because otherwise (x+y) cannot be prime.
Case 1 : If x = 2, then (x-y) cannot be prime
Case 2 : If y = 2, numbers = $$(x-2) , x , (x+2)$$
These numbers are prime, hence all possibility = 3,5,7
$$\therefore$$ Sum = 2+3+5+7 = 17
Using statement II, we cannot find the required sum, as no specific value of mean is given.
Thus, statement I alone is sufficient.
Triangle ABC is a right angled triangle. D and E are mid points of AB and BC respectively. Read
the following statements.
I. AE = 19
II. CD = 22
III. Angle B is a right angle.
Which of the following statements would be sufficient to determine the length of AC?
Solution
ABC is right angled triangle. D and E are mid points of AB and BC respectively.
As it is not given that which angle is 90°. So we need statement (III) to find the value of AC.

Whereas using statement (I) & (II) alone, we cannot find the value of AC.
But using all the three statements. We can find value of $$(AB)^2 + (BC)^2$$.
Hence, the value of $$AC = \sqrt{(AB)^2 + (BC)^2}$$ using Pythagoras Theorem.
=> Ans - (E) : All statements are required.
There are two circles $$C_{1}$$ and $$C_{2}$$ of radii 3 and 8 units respectively. The common internal tangent, T, touches the circles at points $$P_{1}$$ and $$P_{2}$$ respectively. The line joining the centers of the circles intersects T at X. The distance of X from the center of the smaller circle is 5 units. What is the length of the line segment $$P_{1} P_{2}$$ ?
Solution

Given : $$OP_1 = 3 , O'P_2 = 8 , OX = 5$$ units
To find : $$P_1P_2 = ?$$
Solution : In $$\triangle OP_1X$$
=> $$(P_1X)^2 = (OP_1)^2 - (OX)^2$$
=> $$(P_1X)^2 = 5^2 - 3^2 = 25 - 9$$
=> $$P_1X = \sqrt{16} = 4$$
In $$\triangle OP_1X$$ and $$\triangle O'P_2X$$
$$\angle OXP_1 = O'XP_2$$ (Vertically opposite angles)
$$\angle OP_1X = O'P_2X = 90$$
=> $$\triangle OP_1X \sim \triangle O'P_2X$$
=> $$\frac{XP_1}{XP_2} = \frac{OP_1}{O'P_2}$$
=> $$XP_2 = 4 \times \frac{8}{3} = 10.66$$
$$\therefore P_1P_2 = P_1X + XP_2 = 4 + 10.66 = 14.66$$ units
Consider the formula, $$S=\frac{\alpha\times\omega}{\tau+\rho\times\omega}$$ positive integers. If ⍵ is increased and ⍺, τ and ρ are kept constant, then S:
Solution
Expression : $$S=\frac{\alpha\times\omega}{\tau+\rho\times\omega}$$
=> $$\frac{1}{S} = \frac{\tau+\rho\times\omega}{\alpha\times\omega}$$
=> $$\frac{1}{S} = \frac{\tau}{\alpha \omega} + \frac{\rho}{\omega}$$
Since, $$\tau, \rho$$ and $$\alpha$$ are constant,
=> $$\frac{1}{S} = \frac{k_1}{\omega} + k_2$$
Thus, $$S \propto \omega$$
$$\therefore$$ When $$\omega$$ increases, S increases.
Prof. Suman takes a number of quizzes for a course. All the quizzes are out of 100. A student can get an A grade in the course if the average of her scores is more than or equal to 90.Grade B is awarded to a student if the average of her scores is between 87 and 89 (both included). If the average is below 87, the student gets a C grade. Ramesh is preparing for the last quiz and he realizes that he will score a minimum of 97 to get an A grade. After the quiz, he realizes that he will score 70, and he will just manage a B. How many quizzes did Prof. Suman take?
Solution
Grade A $$\geq$$ 90 and Grade B = 87 to 89
If Ramesh scores 70 instead of 97, => Change of marks = 97 - 70 = 27
It creates a change from grade A to B, this means an overall change in average by
= Minimum marks for grade A - Minimum marks for Grade B = 90 - 87 = 3
$$\therefore$$ Number of subjects = $$\frac{27}{3} = 9$$
A polynomial y=$$ax^{3} + bx^{2 }+ cx + d$$ intersects x-axis at 1 and -1, and y-axis at 2. The value of b is:
Solution
Expression : $$ax^{3} + bx^{2 }+ cx + d$$
When it intersects x-axis at x = 1, => Point = (1,0)
=> $$a(1)^3 + b(1)^2 + c(1) + d = 0$$
=> $$a + b + c + d = 0$$ --------Eqn(I)
Similarly at (-1,0)
=> $$a(-1)^3 + b(-1)^2 + c(-1) + d = 0$$
=> $$-a + b -c + d = 0$$ => $$(a + c) = (b + d)$$
Substituting it in eqn(I), we get :
=> $$2 (b + d) = 0$$ => $$b + d = 0$$ ---------Eqn(II)
When it intersects y-axis at = 2, => Point = (0,2)
=> $$a(0)^3 + b(0)^2 + c(0) + d = 2$$
=> $$d = 2$$
Substituting it in Eqn(II), => $$b = -2$$
The probability that a randomly chosen positive divisor of $$10^{29}$$ is an integer multiple of $$10^{23}$$ is: $$a^{2} /b^{2} $$, then ‘b - a’ would be:
Solution
Number of factors of $$10^{29} = 2^{29} \times 5^{29}$$
= $$30 \times 30 = 900$$
Factors of $$10^{29}$$ which are multiple of $$10^{23}$$
= $$10^6 = 2^6 \times 5^6$$
= $$7 \times 7 = 49$$
=> Required probability = $$\frac{49}{900} = \frac{a^2}{b^2}$$
=> $$\frac{a}{b} = \frac{7}{30}$$
$$\therefore b - a = 30 - 7 = 23$$
Circle $$C_{1}$$ has a radius of 3 units. The line segment PQ is the only diameter of the circle which is parallel to the X axis. P and Q are points on curves given by the equations $$y = a^{x}$$ and $$y = 2a^{x}$$ respectively, where a < 1. The value of a is:
Solution

Radius = 3 units, => Diameter = PQ = 6 units
y-coordinates of P and Q are same as PQ is parallel to x-axis
x-coordinates of P and Q will have a difference of 6 units.
Equating y-coordinate of P and Q
=> $$a^x = 2 a^{x + 6}$$
=> $$\frac{1}{2} = \frac{a^{x + 6}}{a^x}$$
=> $$a^{x + 6 - x} = \frac{1}{2}$$
=> $$a = \frac{1}{\sqrt[6]{2}}$$
Consider a rectangle ABCD of area 90 units. The points P and Q trisect AB, and R bisects CD. The
diagonal AC intersects the line segments PR and QR at M and N respectively. What is the area of the quadrilateral PQNM?
Solution
Let us draw the figure according to the available information,
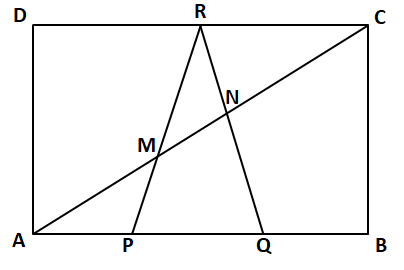
In $$\triangle$$ AMP and $$\triangle$$ CMR
$$\angle$$ MAP = $$\angle$$ MCR
$$\angle$$ AMP = $$\angle$$ CMR
Therefore, we can say that $$\triangle$$ AMP $$\sim$$ $$\triangle$$ CMR
Hence, we can say that $$\dfrac{AP}{CR}=\dfrac{MP}{MR}$$
$$\Rightarrow$$ $$\dfrac{AB/3}{AB/2}=\dfrac{MP}{MR}$$
$$\Rightarrow$$ $$MR=\dfrac{3}{2}*MP$$
Therefore, we can say that $$\Rightarrow$$ $$MR=\dfrac{3}{5}*RP$$ ... (1)
Similarly, in $$\triangle$$ ANQ and $$\triangle$$ CNR
$$\angle$$ NAQ = $$\angle$$ NCR
$$\angle$$ ANQ = $$\angle$$ CNR
Therefore, we can say that $$\triangle$$ ANQ $$\sim$$ $$\triangle$$ CNR
Hence, we can say that $$\dfrac{AQ}{CR}=\dfrac{NQ}{NR}$$
$$\Rightarrow$$ $$\dfrac{2AB/3}{AB/2}=\dfrac{NQ}{NR}$$
$$\Rightarrow$$ $$NR=\dfrac{3}{4}*NQ$$
Therefore, we can say that $$\Rightarrow$$ $$NR=\dfrac{3}{7}*RQ$$ ... (2)
In $$\triangle$$ RMN and $$\triangle$$ RPQ
$$\dfrac{\text{Area of triangle RMN}}{\text{Area of triangle RPQ}} = \dfrac{0.5*RM*RN*sinMRN}{0.5*RP*RQ*sinPRQ}$$
$$\text{Area of triangle RMN}=\dfrac{3}{5}*\dfrac{3}{7}*\text{Area of triangle RPQ}$$
We know that, Area of triangle RPQ = 1/6*Area of rectangle ABCD = 1/6*90 = 15 sq. units
$$\Rightarrow$$ $$\text{Area of triangle RMN}=\dfrac{3}{5}*\dfrac{3}{7}*15$$ = $$\dfrac{27}{7}$$ sq. units
Hence, the area of the quadrilateral PQNM = 15 - $$\dfrac{27}{7}$$ = $$\dfrac{78}{7}=11\dfrac{1}{7}$$ sq. units. Therefore, option D is the correct answer.
Two numbers, $$297_{B}$$ and $$792_{B}$$ , belong to base B number system. If the first number is a factor of the second number then the value of B is:
Solution
In Base B, $$297_B = 2B^2 + 9B + 7$$
and $$792_B = 7B^2 + 9B + 2$$
It is given that $$297_{B}$$ is a factor of $$792_{B}$$
=> $$\frac{7B^2 + 9B + 2}{2B^2 + 9B + 7}$$ must be an integer
=> $$\frac{(2B^2 + 9B + 7) + (5B^2 - 5)}{2B^2 + 9B + 7}$$
=> $$\frac{5B^2 - 5}{2B^2 + 9B + 7} + 1 = k$$
=> $$5B^2 - 5 = (2B^2 + 9B + 7) k$$ (where $$k$$ is factor)
Put $$k = 1$$
=> $$5B^2 - 5 = 2B^2 + 9B + 7$$
=> $$B^2 - 3B - 4 = 0$$
=> $$(B - 4) (B + 1) = 0$$
=> $$B = 4 , -1$$
Since, B is a base,so B must be greater than 9. Hence, it is not possible
Put $$k = 2$$
=> $$5B^2 - 5 = 4B^2 + 18B + 14$$
=> $$B^2 - 18B - 19 = 0$$
=> $$(B - 19) (B + 1) = 0$$
=> $$B = 19 , -1$$
$$\therefore B = 19$$
A teacher noticed a strange distribution of marks in the exam. There were only three distinct
scores: 6, 8 and 20. The mode of the distribution was 8. The sum of the scores of all the students was 504. The number of students in the in most populated category was equal to the sum of the number of students with lowest score and twice the number of students with the highest score. The total number of students in the class was:
Solution
Let $$x, y, z$$ be the number of students getting 6, 8 and 20 marks respectively.
=> $$6x + 8y + 20z = 504$$ -------------Eqn(I)
Since, the mode is 8, => Most populated category = $$y$$
=> $$y = x + 2z$$
=> $$x = y - 2z$$ -------------Eqn(II)
Substituting it in eqn(I), we get :
=> $$(6y - 12z) + 8y + 20z = 504$$
=> $$14y + 8z = 504$$
By hit and trial, since $$x,y,z$$ are integers, we get : $$y = 32$$ and $$z = 7$$
Putting it in Eqn(II), => $$x = 32 - 2 \times 7 = 18$$
$$\therefore$$ Total students = $$x + y + z = 18 + 32 + 7 = 57$$
Read the following instruction carefully and answer the question that follows:
Expression $$\sum_{n=1}^{13}\frac{1}{n}$$ can also be written as $$\frac{x}{13!}$$ What would be the remainder if x is divided by 11?
Solution
Expression : $$\sum_{n=1}^{13}\frac{1}{n} = \frac{x}{13!}$$
=> $$\frac{1}{1} + \frac{1}{2} + \frac{1}{3} + ...... + \frac{1}{13} = \frac{x}{13!}$$
=> $$x = \frac{13!}{1} + \frac{13!}{2} + \frac{13!}{3} + ......... + \frac{13!}{13}$$
Now, if $$x$$ is divided by 11
=> $$\frac{13! + \frac{13!}{2} + \frac{13!}{3} + ......... + \frac{13!}{13}}{11}$$
All terms are divisible by 11 except $$\frac{13!}{11}$$
$$\therefore$$ Remainder if x is divided by 11 = Remainder of $$\frac{13!}{11 \times 11}$$
= $$(10! \times 12 \times 13) \% 11$$
= $$(10 \times 1 \times 2) \% 11 = 20 \% 11 = 9$$
A rectangular swimming pool is 48 m long and 20 m wide. The shallow edge of the pool is 1 m deep.
For every 2.6 m that one walks up the inclined base of the swimming pool, one gains an elevation of 1 m. What is the volume of water (in cubic meters), in the swimming pool? Assume that the pool is filled up to the brim.v
Solution

For every 2.6 m that one walks along the slanting part of the pool, there is a height of 1 m that is gained.
=> $$\frac{AC}{BC} = \frac{2.6}{1}$$
=> $$AC = 2.6 \times BC$$
Also, dimensions of cuboidal part = $$48 \times 20 \times 1$$
In $$\triangle$$ ABC
=> $$(AC)^2 = (AB)^2 + (BC)^2$$
=> $$(2.6 \times BC)^2 = (48)^2 + (BC)^2$$
=> $$6.76 (BC)^2 - (BC)^2 = 2304$$
=> $$(BC)^2 = \frac{2304}{5.76} = 400$$
=> $$BC = \sqrt{400} = 20$$ m
$$\therefore$$ Volume of water in the pool = Volume of cuboid + Volume of triangle
= $$(l \times b \times h) + (\frac{1}{2} \times AB \times BC) \times height$$
= $$(48 \times 20 \times 1) + (\frac{1}{2} \times 48 \times 20 \times 20)$$
= $$960 + 9600 = 10560 m^3$$
The value of the expression: $$\sum_{i=2}^{100}\frac{1}{log_{i}100!}$$ is:
Solution
Expression : $$\sum_{i = 2}^{100} \frac{1}{log_{i}100!}$$
= $$\frac{1}{log_2 100!} + \frac{1}{log_3 100!} + \frac{1}{log_4 100!} +$$ ..... $$+ \frac{1}{log_{100} 100!}$$
We know that $$\frac{1}{log_b a} = log_a b$$
= $$log_{100!} 2 + log_{100!} 3 + log_{100!} 4 +$$ ..... $$+ log_{100!} 100$$
Also, $$log_a b + log_a c = log_a (b \times c)$$
= $$log_{100!} (2 \times 3 \times 4 \times 5 \times ..... \times 100)$$
= $$log_{100!} 100! = 1$$
There are two squares S 1 and S 2 with areas 8 and 9 units, respectively. S 1 is inscribed within S 2 , with one corner of S 1 on each side of S 2 . The corners of the smaller square divides the sides of
the bigger square into two segments, one of length ‘a’ and the other of length ‘b’, where, b > a. A possible value of ‘b/a’, is:
Solution

Area of $$S_1 = 8$$ sq. units
=> Side of $$S_1 = PS = \sqrt{8} = 2 \sqrt{2}$$ units
Similarly, Side of $$S_2 = CD = \sqrt{9} = 3$$ units
=> $$a + b = 3$$
In $$\triangle$$ PDS
=> $$b^2 + a^2 = 8$$
=> $$b^2 + (3 - b)^2 = 8$$
=> $$b^2 + 9 + b^2 - 6b = 8$$
=> $$2b^2 - 6b + 1 = 0$$
=> $$b = \frac{6 \pm \sqrt{36 - 8}}{4} = \frac{6 \pm \sqrt{28}}{4}$$
=> $$b = \frac{3 + \sqrt{7}}{2}$$ $$(\because b > a)$$
=> $$a = 3 - \frac{3 + \sqrt{7}}{2} = \frac{3 - \sqrt{7}}{2}$$
$$\therefore \frac{b}{a} = \frac{\frac{3 + \sqrt{7}}{2}}{\frac{3 - \sqrt{7}}{2}}$$
= $$\frac{3 + \sqrt{7}}{3 - \sqrt{7}} \approx 15.9$$
Diameter of the base of a water - filled inverted right circular cone is 26 cm. A cylindrical pipe, 5 mm in radius, is attached to the surface of the cone at a point. The perpendicular distance
between the point and the base (the top) is 15 cm. The distance from the edge of the base to the
point is 17 cm, along the surface. If water flows at the rate of 10 meters per minute through the
pipe, how much time would elapse before water stops coming out of the pipe?
Solution

Radius of cone = $$BP = 13$$ cm
In $$\triangle$$ ABC
=> $$(AB)^2 = (BC)^2 - (AC)^2$$
=> $$(AB)^2 = 17^2 - 15^2 = 289 - 225$$
=> $$AB = \sqrt{64} = 8$$ cm
=> AP = OC = $$BP - AB = 13 - 8 = 5$$ cm
Let time elapsed before water stops coming out of the pipe = $$T$$ min
Volume of frustum = Volume discharged
=> $$\frac{1}{3} \pi h (R^2 + r^2 + R r) = \pi (0.5)^2 \times f \times T$$ (where f is the flowrate given by 10m/s = 1000cm/s)
(Total volume = Cross sectional area of pipe $$\times$$ flowrate $$\times$$ Total time)
=> $$\frac{1}{3} \times 15 \times (13^2 + 5^2 + 13 * 5) = 0.25 \times 1000 \times T$$
=> $$5 \times 259 = 250 \times T$$
=> $$T = \frac{259}{50} = 5.18$$ mi
Aditya has a total of 18 red and blue marbles in two bags (each bag has marbles of both colors). A
marble is randomly drawn from the first bag followed by another randomly drawn from the
second bag, the probability of both being red is 5/16. What is the probability of both marbles being blue?
Solution
Probability of both marbles being red = Probability of red from 1st * probability of red from 2nd
= $$\frac{5}{16}$$
$$\because$$ Each bag has marbles of both colors and probability cannot be greater than 1
=> $$\frac{5}{16} = \frac{5}{8} \times \frac{1}{2}$$
where, probability of red marbles from 1st bag = $$\frac{5}{8}$$
=> Probability of blue marbles from 1st bag = $$1 - \frac{5}{8} = \frac{3}{8}$$
Similarly, Probability of red marbles from 1st bag = $$\frac{1}{2}$$
=> Probability of blue marbles from 2nd bag = $$1 - \frac{1}{2} = \frac{1}{2}$$
$$\therefore$$ Probability of both blue marbles = $$\frac{3}{8} \times \frac{1}{2}$$
= $$\frac{3}{16}$$
Answer the questions based on the given data on the tourism sector in India.

.
.
.
.
.
.
.
.
.
.
.
.
.
.
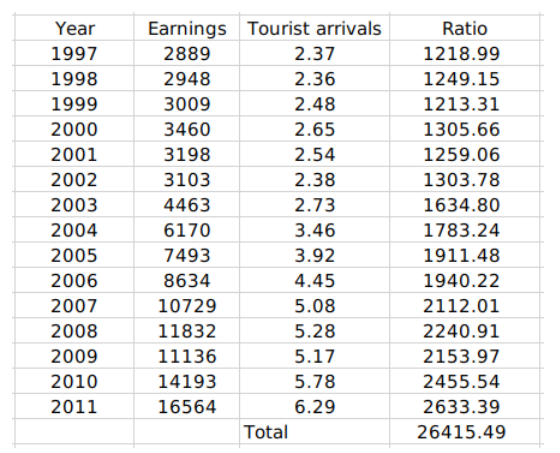
In which of the following years the percentage increase in the number of Indians going abroad was greater than the percentage increase in the number of domestic tourists?
Solution

From the above table, it is clear that the percentage increase in the number of Indians going abroad was greater than the percentage increase in the number of domestic tourists
for the years 2005 and 2007
C is the correct answer.
In which of the following years was the rupee cheapest with respect to the dollar?
Solution

from the above table, it is clear that the value of rupee wrt to the dollar is cheapest in the year 2002
Hence B is the correct answer.
Let ‘R’ be the ratio of Foreign Exchange Earnings from Tourism in India (in US $ million) to Foreign Tourist Arrivals in India (in million). Assume that R increases linearly over the years. If we draw a pie chart of R for all the years, the angle subtended by the biggest sector in the pie chart would be approximately:
Solution

If we try to plot a pie chart using the values of R for all the years, 2011 will subtend maximum value since its R value is maximum among all the years.
Angle = $$\frac{2633.39}{26415.49}\times\ 360^0$$
=35.88 = $$36^{0}$$ approximately.
C is the correct answer.
Answer the questions based on the following information given below.
The exhibit given below compares the countries (first column) on different economic indicators (first row), from 2000-2010. A bar represents data for one year and a missing bar indicates missing data. Within an indicator, all countries have same scale.
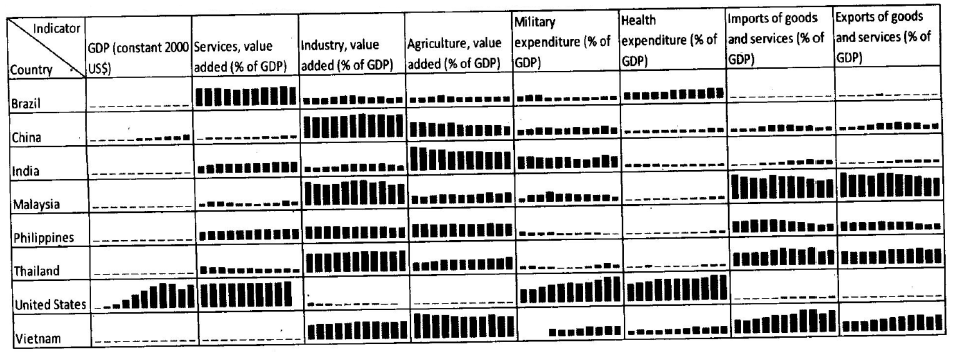
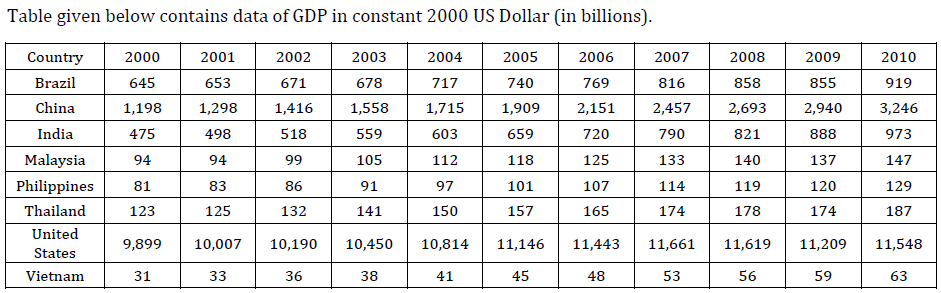
Which of the following countries, after United States, has the highest spending on military as % of GDP, in the period 2000-2010?
Solution
After the USA, we have to find a country with the highest spending on the Military as a % of GDP.
From the chart for Military Expenditure, it can be easily seen that the bar graph for India is higher than any other country except the USA.
Hence, option C is the answer.
Which country (and which year) has witnessed maximum year-to-year decline in “industry as percentage of GDP”? Given that the maximum value of industry as percentage of GDP is 49.7% and the minimum value of industry as percentage of GDP is 20.02%, in the chart above.
Solution
This change can be observed by viewing the chart.
Where all other countries saw a gradual drop in their “industry as a % of GDP”, for Malaysia in 2008-09, the fall was sudden and had the maximum value among the options.
Hence, option D is the answer.
Which of the following countries has shown maximum increase in the “services, value added as % of GDP” from year 2000 to year 2010?
Solution
From the chart for “services, value-added as a % of GDP” we can see that every other country, except India, has a constant value or decrease from 2000-10, whereas India shows a slow but gradual increase.
Hence, option B is the answer.
Answer the questions based on the trends lines from the following graphs.
Note: Left side of X axis represents countries that are “poor” and right side of X axis represents countries that are “rich”, for each region. GDP is based on purchasing power parity (PPP).
These are World Bank (WB) estimates.

Which of the following could be the correct ascending order of democratic regions for poor?
Solution
We have to mark the option which displays an ascending order of democratic regions for the poor.
From the charts, we can see that the lowest value is displayed by C & E Europe (<5).
Option D has C & E Europe as the first name, so it could be the answer. Checking the remaining regions in option D, we get Africa (approx. 10), South America (14), Western Europe (19.99) and Scandinavia (20).
Thus, the order should be C&E Europe, Africa, South America, Western Europe and Scandinavia.
Hence, option D is the answer.
Which region has the highest disparity, of democratic participation, between rich and poor?
Solution
We have to find the region with the highest disparity in democratic participation between rich and poor. We can check this by calculating the difference between the highest and lowest values from the chart.
North America = 20 - 18 = 2
C&E Europe = 20 - 5 = 15
Africa = 11 - 10 = 1
South America = 20 - 14 = 6
Western Europe = 19.95 - 19.85 = 0.1
Thus, C&E Europe has the highest disparity between the rich and the poor.
Hence, option B is the answer.
The maximum GDP of African region is higher than the maximum GDP of South American region by factor of:
Solution
From the graph, we can say that the maximum GDP of African and South American region has the same value. i.e 9.5
So E is the correct answer.
For the following questions answer them individually
The G-7 is a group consisting of:
The correct match between countries and their official languages is:
The correct match between the following mountain ranges and their highest peaks is:
The acronym “YAHOO” stands for:
The list of persons not containing an RBI governor is:
The factor that least influences exchange rate fluctuations:
The sequence that contains a wrong match between car manufacturers and their country of origin
As per the Constitution, which among the following is not a fundamental right granted to the citizens of India ?
Jawaharlal Nehru declared ‘Poorna Swaraj’ at:
Who among the following was known as the ‘Saint of the Gutters’?
Solution
Mother Teresa was known as the ‘Saint of the Gutters’.
Hence, option B is the correct answer.
‘Long Walk To Freedom’ is the autobiography of the following Bharat Ratna recipient
Which seventh century Indian mathematician was the first in the world to treat ‘zero’ as a number and show its mathematical operations ?
Which city houses the headquarters of International Atomic Energy Agency (IAEA)
Which Indian region is the only place in the world where the Asiatic Wild Ass is Found ?
The number of officially recognized lnguges according to the Eight Schedule of the Indian Constitution is
The ancient civilization of Sumer flourished in a region, which is a part of the following country in the modern world
The following women have been honoured with The Nobel Peace Prize, except:
The correct ascending prder of the countries based on the latest Gross Domestic Product data (Purchasing Power Parity) from IMF is:
The distance covered in half marathon is approximately:
The newest country in the world is:
