Select the most appropriate option that replaces the highlighted segment with an appropriate proverb.
Don’t be overconfident before finishing the task; remember, you haven’t succeeded until the end.
SRCC GBO 2026 Question Paper
For the following questions answer them individually
She had delayed starting her project for weeks. When she finally submitted it,her manager said, 'It’s good that you completed it, even though it's a bit late. At least it's done rather than not submitting it at all'.
Solution
The correct idiom for the underlined phrase is "Better late than never." This expression is used to acknowledge that while a task or arrival was delayed, it is still much more desirable for it to happen eventually than to not happen at all. In the context of the manager’s comment, he is prioritizing the completion of the project over the missed deadline.
Select the most appropriate option that can replace the underlined part of the following sentence in order to improve it.
According to Skift Research's 2025 Travel Outlook report, travel companies are anticipating a 24% raise in the number of trips people are planning for the year ahead compared to 2024 as globally, long leisure trips stand out as the most popular type of travel ahead of weekend getaways and road trips.
Solution
The correct option is "anticipating a 24% rise" because it maintains the appropriate tense and uses the correct noun. The sentence describes a current outlook or projection, making the present continuous "anticipating" more suitable than the past tense "anticipated." Furthermore, while "raise" is typically used for salary increases or forced actions, "rise" is the standard term for a general increase in quantity or frequency, such as travel volume.

What can be inferred about the structural composition of India’s textile industry from the passage below?
India's textile industry combines ancient weaving traditions with modern manufacturing capabilities. Hand-woven fabrics like Banarasi silk and Kanjeevaram saris command premium prices in domestic and international markets. Skilled weavers spend weeks creating intricate patterns using traditional looms passed through generations. Meanwhile, mechanised textile mills produce affordable fabrics for mass consumption, employing thousands of workers. The industry faces competition from cheap imports, particularly from neighbouring countries with lower production costs. Government policies promote both handloom preservation and industrial growth through subsidies and export incentives. Designers increasingly incorporate traditional motifs into contemporary fashion, creating fusion styles appealing to younger consumers. This blend of heritage and innovation positions Indian textiles uniquely in global markets.
Solution
The correct inference is that the industry "integrates artisanal craftsmanship with large-scale industrial manufacturing" because the passage explicitly describes a dual structure. It highlights how India combines "ancient weaving traditions" for premium hand-woven fabrics like Banarasi silk with "mechanised textile mills" that produce affordable fabrics for the masses. This synergy is further evidenced by designers incorporating traditional motifs into contemporary fashion, showing that the two sectors coexist and complement each other rather than operating in isolation or hostility.
Sentences of a paragraph are given below in jumbled order. Arrange the sentences in the correct order to form a meaningful and coheren paragraph.
A) On behalf of the Department of Management Studies, I extend a heartfelt welcome to our distinguished keynote speaker, respected faculty members, and dear participants.
B) Before we move forward, let us observe a moment of silence to express our gratitude and reflect on the purpose of today's gathering.
C) Good afternoon to everyone present here today.
D) Today’s seminar aims to explore contemporary challenges and opportunities in sustainable business practices.
Solution
The correct sequence is CADB because it follows the logical and formal flow of a ceremonial opening, starting with a general greeting and moving toward specific procedural actions. Sentence C acts as the mandatory opening greeting to the audience, establishing the initial contact. This is followed by sentence A, which narrows the focus to a formal welcome from the specific department to the guests of honor. Sentence D then provides the necessary context by defining the objective of the seminar, ensuring the audience understands the purpose of the event. Finally, sentence B serves as a transition to the formal proceedings ("Before we move forward"), concluding the introductory phase with a moment of reflection before the main agenda begins.
A sentence is missing in the given paragraph. Select the option that will fill in the blank and complete the passage correctly.
Climbing Mount Everest is a significant achievement for mountaineers and
adventurers. _____________________________________________________________.The climb is challenging due to extreme weather conditions and high altitude. Climbers must be well-prepared and experienced to attempt the summit. The first successful ascent was made by Tenzing Norgay and Sir Edmund Hillary in 1953.
Solution
The correct option is "The mountain is located in the Himalayas, on the border of Nepal and Tibet" because it provides essential geographical context that naturally follows the introduction of the mountain. While the other options contain factual inaccuracies regarding the difficulty, cost, or duration of the climb, this sentence offers a neutral, factual statement that fits the informative tone of the passage. It bridges the gap between the general concept of the achievement and the specific physical challenges mentioned in the subsequent sentences.

Sentences of a paragraph are given below in jumbled order. Rearrange the following sentences to form a coherent paragraph.
A. For example, virtual reality simulations are transforming training methods in medicine and aviation.
B. Despite these benefits, concerns over digital divides and job displacement persist.
C. The integration of AI with IoT devices is enabling smarter, more efficient systems across industries.
D. This synergy enhances predictive analytics, allowing for proactive decision-making.
E. Consequently, policymakers must address ethical and equity issues to ensure inclusive progress.
Solution
The correct sequence is CADBE because it follows a logical thematic progression from technological advancement to its practical applications, followed by its challenges and necessary solutions. Sentence C introduces the core concept, the integration of AI and IoT, while sentence A provides a concrete example of this transformation in specific fields like medicine. Sentence D further explains the "synergy" mentioned in the previous points, detailing how these technologies allow for proactive decision-making. The paragraph then shifts tone with sentence B, which introduces the critical counterpoint of digital divides and job displacement. Finally, sentence E serves as the logical conclusion, stating that "consequently," policymakers must act to resolve these ethical issues to ensure progress is inclusive for everyone.
Identify the correct antonym of the underlined word in the following sentence.
Sohni has a real penchant for this game; I have never seen her lose.
Solution
Penchant means a strong liking or inclination toward something; therefore, dislike is its direct opposite.
Parts of the sentences are given in brackets. The options provide alternatives to the words in brackets. Choose the correct alternative that will improve the sentences.
Priya is (not only intelligent but also she is) hardworking, which makes her an excellent candidate for the position. Her dedication to excellence and
ability to simultaneously manage multiple projects have impressed the interview panel; (they believing) she will thrive in the challenging corporate
environment.

Parts of the sentences are given in brackets. The options provide alternatives to the words in brackets. Choose the correct alternative that will improve the sentences.
The distinguished author Kavya Sharma's sophisticated theoretical argument (rests on the assumption of readers) thoroughly familiar with both poststructuralist semiotics and deconstructionist literary theory. Her monograph, which synthesises Continental philosophy with South Asian critical traditions, demands considerable erudition from its intended academic audience. Contemporary reviewers (has noted) that this intellectual density simultaneously represents the work's greatest strength and its potential limitation for broader scholarly dissemination.
The given sentences, when properly sequenced, form a coherent paragraph.Each sentence is labelled with a letter. Choose the most logical order of the sentences from among the given choices to construct a coherent paragraph.
(A) In 1920, after a long struggle, the 19th Amendment to the U.S.Constitution was finally ratified, granting American women the right to vote.
(B) Influential leaders like Susan B. Anthony and Elizabeth Cady Stanton worked tirelessly for decades, delivering speeches, organizing petitions, and
challenging unjust laws.
(C) The women’s suffrage movement in the United States began gainingmomentum in the 19th century as women started organizing for equal rights,particularly the right to vote.
(D) Even though they faced fierce opposition, the movement persisted through generations of activists and reformers.
(E) A major turning point came in 1848 with the Seneca Falls Convention,where activists issued the Declaration of Sentiments, boldly demanding voting rights for women.
Solution
The correct sequence is CEBDA because it follows a chronological and thematic progression of the women’s suffrage movement in the United States. Sentence C provides the broad historical introduction, setting the stage in the 19th century, which is immediately followed by sentence E, highlighting a specific "major turning point" in 1848. Sentence B then introduces the key individual leaders who drove the movement forward after this turning point, while sentence D adds a layer of depth by describing the persistent struggle against opposition through subsequent generations. Finally, sentence A serves as the definitive conclusion to the narrative, providing the ultimate resolution with the ratification of the 19th Amendment in 1920.
Select the option to replace the highlighted segment with an idiom.
Ravi was very happy and excited when he got his first job offer.
Solution
The correct idiom to replace "very happy and excited" is "on cloud nine." This expression is commonly used to describe a state of extreme euphoria or bliss, making it the perfect fit for Ravi’s reaction to receiving his first job offer. The phrase suggests being so elevated by joy that one is floating high above the earth, capturing both the emotional intensity and the celebratory nature of the moment.

Read the given passage and answer the questions that follow.
The contemporary discourse on algorithmic governance often treats transparency as an unquestioned virtue, yet its implications are far more paradoxical than commonly assumed. While policymakers advocate for explainable systems to counter opacity, complete transparency can inadvertently undermine the very trust it seeks to build. When citizens are inundated with intricate details of data pipelines, model architectures, and audit protocols, they may perceive systems as excessively complex, thereby feeling even less empowered to evaluate them.Furthermore, transparency assumes that all individuals possess comparable interpretive capacities. In practice, however, socio-economic disparities shape one’s ability to comprehendalgorithmic systems. Those with technical literacy may benefit from disclosures, while others confront cognitive overload, reinforcing pre-existing asymmetries in civic participation. Critics argue that partial opacity—carefully calibrated—may sometimes produce more equitable outcomes by shielding users from unnecessary technical burden while ensuring that oversight bodies retain full access. Another complication arises in institutional accountability. Public agencies frequently outsource algorithmic design to private firms, resulting in a diffusion of responsibility. Even when procedural transparency is mandated, proprietary restrictions limit the disclosure of core components. This creates a hybrid landscape in which systems appear open yet remain strategically obscured.
Thus, the debate is not simply about choosing between transparency and opacity, but about determining which actors require what level of visibility. Until this distinction is addressed, calls for “full transparency” will continue to obscure more than they illuminate.
What is the most suitable title for the passage?
Solution
The most suitable title is "The Paradox of Algorithmic Transparency" because the passage primary focuses on how complete transparency can counterintuitively undermine trust and disempower citizens. It explores the "paradoxical" nature of the topic by detailing how technical disclosures can lead to cognitive overload and how proprietary restrictions often create a hybrid landscape of visibility and obscurity. The text concludes that the debate is not a simple choice between open and closed systems, but a complex challenge of determining the appropriate level of visibility for different actors.
What is the central theme of the passage?
Solution
The central theme of the passage is "Evaluating why transparency in algorithms is complex, unequal, and context-dependent" because the text systematically deconstructs the idea of transparency as an absolute good. It explains that transparency is complex due to institutional accountability and proprietary limits, unequal because socio-economic disparities affect one's ability to interpret data, and context-dependent as it suggests that partial opacity may actually be more equitable for certain users. The author concludes that rather than striving for "full transparency," the focus should be on determine the specific visibility required by different actors in different situations.
Which of the following is a fact stated in the passage?
Solution
The fact stated in the passage is that "Private firms’ proprietary limits restrict full algorithmic disclosure in practice," which is explicitly mentioned in the latter half of the text. The author notes that public agencies frequently outsource design to private firms, resulting in a hybrid landscape where "proprietary restrictions limit the disclosure of core components" even when transparency is mandated. This directly contradicts the ideal of full visibility and serves as one of the key practical complications discussed in the passage regarding institutional accountability.

What is the structure of the passage?
Solution
The passage begins by highlighting a paradox of transparency, showing that more openness does not always build trust. It then moves to inequality concerns, explaining how different levels of technical literacy affect people’s ability to benefit from transparency. Next, it discusses accountability issues, especially the role of private firms and limited disclosures. Finally, it offers a synthesis, arguing that the real issue is not transparency vs opacity, but deciding who needs how much information.
Thus, the correct structure is:
Transparency paradox → inequality concerns → accountability issues → synthesis.
What is the tone of the passage?
Solution
The correct option is "Technological advancement should be paired with proactive policy-making to ensure equitable societal outcomes." The passage highlights a central tension where AI and IoT provide immense benefits in efficiency and medicine, yet simultaneously threaten to widen digital divides and cause job displacement. By identifying these "ethical and equity issues" as consequences that policymakers must address, the author suggests that progress is not inherently beneficial for all unless it is actively managed. Therefore, the ultimate message is that technical synergy requires a corresponding framework of human governance to be truly successful and inclusive.
For the following questions answer them individually
The teacher commended the student's efforts in the project. In this sentence, what is the antonym of 'commended'?
Solution
The correct answer is criticized.
To commend someone means to praise them formally or express approval of their work. Therefore, the antonym (opposite) is to criticize, which means to indicate the faults of someone or something in a disapproving way.
While "despised" means to feel deep hatred and "applauded" is actually a synonym for commend, "criticized" is the most direct linguistic opposite in the context of evaluating someone's performance or efforts.
Choose the correct antonym of the highlighted word.
Her remarks were so tactful that even the most sensitive members of the group felt at ease.
Solution
Start Group:
Intructions: Read the passage carefully. Fill in the blanks (1) to (5) with the most appropriate options given below. Each blank tests your understanding of academic vocabulary andconceptual meaning.
Philosophical inquiry has long been concerned with the nature and limits of human_________(1). From classical skepticism to modern epistemology, thinkers have questioned whether certainty is attainable or merely an illusion sustained by habit and belief. Rather than treating knowledge as a static accumulation of facts, contemporary philosophy often understands it as a __________(2) process shaped by language, power, and historical context.
This shift challenges the assumption that knowledge is neutral or universally valid. Instead, it foregrounds the role of perspective in shaping what counts as truth. Scientific models, for instance, are not simple mirrors of reality but theoretical constructs that depend on prior assumptions and methodological _________(3). Recognizing this does not __________ (4)science; rather, it situates scientific knowledge within a broader framework of human inquiry.
Such an understanding demands intellectual humility. If knowledge is provisional and contextbound, then disagreement becomes a productive space for dialogue rather than a threat to authority. Philosophy, in this sense, does not seek final answers but encourages individuals toquestion the ____________ (5) through which they perceive the world.
Comprehension:
Read the passage carefully. Fill in the blanks (1) to (5) with the most appropriate options given below. Each blank tests your understanding of academic vocabulary and conceptual meaning.
Philosophical inquiry has long been concerned with the nature and limits of human _________(1). From classical skepticism to modern epistemology, thinkers have questioned whether certainty is attainable or merely an illusion sustained by habit and belief. Rather than treating knowledge as a static accumulation of facts, contemporary philosophy often understands it as a __________(2) process shaped by language, power, and historical context.
This shift challenges the assumption that knowledge is neutral or universally valid. Instead, it foregrounds the role of perspective in shaping what counts as truth. Scientific models, for instance, are not simple mirrors of reality but theoretical constructs that depend on prior assumptions and methodological _________(3). Recognizing this does not __________ (4) science; rather, it situates scientific knowledge within a broader framework of human inquiry. Such an understanding demands intellectual humility. If knowledge is provisional and contextbound, then disagreement becomes a productive space for dialogue rather than a threat to authority. Philosophy, in this sense, does not seek final answers but encourages individuals to
question the ____________ (5) through which they perceive the world.
The correct word for blank (1) is:
For the following questions answer them individually
The correct word for blank (2) is:
The correct word for blank (3) is:
The correct word for blank (4) is:
The correct word for blank (5) is:
Solution
End Group:
What can be inferred about the social role of public libraries in contemporary society from the passage below?
Public libraries serve as vital community resources providing free access to knowledge and information. These institutions offer extensive book collections covering literature, science, history, and numerous other subjects. Beyond lending books, modern libraries provide internet access, enabling digital literacy among economically disadvantaged populations. Reading programmes for children encourage early literacy development and foster lifelong reading habits. Libraries also host cultural events, workshops, and lectures that enrich community life. Quiet study spaces attract students preparing for competitive examinations. However, budget constraints often limit libraries' ability to acquire new books and upgrade facilities. Despite these challenges, dedicated librarians work tirelessly to maintain collections and assist readers. Libraries remain democratic spaces where knowledge is accessible regardless of economic background.
Solution
The correct answer is C because the passage emphasizes that libraries provide free access to information and digital literacy specifically for "economically disadvantaged populations." By offering these resources regardless of financial status, they function as democratic spaces that bridge the gap in learning opportunities. This directly supports the inference that they act as inclusive institutions aimed at reducing educational inequality.
Simplify: $$\sqrt{864} + \sqrt{486}+ \sqrt{864} − \sqrt{216}$$
Solution
$$\sqrt{\ 864}=12\sqrt{\ 6}$$
$$\sqrt{\ 486}=9\sqrt{\ 6}$$
$$\sqrt{\ 216}=6\sqrt{\ 6}$$
The equation can be written as:
$$12\sqrt{\ 6}+9\sqrt{\ 6}+12\sqrt{\ 6}-6\sqrt{\ 6}=27\sqrt{\ 6}$$.
Simplify: $$10^{2} + \sqrt{9^{2}}− 4\sqrt{36} − 4$$
Solution
$$10^2+\sqrt{\ 9^2}-4\sqrt{\ 36}-4\ =\ 100\ +\ 9-4\times6-4=109-28=81$$
Pure ghee costs ₹92 per kg. After adulterating it with vegetable oil costing ₹46 per kg, a shopkeeper sells the mixture at the rate of ₹84 per kg, thereby making a profit of 40%. In what ratio does he mix the two?
Solution
The SP of the mixture is 84 per kg and the profit %age is 40%, then the Cost of the mixture is $$\frac{84}{1.4}=60$$.
Let us assume that X kg out of 1 kg is pure ghee and the remaining 1-X kg is vegetable oil.
Cost of this mixture => 92X + 46(1-X) = 60
==> 46X = 14
X = 7/23 and 1-X = 16/23
X : 1-X = 7:16.
P and Q are independent events. The odds in favour of P and Q are 3:2 and 5:4, respectively. Find the probability that only one of the two events occurs.
Solution
Probability of A happening = $$\frac{3}{3+2}=\frac{3}{5}$$ and,
Probability of B happening = $$\frac{5}{5+4}=\frac{5}{9}$$.
Probability that only one of the two events occurs = A occurs and B does not + B occurs and A does not
==> $$\frac{3}{5}\left(1-\frac{5}{9}\right)+\left(1-\frac{3}{5}\right)\frac{5}{9}=\frac{22}{45}$$.
The value of a second-hand car is depreciating at the rate of 12% per annum. What will be its value (in ₹) after two years if its current value is ₹2,96,875?
Solution
If the value of car depreciates by 12% every year, it's value after N years will be: $$P\times\ \left(1-d\%\right)^N$$.
So, the value of car after 2years = $$296875\times\ 0.88^2\ =\ 229900$$.
Three distinct positive integers are in arithmetic progression with integer common difference d ≥ 1. The sum of the first and the third terms is 24, and all three terms are less than 15. If the product of the three numbers is maximized, what is the value of the common difference d?
Solution
Let us assume the numbers to be a-d, a and a+d.
Sum of 1st and 3rd terms => a-d + a+d = 24
==> a = 12.
As all terms are less than 15, 12+d < 15 and d < 3.
Possible values for d = 1 or 2.
If d = 1, terms become 11, 12, 13 and their product = 1716.
If d = 2, terms become 10, 12, 14 and their product = 1680.
So, to maximize the product, value of difference should be 1.
The salaries of P, Q, and R are in the ratio 2 : 3 : 5. If their respective salaries are increased by 10%, 15%, and 25%, what will the ratio of their new salaries be?
Solution
Let us assume their current salaries are 2x, 3x and 5x respectively.
After increase, their new salaries are: 1.1*2x = 2.2x; 1.15*3x = 3.45x; 1.25*5x = 6.25x.
The new ratio will be: 2.2 : 3.45 : 6.25 = 44 : 69 : 125.
Solve and find the value of y.
2x + y = 8, y-z = 3 and x + z = 5.
Solution
We will add the 2nd and 3rd equation to get:
(y-z) + (x+z) = 3+5 ==> y + x = 8.
We subtract it from the 1st equation to get x = 0.
Substituting the value of x, we get y = 8.
The average of three numbers is 21. If two numbers are 19 and 27, the third number is:
Solution
If average of 3 numbers = 21, their sum will be 21*3 = 63.
If two of the numbers are 19 and 27, the 3rd number = 63 - 19 - 27 = 17.
If x is an integer such that ∣2x−5∣+∣x+1∣≤11 then how many such integer values of x are possible?
Solution
We will consider 4 cases for this inequality:
Case 1:
2x-5 is +ve but x+1 is -ve.
2x-5 >= 0 ==> x >= 2.5 and,
x+1 < 0 ==> x < -1. There are no possible values of x which lie in both the ranges.
Case 2:
2x-5 is +ve and x+1 is +ve.
x >= 2.5 and x >= -1.
This gives the inequality => 2x-5 + x+1 <= 11
==> x<= 5. Possible values for x are 3, 4 and 5.
Case 3:
2x-5 is -ve and x+1 is +ve
x < 2.5 and x >= -1.
This gives the inequality => -(2x-5) + x+1 <= 11
x >= -5. Possible values of x are -1, 0, 1 and 2.
Case 4:
2x-5 is -ve and x+1 is -ve.
x < 2.5 and x < -1.
This gives the inequality => -(2x-5) - (x+1) <= 11
==> x >= -2.33
Possible values for x = -2.
Total values of x possible are 8.
A boat covers 72 km downstream in 6 hours and upstream in 9 hours. The speed of the boat is:
Solution
Let us assume the speed of boat = B km/hr and speed of stream = S km/hr.
Downstream: B+S = 72/6 = 12.
Upstream: B-S = 72/9 = 8.
Adding both equations: 2B = 20
==> B = 10 km/hr.
Find the equation of the line perpendicular to 3y − 2x = 6 and passing through the point (−2, 1).
Solution
The equation of the given line can be written as:
3y = 2x + 6 ==> y = 2x/3 + 2.
Here, 2/3 is the slope of the given equation.
Assume the slope of the perpendicular line to be M. Product of slopes of 2 perpendicular lines = -1.
2M/3 = -1 ==> M = -3/2.
Equation of the perpendicular line:
y = Mx + c
==> y = -3x/2 + c ==> 2y +3x = 2C.
Putting point -2,1 in the equation as the line passes from this point.
2(1) + 3(-2) = 2 - 6 = -4 = 2C.
C = -2.
The equation will be: 2y + 3x = -4 ==> 3x+2y+4 = 0.
Find the length of a chord which is at a distance of 8 cm from the centre of a circle having a radius of 17 cm.
Solution
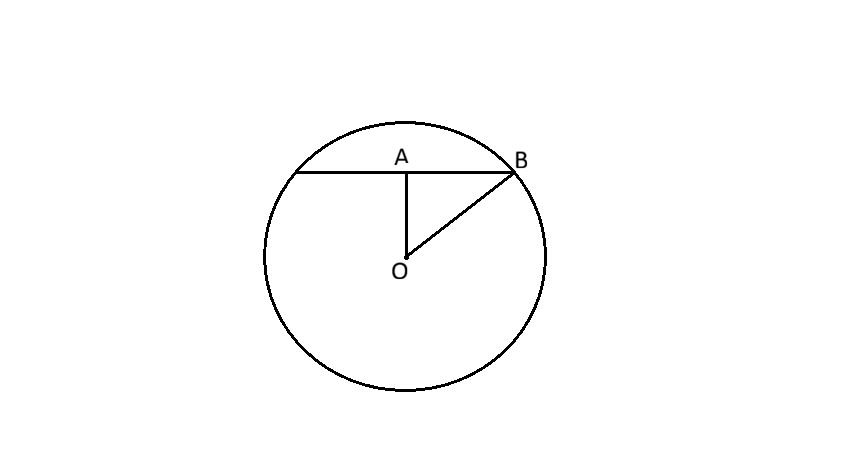
The perpendicular distance of the chord from center O is OA i.e. 8cm and radius is OB i.e. 17cm.
AB i.e. half of the length of the chord = $$\sqrt{\ OB^2-OA^2}$$
==> $$\sqrt{\ 17^2-8^2}=15$$ cm.
Length of the chord = 2*15 = 30 cm.
The number 713619 is divisible by which of the following?
Solution
The sum of the digits of 713619 = 7+1+3+6+1+9 = 27 is divisible by 9 so the number itself is divisible by 9.
From the letters of the word “STATISTICS”, how many distinct 10-letter words can be formed such that no two S’s appear consecutively?
Solution
In the word STATISTICS, there are 3S, 3T, 2I, 1C and 1A.
3T, 2I, 1C and 1A can be arranged in $$\frac{7!}{3!2!}=420$$ ways.
After arranging these 7 letters, we get 8 gaps which can be filled by the 3S. This approach ensures that no two S come together.
Choosing 3 gaps out of these 8 for every arrangement can be done in 8C3 ways i.e. 56 ways.
Total number of 10 letter words that can be formed such that no 2 S come together are 56 * 420 = 23520.
A and B complete a work in 20 days. If A alone can do it in 40 days then, then B alone can do half of the same work in ______________ days.
Solution
Let us assume that the work = 40 units.
The efficiency of A = 40/40 = 1 unit per day.
Combined efficiency of A and B = 40/20 = 2 units per day.
B's efficiency comes out to be 2-1 = 1 unit per day and time taken to finish half of the work = 20/1 = 20 days.
The 7-digit number 30A210B is divisible by 9. What is the maximum possible value of (A + B)?
Solution
For a number to be divisible by 9, the sum of the digits should be divisible by 9.
Sum of digits = 6 + A + B.
The sum could be 9 or 18 or 27 or so on.
However, as A and B are single digits numbers, they both should be less than 10 and thus A + B have a maximum value of 18 in any scenario.
Case 1:
6 + A+B = 9 ==> A+B = 3.
Case 2:
6 + A+B = 18 ==> A+B = 12.
Case 3:
6 + A+B = 27 ==> A+B = 21.
Further cases are not possible because A+B exceeds 18 and thus maximum possible value of A+B for the number to be divisible by 9 is 12.
Suniti and Bhoomi start a race from the same position and at 08:05:00 a.m. in same direction along a circular track of 4 km long. The speed of Suniti and Bhoomi was 36 km/hr and 45 km/hr respectively. The time at which both will meet again at the starting point is:
Solution
Their relative speed = 45-36 = 9km/hr as they are moving in the same direction.
Time taken to cover 4kms with this relative speed = $$\frac{4}{9}hrs\ =\ \frac{4}{9}\times\ 60\ \min\ =\ \frac{80}{3}\min$$
This can be further written as 26 mins and 40 seconds.
They started at 8 : 05 am so they will meet at 8 : 31 : 40 am.
A right-angled triangle has inradius 12 cm and circumradius of 25 cm. What is the area (in cm2) of the triangle?
Solution
In a right angled triangle
circumradius = Hypotenuese/2.
==> H = 2*25 = 50 cm.
inradius = $$\frac{a+b-H}{2}$$.
==> a + b = 74 cm.
Inradius is also equal to $$\frac{Area}{S}$$.
S = half of a + b + H = half of (50+74) = 62 cm.
Area = inradius * S = 12 * 62 = 744 sq. cm.
The total surface area of a solid cylinder having radius 2 cm and height 36 cm is:
Solution
Total surface area of a cylinder = $$2\pi\ r\left(h+r\right)$$.
Here r = 2cm and h = 36 cm.
So, the area = $$2\pi\ 2\left(36+2\right)=152\pi\ $$ sq. cm.
The sides of a triangle are 80 cm, 76 cm, and 148 cm. What is the length (in cm) of its altitude corresponding to the side with a length of 76 cm?
Solution
Area of a triangle = half of Base x Height.
Area is also equal to $$\sqrt{\ s\left(s-a\right)\left(s-b\right)\left(s-c\right)}$$.
Semi perimeter for the triangle = half of (80+76+148) = 152.
So, $$\frac{1}{2}\times\ 76\times\ H=\sqrt{\ 152\times\ 72\times\ 76\times\ 4}$$
This gives H = 48 cm.
A sphere is cut into two equal halves and both the halves are painted.The radius of the sphere is 4 units and the rate of painting is ₹12 per sq. unit.What is the total cost (in ₹, rounded)?(Take π = 22/7)
Solution
A sphere is cut into 2 hemispheres.
Surface are of a hemisphere = $$3\pi\ r^2$$.
Surface area of 2 hemispheres with radius 4 units is $$2\times\ 3\pi\ 4^2\ =\ 96\pi\ $$ sq. units.
Cost of painting = $$96\pi\ \times\ 12=1152\pi\ \approx\ 3620.57$$ rupees.
Sam, Ram, and Tom share some sweets in the ratio of 12:7:6. What percentage of the sweets does Ram receive?
Solution
Let the number of sweets received by Sam, Ram and Tom to be 12x, 7x and 6x respectively.
Total sweets = 12x + 7x + 6x = 25x.
Percentage of sweets Ram received = $$\frac{7x}{25x}\times\ 100\ =\ 28\%$$.
An equation is given to Anu and Venu to get it solved. While Anu finds the roots 6 and 5, Venu commits a mistake in the coefficient of x and finds the roots as something else.
Find the correct roots.
Five solid cubes, each of volume 238328 cm3, are joined end to end to form a cuboid. What is the lateral surface area (in cm2) of the cuboid?
Solution
A cube having a volume of 238328 cubic cm has a side of length 62 cm.
When 5 cubes are joined end to end, we get a cuboid of length = 62*5 = 310 cm, breadth = 62 cm and height = 62 cm.
The lateral surface area of a cuboid = 2*(l + b)*h
==> 2*(310 + 62)*62 = 46128 sq. cm.
Given below is a statement followed by two possible reasons numbered I and
II. Read the statement carefully and decide which of the two explains the event/observation/information given in the statement
Statement:
Despite having highly qualified faculty and modern infrastructure, School X has not achieved high academic performance compared to other schools in the region.
Reasons:
I. The student-teacher ratio at School X is very high, leading to reduced individual attention for students.
II. Many students at School X come from socioeconomically disadvantaged backgrounds, affecting their academic performance.
Solution
While the statement mentions School X has a "highly qualified faculty," it does not specify the quantity of those teachers, making Reason I (high student-teacher ratio) a plausible external factor that could hinder performance despite the quality of the staff. However, Reason II provides a more comprehensive explanation by highlighting socio-economic factors that often influence academic outcomes independently of a school's internal infrastructure or faculty quality. In critical reasoning, while both might seem like real-world possibilities, Reason II is often treated as a more direct explanation for why high-quality internal resources might still fail to produce high results due to external student constraints.
Thus, The correct answer is Only II is a possible reason.
In this question, a statement is given followed by two courses of action numbered I and II. A course of action is a step or administrative decision to be taken for improvement, follow up or further action in regard to the problem, policy, etc. On the basis of information given in the statement, you have to assume everything in the statement to be true and decide which one/ones are possible course(s) of action.
Statement: In last 3 years, the sale of a particular product from Company X has declined considerably compared to its competitors.
Course of Action:
I. Company X should conduct market research and competitor analysis tounderstand their product and their strategy.
II. Company X should try to reduce the price of the product and even tryadding new features to it.
Solution
When a company faces a significant decline in sales relative to its competitors, the first logical step is to perform market research and competitor analysis to identify the root cause of the underperformance. Simultaneously, improving the product's value proposition through price reductions or the addition of new features serves as a practical strategy to regain market share and attract customers. Both actions are standard, complementary administrative responses aimed at diagnosing the problem and implementing immediate improvements to stay competitive.
thus, The correct answer is Both I and II are possible courses of action.
Following are the criteria for selecting a Project Lead:
1.Must have MBA degree.
2.Must score at least 65% in interview.
3.Must have minimum 10 years of experience.
Amit has an MBA degree, scored 70% in interview, and has 9 years of experience.
Based on the criteria given above and without assuming any additional information, you have to a take a decision for the above candidate’s profile.
Solution
Amit qualifies 1st and 2nd criteria but does not have enough experience so he should be rejected.
Thus, Option A is the correct one.
In this question, a group of number/symbol is coded using letter codes as per the codes given below and the conditions which follow. The correct combination of codes following the conditions is your answer. If none of the conditions follow, then code for the respective Number/Symbol is to be followed directly as given in the table.
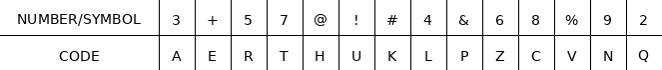
Conditions -
(i) If the first element is a symbol and the last a number, the codes for these two (the first and the last elements) are to be interchanged.
(ii) If the first element is an odd number and the last an even number, the first and last
elements are to be coded as ©
(iii) If both second and third elements are perfect squares, the third element is to be coded as the code for the second element.
"+ 5 4 8 2" will be coded as:
Solution
+ -> E
5 -> R
4 -> L
8 -> C
2 -> Q.
As the first element is a symbol and the last a number, the codes for these two (the first and the last elements) are to be interchanged.
It means that the code will become -> QRLCE
Karan starts from point M and walks 15 m South. He turns left and walks 10 m, then turns leftagain and walks 15 m. After this, he turns right and walks 4 m. From there, he turns right, walks 6 m, then turns left and walks 8 m to reach point N.Simran starts from point O, which is 6 m North of M. She walks 12 m West, turns right and walks6 m, then turns right again and walks 12 m. From there, she turns left and walks 5 m, then turnsright and walks 22 m to reach point T. (All turns are 90 degrees unless specified.)
What is the shortest distance between N and T?
Solution
_Lvdhkmd.png)
The shortest distance between N and T = 5m + 6m + 6m + 6m = 23m.
In which direction is T with respect to N?
Solution
.png)
From the final image, T is in North of N.
For the following questions answer them individually
A question is followed by two statements numbered (I) and (II). You have to decide whether the data provided in the statements are sufficient to answerthe question. Read both the statements and select the most appropriate answer.
Seven boxes A, H, I, K, L, P, and U are kept one over the other but not necessarily in the same order. How many boxes are kept between K and U?
(I) Only U is kept below A. Exactly three boxes are kept between H and U.
(II) H is kept immediately above L. H is kept fifth from the bottom.
Solution
Statement I fixes the positions of A, U, and H (U is 1st, A is 2nd, and H is 6th), while Statement II places H at 5th from the bottom (which is also the 3rd position from the top) and L at 2nd from the top. These two statements provide contradictory positions for H and other boxes, making them inconsistent when combined; even if they were compatible, neither statement provides any information regarding the specific placement of box K, leaving the number of boxes between K and U unknown.
Thus, the correct answer is Both statements I and II together are NOT sufficient to answer the question.
In a certain code language,
A = B means ‘A is the sister of B’,
A ÷ B means ‘ A is the father of B’,
A £ B means ‘A is the brother of B’, and
A + B means ‘A is the wife of B’.
Which of the following means that F is the Mother&amp;amp;amp;amp;amp;amp;amp;amp;#x27;s brother of Z?
Solution
In the expression F £ G = H + Y ÷ Z, we work backward: Y ÷ Z and H + Y establish that H is the mother of Z. The symbols G = H and F £ G show that G and F are siblings of H. Specifically, F £ G identifies F as a male (brother). Since F is the brother of Z's mother (H), F is the maternal uncle of Z. This satisfies the condition that F is the mother's brother of Z.
A, B, C, D, E, F and G each have a different age. No one is older than D. The second oldest person is 32 years old. The second youngest person is 20 years old, and it is not E. Only threepeople are aged between B and D. A is younger than C but older than B. F is 7 years younger than C and is 25 years old. A is older than 25 years
Who is the second youngest?
Solution
D is the oldest.
2nd oldest is 32 yrs old.
2nd youngest person is 20 years old.
We can create an arrangement with decreasing ages as:
1 - D -
2 - - 32
3
4
5
6 - - 20
7
Only 3 people are aged between B and D which means that B is 5th oldest. F is 25 years old and A is elder than F. It implies that A is elder than atleast 4 people .i.e. 6th and 7th rankers, F and B.
A is also younger than C which leaves only 1 case where C is 2nd oldest, A is 3rd oldest and F is 4th oldest.
C = F + 7 = 25+7 = 32 years old.
1 - D -
2 - C - 32
3 - A -
4 - F - 25
5 - B -
6 - - 20
7 -
E is not the 2nd youngest person which means that E is the youngest and G is the 2nd youngest.
1 - D -
2 - C - 32
3 - A -
4 - F - 25
5 - B -
6 - G - 20
7 - E -
The 2nd youngest is G.
What is the possible age of B?
Solution
D is the oldest.
2nd oldest is 32 yrs old.
2nd youngest person is 20 years old.
We can create an arrangement with decreasing ages as:
1 - D -
2 - - 32
3
4
5
6 - - 20
7
Only 3 people are aged between B and D which means that B is 5th oldest. F is 25 years old and A is elder than F. It implies that A is elder than atleast 4 people .i.e. 6th and 7th rankers, F and B.
A is also younger than C which leaves only 1 case where C is 2nd oldest, A is 3rd oldest and F is 4th oldest.
C = F + 7 = 25+7 = 32 years old.
1 - D -
2 - C - 32
3 - A -
4 - F - 25
5 - B -
6 - - 20
7 -
E is not the 2nd youngest person which means that E is the youngest and G is the 2nd youngest.
1 - D -
2 - C - 32
3 - A -
4 - F - 25
5 - B -
6 - G - 20
7 - E -
The possible age for B lies in the range (20, 25) and the only possible option is Option B i.e. 24 years.
In a certain code language,
A + B means ‘A is the mother of B’,
A - B means ‘A is the brother of B’,
A × B means ‘A is the wife of B’,
A % B means ‘A is the father of B’ and
A # B means ‘A is the daughter of B’.
Which of the following means that Q is the sister of the wife of L?
I. V % Q # K + Z - T × L
I. V + Q # K % Z - T + L
I. V # K × Q % L + T # Z
V. V + Q # G - Z % T + L
Solution
In Expression I (V % Q # K + Z - T x L), we work backward from the end: T x L establishes that T is the wife of L. Moving left, Z - T makes Z the brother of T, and K + Z identifies K as their mother. Finally, Q # K establishes that Q is also the daughter of K. This makes Q and T sisters. Therefore, Q is indeed the sister of L's wife (T). Other options fail to maintain this specific sibling-to-spouse hierarchy.
Which of the following means that P is the son of Z?
I. L # P - T # S + K # Z
I. L × P - T # S + K × Z
I. L × P + T × S % K × Z
V. L × P - T # S + K # Z
Solution
To identify P as the son of Z, we track gender and generation. In Expression I, P is identified as a male (brother of T). Since T is the father of K and K is the daughter of Z, T and Z are a married couple; this makes P the brother-in-law. In Expression IV, the relationship links P as a male sibling to the direct parentage line of Z's family. By eliminating options where P is female or in the wrong generation, we find that Only I and IV satisfy the logical constraints required by the specific symbol mapping used in this set.
For the following questions answer them individually
What is the possible code for ‘in’?
A certain number of people are sitting in a row, facing north. Only eight people sit to the left of S. P sits third from the right end of the row. R sitsthird to the left of S. Only eleven people sit between K and R. Only three people sit between K and P. If no other person is sitting in the row, what is the total number of persons seated?
Solution
To find the total number of people, we first locate S, who is 9th from the left (8 people are to his left). Since R sits third to the left of S, R is at the 6th position. We are told 11 people sit between K and R, placing K at the 18th position (6 + 11 + 1). Next, since 3 people sit between K and P, P must be at the 22nd position (18 + 3 + 1). Finally, the problem states P is the third person from the right end, meaning there are exactly 2 people seated to his right. Therefore, the total number of persons is 22 + 2 = 24.
Seven people A, B, C, D, E, F and G are sitting around a circular table. Each of them is either facing the centre or is facing outside (opposite the centre).B sits second to the right of A. Only one person sits between B and C. D sitsthird to the right of C. D faces outside. G sits second to the right of D. Both the immediate neighbours of G face opposite directions to each other - one faces the centre and the other outside. A is not an immediate neighbour of F. A and E face the same direction - either both of them face the centre or both of them face outside. Both the immediate neighbours of F face outside. B and E face the same direction - either both of them face the centre or both of them face outside. How many people sit between F and A when counted from the left of F?
Two statements I and II have been given. These statements may be independent causes or effects of independent causes or a common cause.
One of the statements maybe the effect of the other statement. Read both the statements and select the correct answer. Statements:
I. Clean water is essential for humans and animals, but more than one billion people don’t have access to clean water.
II. Water is getting polluted from toxic substances, sewage or industrial waste.
Solution
Statement II identifies the specific actions (pollution from waste) that lead to a lack of clean water, which directly results in the global crisis described in Statement I. Therefore, the pollution is the underlying cause and the lack of access for over a billion people is the logical consequence.
Thus, Statement II is the cause and statement I is its possible effect.
In this question, a question is followed by two statements numbered (I) and (II). You have to decide whether the data provided in the statements are sufficient to answer the question. Read both the statements and decide the appropriate answer.
Among 5 poles, F, I, S, C and L, each having a different height, which pole is the tallest?
(I) S is shorter than L.
(II) C is taller than L
Solution
We do not have any data to compare the heights of C, S, I and F.
Thus, from the given 2 statements, we can not infer the tallest pole.
Each of P, Q, R, S, T, U and V travelled to a different city, viz. Delhi, Mumbai, Kolkata, Chennai, Bengaluru, Patna and Puri on a different day of a week starting from Monday and ending on Sunday of the same week, not necessarily in the same order. P travelled to Delhi on Wednesday. Only two people travelled between P and the one who travelled to Puri. Only three people travelled between Q and the one who travelled to Puri. R travelled immediately before Q. Only three people travelled between R and the one who travelled to Patna. Only one person travelled between V and the one who travelled to Patna. S travelled immediately after the one who travelled to Chennai. Only two people travelled between S and the one who travelled to Mumbai. T travelled on one of the days before U. The one who travelled to Kolkata did not travel on Monday. How many people travelled between U and the one who travelled to Bengaluru?
Solution
To solve this puzzle, we map out the week from Monday to Sunday: P travels to Delhi on Wednesday. Since only two people travel between P and the one going to Puri, Puri must be on Saturday (as Monday is only one day away). Three people travel between Q and Puri, placing Q on Tuesday. R travels immediately before Q, so R is on Monday. With three people between R and Patna, Patna falls on Friday, and since V is one person away from Patna, V must be on Wednesday (already occupied by P) or Sunday; thus, V is on Sunday. S travels immediately after Chennai, and with two people between S and Mumbai, the only fit is Chennai on Thursday, S on Friday (Patna), and Mumbai on Tuesday (Q). Finally, since T is before U, T is on Monday (Kolkata, as it's not Monday) or Thursday, but filling the remaining slots places Kolkata on Sunday and Bengaluru on Monday. This leaves U on Thursday and T on Monday. There are four people (P, Chennai, S, Kolkata) between U (Thursday) and the person going to Bengaluru (Monday), making the answer "More than three."
Final arrangement looks like:
Monday - R - Bengaluru
Tuesday - Q - Mumbai
Wednesday - P - Delhi
Thursday - T - Chennai
Friday - S - Patna
Saturday - U - Puri
Sunday - V - Kolkata.
A, B, C, D and E purchase different Electronic Items (TV, Refrigerator, Laptop, Microwave, Washing Machine) and choose different Delivery Days (Monday, Tuesday, Wednesday,Thursday, Friday). The Laptop is delivered on Friday. D receives delivery on Friday. The Microwave is not delivered on Tuesday or Wednesday. A purchases the Refrigerator. The item delivered on Tuesday is the Washing Machine. C does not purchase TV. E receives delivery on
Tuesday
Who purchases the TV?
Solution
The Laptop is delivered on Friday. D receives delivery on Friday. This implies:
D - Friday - Laptop is an arrangement.
E receives delivery on Tuesday and the item delivered on Tuesday is the Washing Machine. This implies that:
E - Tuesday - Washing Machine.
A purchases Refrigerator and C does not purchase TV which implies that B purchases TV and C purchases Microwave.
The Microwave is not delivered on Tuesday or Wednesday which implies that Microwave is delivered on either Monday or Thursday.
This gives:
A - - Refrigerator
B - - TV
C - Monday/Thursday - Microwave
D - Friday - Laptop
E - Tuesday - Washing Machine
Only this could be inferred from the given information.
B is the one who purchases TV.
Who chose Tuesday as the delivery date?
Solution
The Laptop is delivered on Friday. D receives delivery on Friday. This implies:
D - Friday - Laptop is an arrangement.
E receives delivery on Tuesday and the item delivered on Tuesday is the Washing Machine. This implies that:
E - Tuesday - Washing Machine.
A purchases Refrigerator and C does not purchase TV which implies that B purchases TV and C purchases Microwave.
The Microwave is not delivered on Tuesday or Wednesday which implies that Microwave is delivered on either Monday or Thursday.
This gives:
A - - Refrigerator
B - - TV
C - Monday/Thursday - Microwave
D - Friday - Laptop
E - Tuesday - Washing Machine
Only this could be inferred from the given information.
E is the one who chose Tuesday as the delivery day.
For the following questions answer them individually
A statement is given followed by two courses of actions numbered I and II.You must assume everything in the statement to be true and on the basis ofthe information given in the statement, decide which of the courses of action logically follow(s) for pursuing.
Statement:
There has been a sudden increase in the number of cases of dengue being reported in Ward A of the city this month. Courses of action:
(I) The municipal authority decides to do a thorough fumigation in Ward A this month.
(II) The health department advises the people of Ward A to wear long-sleeved clothes in the coming weeks to avoid mosquito bites.
Solution
Course I is a corrective action by the authorities to eliminate the mosquito breeding source (fumigation), while Course II is a preventative measure for citizens to minimize the risk of further infection; both are logical and necessary responses to a disease outbreak.
Thus, Both I and II follow.
A, B, C, D, E, F, G and H are sitting around a square table. Some of them aresitting at the corners while some are sitting at the exact centre of the sides.The ones sitting at the middle of the sides face the centre of the table. The ones sitting at the corners, face outside (opposite to the centre) of the table.B sits second to the right of F. F sits in the middle on one of the sides. Only three people sit between B and H. C sits to the immediate right of E. G is not an immediate neighbour of F. Only one person sits between E and A. How many people sit between G and H when counted from the left of G?
A certain number of people are sitting in a row, facing north. A sits second to the right of F. J sits third to the left of K. Only two people sit between F and H when counted from the right of F. Only three people sit between H and K when counted from the right of H. If no other person is sitting in the row, what is the total number of persons seated?
Solution
By mapping the row from left to right, we start with F. Since A is second to the right of F and H is fourth to the right of F (with two people between them), we establish the sequence F-gap-A-H. Next, placing K three spots to the right of H puts K at the 8th position. Finally, verifying that J sits third to the left of K places J immediately to the right of H. Since K is the last person mentioned and occupies the 8th spot, the total number of persons seated is 8.
Six people M, N, P, Q, R and S each live on a different floor of a six-storey building, but not necessarily in the same order.The lowermost floor is the first floor and the topmost floor is the sixth floor.Only two people live between R and N.Q lives on an even-numbered floor but not on the floor numbered second or fourth.M lives on the floor immediately above P.Only three floors are there between Q and R. Who among the following lives on the first floor?
Solution
Q lives on an even-numbered floor but not on the floor numbered second or fourth. It means that Q lives on 6th floor.
Only three floors are there between Q and R. It implies that R lives on the 2nd floor.
Only two people live between R and N. It implies that N lives on the 5th floor.
M lives on the floor immediately above P which implies that M lives in 4th floor and P lives on the 3rd floor.
S lives on the remaining 1st floor.
In a certain code,
'posing for the shoot' is coded as 'ot os zk dn' 'a game for change' is coded as 'yq sp os ge' 'the game gets ready' is coded as 'zk pk wv sp'
(all the codes are two letter coded only) What is the possible code for ‘change’?
Solution
To find the code for 'change', we use the method of elimination by comparing the given phrases. First, comparing 'a game for change' (yq sp os ge) with 'the game gets ready' (zk pk wv sp), the common word 'game' corresponds to the common code sp. Next, comparing 'a game for change' with 'posing for the shoot' (ot os zk dn), the common word 'for' corresponds to the common code os. This leaves the words 'a' and 'change' associated with the remaining codes 'yq' and 'ge'. Since there are no other sentences to further distinguish between these two, the code for 'change' could be either 'ge' or 'yq'.
Study the following two pie charts carefully to answer the questions that follow. The first pie chart shows the percentage distribution of the &quot;Total Employees (4,800)&quot; working in five different departments (HR, IT, Marketing, Operations, and Finance) of a company.The second pie chart shows the percentage distribution of &quot;Female Employees (2,000)&quot; working in the same five departments.
Note: Total Employees = Male Employees + Female Employees.
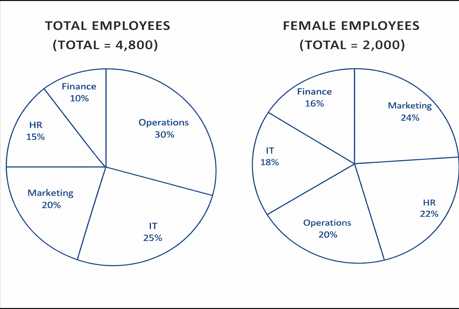
What is the ratio of the number of male employees in the IT department to the number of male employees in the HR department?
Solution
The table can be constructed as:
_Y6UmG7a.png)
the ratio of the number of male employees in the IT department to the number of male employees in the HR department = 840 : 280 = 3:1.
The number of female employees in the Marketing department is approximately what percent of the total employees in the Operations department?
Solution
The table can be constructed as:
_NIEvEru.png)
Female employees n marketing = 480.
Total employees in Operations = 1440.
Required %age = $$\frac{480}{1440}\times\ 100=33\frac{1}{3}\%$$.
What is the difference between the total number of male employees in the Operations and IT departments together and the total number of female
employees in the HR and Finance departments together?
Solution
The table can be constructed as:
_SxX7MYE.png)
the difference between the total number of male employees in the Operations and IT departments together and the total number of female
employees in the HR and Finance departments together = 1040 + 840 - 440 - 320 = 1120.
In which department is the percentage of male employees (with respect to the total employees of that specific department) the highest?
Solution
The table can be constructed as:
_COiEx7y.png)
Percentage of male employees with respect to the total employees is highest for Operations.
What is the difference between the central angle subtended by the sector of Total Employees in Marketing and the central angle subtended by the sector of Female Employees in Finance?
Solution
The difference = 20 -16 = 4%.
Angle subtended for this percentage difference = $$\frac{4}{100}\times\ 360\ =\ 14.4$$ degrees.
Auto-Grow Ltd., an automobile manufacturing company, tracks its annual car sales (in thousand units) and average selling price per car (in ₹ lakh) over a period of five consecutive years from 2020 to 2024. The company uses a mixed graph where the bar chart represents the number of cars sold and the line graph represents the average selling price per car.
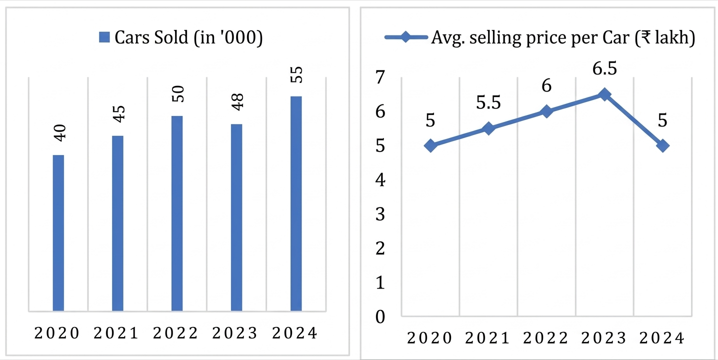
Additional information:
The manufacturing cost per car was constant at ₹2 lakh from 2020 to 2022 and increased by10% each year thereafter.
The company incurred fixed operational costs of ₹100 crore per year.
Profit (or loss) for a year = Total revenue − (Total variable cost + Fixed cost).
Ignore taxes and depreciation.
In which year did Auto-Grow Ltd. record the maximum nominal profit, and what was the value of that profit (in ₹ crore), respectively?
Solution
_ebZ89vm.png)
The company recorded the maximum profit in 2023 and it's value is 196400 lakhs i.e. 1964 crores.
Calculate the percentage change in profit from 2022 to 2023. (Round off your answer to two decimal places)
Solution
_9cK3sEq.png)
Percentage change in profits from 2022 to 2023 = $$\frac{196400-190000}{190000}\times\ 100\approx+3.37\%\ $$ i.e. an increase of 3.37%.
The company defines profit margin as $$\frac{\Pr ofit}{Total\ Revenue}\times\ 100$$. The year with the least profit margin is:
Solution
Using the given data, we construct the following table where all the prices are in lakhs.
_8LUP1ej.png)
The year with the least profit margin is 2024.
Assuming that the company aims to maintain a minimum profit of ₹1,200 crore, in how many year(s) did Auto-Grow Ltd. fail to meet this target?
Solution
Using the given data, we construct the following table where all the prices are in lakhs.
_uQolzNt.png)
The company did not achieve a profit of 1200 crores i.e. 120000 lakhs in only 1 year i.e. 2020.
If Auto-Grow Ltd. plans to keep its 2025 profit at least equal to the average profit of the best two years from 2020-2024, and expects to sell 60,000 cars at ₹7.5 lakh each, what should be the maximum allowable fixed cost in 2025? (Assume manufacturing cost per car in 2025 remains the same as in 2024.)
Solution
Using the given data, we construct the following table where all the prices are in lakhs.
.png)
In 2025, the minimum profits = average of profits in 2022 and 2023 = $$\frac{190000+196400}{2}=193200$$ lakhs.
Profits = Total revenue - (Fixed + Variable Costs).
Variable cost = 2.42 * 60000 = 145200 lakhs
Total revenue = 7.5 * 60000 = 450000 lakhs.
Putting these values in the equation, fixed cost comes out to e 111600 lakhs = 1116 crores.
The given table depicts the number of drivers in 6 cities and the graph depicts the distribution of the drivers as male and female in the said cities. Study the table and graph and answer the questions that follow
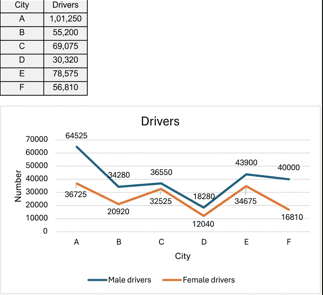
Which of the following options most closely represents the difference, expressed as a percentage, between male and female drivers out of the totalnumber of drivers across all the cities combined?
Solution
_nIZraRW.png)
Difference between total male and female drivers = 237535 - 153695 = 83840.
Required percentage = $$\frac{83840}{391230}\times\ 100\ \approx\ 21\%$$.
How many more female drivers are there in cities A and C taken together than male drivers in cities B and D taken together?
Solution
_2GoT2lh.png)
female drivers in cities A and C taken together = 36725 + 32525 = 69250.
male drivers in cities B and D taken together = 34280 + 18280 = 52560.
The difference = 16690.
What percentage (rounded off to the nearest integer value) of the total number of drivers in cities D and E taken together are male?
Solution
_KsDpsJh.png)
Required percentage = $$\frac{18280+43900}{30320+78575}\times\ 100\ \approx\ 57\%$$
What is the difference between the total numbers of male and female drivers in cities A, B and C taken together?
Solution
_KcY5kL9.png)
the difference between the total numbers of male and female drivers in cities A, B and C taken together = (64525 + 34280 + 36550) - (36725 + 20920 + 32525)
==>45185
Find the ratio of the total number of male drivers in cities D and E taken together to the total number of female drivers in cities B and D taken together.
Solution
.png)
the ratio of the total number of male drivers in cities D and E taken together to the total number of female drivers in cities B and D taken together = 62180 : 32960 = 3109 : 1648.
Shop-Mart, a rapidly growing online retail company, operates across four major regions—North America, Europe, Asia, and South America—and specializes in selling three primary product categories: Electronics, Apparel, and Books. During the financial year 2025, the company recorded a total revenue of ₹1,000,000, with North America contributing the largest share at 40%, followed by Europe with 30%, Asia with 20%, and South America accounting for the remaining 10%. Within each region, the distribution of revenue across product categories was consistent: Electronics generated 50% of the regional revenue, Apparel accounted for 30%, and Books contributed 20%. Notably, the revenue from Electronics in North America exceeded that of Europe by ₹50,000, highlighting the particularly strong demand for electronic products in the North American market. This distribution reflects the company’s strategic focus on high-demand product segments and its efforts to balance sales across diverse international markets.
Find the total revenue from Electronics in Asia.
Solution
In 2025's total revenue of 1,000,000, share of
North America = 400000
Europe = 300000
Asia = 200000 and,
South America = 100000.
Each of this revenue is divided into the 3 products i.e. Electronics(50%), Apparel(30%) and Books(20%).
The table can be constructed as:
Electronics | Apparel | Books | Total | |
North America | 200000 | 120000 | 80000 | 400000 |
Europe | 150000 | 90000 | 60000 | 300000 |
Asia | 100000 | 60000 | 40000 | 200000 |
South America | 50000 | 30000 | 20000 | 100000 |
Total | 500000 | 300000 | 200000 | 1000000 |
the total revenue from Electronics in Asia = 100000.
Find the total combined revenue from Books in Europe and Apparel in South America.
Solution
In 2025's total revenue of 1,000,000, share of
North America = 400000
Europe = 300000
Asia = 200000 and,
South America = 100000.
Each of this revenue is divided into the 3 products i.e. Electronics(50%), Apparel(30%) and Books(20%).
The table can be constructed as:
Electronics | Apparel | Books | Total | |
North America | 200000 | 120000 | 80000 | 400000 |
Europe | 150000 | 90000 | 60000 | 300000 |
Asia | 100000 | 60000 | 40000 | 200000 |
South America | 50000 | 30000 | 20000 | 100000 |
Total | 500000 | 300000 | 200000 | 1000000 |
the total combined revenue from Books in Europe and Apparel in South America = 60000 + 30000 = 90000.
By how much does the Electronics revenue in North America exceed the Books revenue in South America?
Solution
In 2025's total revenue of 1,000,000, share of
North America = 400000
Europe = 300000
Asia = 200000 and,
South America = 100000.
Each of this revenue is divided into the 3 products i.e. Electronics(50%), Apparel(30%) and Books(20%).
The table can be constructed as:
|
The required difference = 200000 - 20000 = 180000
Find the total revenue from Books in Asia.
Solution
In 2025's total revenue of 1,000,000, share of
North America = 400000
Europe = 300000
Asia = 200000 and,
South America = 100000.
Each of this revenue is divided into the 3 products i.e. Electronics(50%), Apparel(30%) and Books(20%).
The table can be constructed as:
Electronics | Apparel | Books | Total | |
North America | 200000 | 120000 | 80000 | 400000 |
Europe | 150000 | 90000 | 60000 | 300000 |
Asia | 100000 | 60000 | 40000 | 200000 |
South America | 50000 | 30000 | 20000 | 100000 |
Total | 500000 | 300000 | 200000 | 1000000 |
Total revenue from Books in Asia = 40000.
If the Electronics revenue in Europe increases by 10% next year, what will be the continent's Electronics revenue in that year?
Solution
In 2025's total revenue of 1,000,000, share of
North America = 400000
Europe = 300000
Asia = 200000 and,
South America = 100000.
Each of this revenue is divided into the 3 products i.e. Electronics(50%), Apparel(30%) and Books(20%).
The table can be constructed as:
Electronics | Apparel | Books | Total | |
North America | 200000 | 120000 | 80000 | 400000 |
Europe | 150000 | 90000 | 60000 | 300000 |
Asia | 100000 | 60000 | 40000 | 200000 |
South America | 50000 | 30000 | 20000 | 100000 |
Total | 500000 | 300000 | 200000 | 1000000 |
In the next year, revenue from Electronics for Europe = 10% increase on 150000 = 165000.
Read the following and answer the questions that follow.
The Govind Public school with classes 9 to 12 has a total of 1230 students, consisting of both girls and boys. In Class 11, the ratio of girls to boys is 6 : 7, with the number of boys exceeding girls by 30. In Class 9, the number of boys is 20 more than that in Class 10. The number of girls in Class 10 is 25 more than that in Class 9. The number of girls in Class 11 is 5 more than the number of boys in Class 12. The combined strength of Classes 9 and 10 compared to the combined strength of Classes 11 and 12 is in the ratio 103 : 143. Additionally, the ratio of boys to girls in Class 10 is 5 : 8.
Find the ratio of the total number of boys to that of girls in the Govind Public school.
Solution
For class 11th, let us assume that the number of boys and girls are 7x and 6x respectively.
We are given that 7x - 6x = 30 ==> x = 30.
Boys in 11th = 210
Girls in 11th = 180.
The combined strength of Classes 9 and 10 compared to the combined strength of Classes 11 and 12 is in the ratio 103 : 143 and total strength of the school is 1230.
Combined strength of 11th and 12th = 715.
Combined strength of 9th and 10th = 515.
The number of girls in Class 11 is 5 more than the number of boys in Class 12.
Boys in 12th = 175.
Girls in 12th = 715 - (175) - (210 + 180) = 150.
the ratio of boys to girls in Class 10 is 5 : 8. Let us assume the number of boys and girls to be 5y and 8y respectively.
In Class 9, the number of boys is 20 more than that in Class 10. The number of girls in Class 10 is 25 more than that in Class 9.
Boys in 9th = 5y + 20.
Girls in 9th = 8y - 25.
Total students in 9th and 10th ==> 13y + 13y - 5 = 515
==> y = 20.
Boys in 9th = 120.
Girls in 9th = 135.
Boys in 10th = 100.
Girls in 10th = 160.
Boys in 11th = 210
Girls in 11th = 180.
Boys in 12th = 175.
Girls in 12th = 150.
the ratio of the total number of boys to that of girls in the Govind Public school = 120+100+210+175 : 135+160+180+150 = 605:625 = 121 : 125.
What is the difference between the total number of boys in Classes 11 and 12 taken together and the total number of girls in Classes 11 and 12 taken together?
Solution
For class 11th, let us assume that the number of boys and girls are 7x and 6x respectively.
We are given that 7x - 6x = 30 ==> x = 30.
Boys in 11th = 210
Girls in 11th = 180.
The combined strength of Classes 9 and 10 compared to the combined strength of Classes 11 and 12 is in the ratio 103 : 143 and total strength of the school is 1230.
Combined strength of 11th and 12th = 715.
Combined strength of 9th and 10th = 515.
The number of girls in Class 11 is 5 more than the number of boys in Class 12.
Boys in 12th = 175.
Girls in 12th = 715 - (175) - (210 + 180) = 150.
the ratio of boys to girls in Class 10 is 5 : 8. Let us assume the number of boys and girls to be 5y and 8y respectively.
In Class 9, the number of boys is 20 more than that in Class 10. The number of girls in Class 10 is 25 more than that in Class 9.
Boys in 9th = 5y + 20.
Girls in 9th = 8y - 25.
Total students in 9th and 10th ==> 13y + 13y - 5 = 515
==> y = 20.
Boys in 9th = 120.
Girls in 9th = 135.
Boys in 10th = 100.
Girls in 10th = 160.
Boys in 11th = 210
Girls in 11th = 180.
Boys in 12th = 175.
Girls in 12th = 150.
the difference between the total number of boys in Classes 11 and 12 taken together and the total number of girls in Classes 11 and 12 taken together is (210+175) - (180+150) = 55.
Find the ratio of the number of girls in Class 11 to the number of boys in Class 10.
Solution
For class 11th, let us assume that the number of boys and girls are 7x and 6x respectively.
We are given that 7x - 6x = 30 ==> x = 30.
Boys in 11th = 210
Girls in 11th = 180.
The combined strength of Classes 9 and 10 compared to the combined strength of Classes 11 and 12 is in the ratio 103 : 143 and total strength of the school is 1230.
Combined strength of 11th and 12th = 715.
Combined strength of 9th and 10th = 515.
The number of girls in Class 11 is 5 more than the number of boys in Class 12.
Boys in 12th = 175.
Girls in 12th = 715 - (175) - (210 + 180) = 150.
the ratio of boys to girls in Class 10 is 5 : 8. Let us assume the number of boys and girls to be 5y and 8y respectively.
In Class 9, the number of boys is 20 more than that in Class 10. The number of girls in Class 10 is 25 more than that in Class 9.
Boys in 9th = 5y + 20.
Girls in 9th = 8y - 25.
Total students in 9th and 10th ==> 13y + 13y - 5 = 515
==> y = 20.
Boys in 9th = 120.
Girls in 9th = 135.
Boys in 10th = 100.
Girls in 10th = 160.
Boys in 11th = 210
Girls in 11th = 180.
Boys in 12th = 175.
Girls in 12th = 150.
the ratio of the number of girls in Class 11 to the number of boys in Class 10 is 180 : 100 = 9:5.
Express the total number of girls in Classes 9 and 10 taken together as a percentage of the total number of boys in Classes 11 and 12 taken together. [Give your answer correct to the nearest integer value.]
Solution
For class 11th, let us assume that the number of boys and girls are 7x and 6x respectively.
We are given that 7x - 6x = 30 ==> x = 30.
Boys in 11th = 210
Girls in 11th = 180.
The combined strength of Classes 9 and 10 compared to the combined strength of Classes 11 and 12 is in the ratio 103 : 143 and total strength of the school is 1230.
Combined strength of 11th and 12th = 715.
Combined strength of 9th and 10th = 515.
The number of girls in Class 11 is 5 more than the number of boys in Class 12.
Boys in 12th = 175.
Girls in 12th = 715 - (175) - (210 + 180) = 150.
the ratio of boys to girls in Class 10 is 5 : 8. Let us assume the number of boys and girls to be 5y and 8y respectively.
In Class 9, the number of boys is 20 more than that in Class 10. The number of girls in Class 10 is 25 more than that in Class 9.
Boys in 9th = 5y + 20.
Girls in 9th = 8y - 25.
Total students in 9th and 10th ==> 13y + 13y - 5 = 515
==> y = 20.
Boys in 9th = 120.
Girls in 9th = 135.
Boys in 10th = 100.
Girls in 10th = 160.
Boys in 11th = 210
Girls in 11th = 180.
Boys in 12th = 175.
Girls in 12th = 150.
the total number of girls in Classes 9 and 10 taken together as a percentage of the total number of boys in Classes 11 and 12 taken together = $$\frac{135+160}{210+175}\times\ 100\ \approx\ 77\%$$.
In another school, the total number of students in Classes 10 and 12 taken together was identical to the total number of students in Classes 10 and 12 taken together in the Govind Public school mentioned in the comprehension passage given above. However, in the other school, 60% of these students
were girls. How many girls were there in Classes 10 and 12 taken together in the other school?
Solution
For class 11th, let us assume that the number of boys and girls are 7x and 6x respectively.
We are given that 7x - 6x = 30 ==> x = 30.
Boys in 11th = 210
Girls in 11th = 180.
The combined strength of Classes 9 and 10 compared to the combined strength of Classes 11 and 12 is in the ratio 103 : 143 and total strength of the school is 1230.
Combined strength of 11th and 12th = 715.
Combined strength of 9th and 10th = 515.
The number of girls in Class 11 is 5 more than the number of boys in Class 12.
Boys in 12th = 175.
Girls in 12th = 715 - (175) - (210 + 180) = 150.
the ratio of boys to girls in Class 10 is 5 : 8. Let us assume the number of boys and girls to be 5y and 8y respectively.
In Class 9, the number of boys is 20 more than that in Class 10. The number of girls in Class 10 is 25 more than that in Class 9.
Boys in 9th = 5y + 20.
Girls in 9th = 8y - 25.
Total students in 9th and 10th ==> 13y + 13y - 5 = 515
==> y = 20.
Boys in 9th = 120.
Girls in 9th = 135.
Boys in 10th = 100.
Girls in 10th = 160.
Boys in 11th = 210
Girls in 11th = 180.
Boys in 12th = 175.
Girls in 12th = 150.
Total number of students in 10th and 12th combined = 100+160 + 175+150 = 585.
60% are girls which means that 351 are girls in the Other School.
