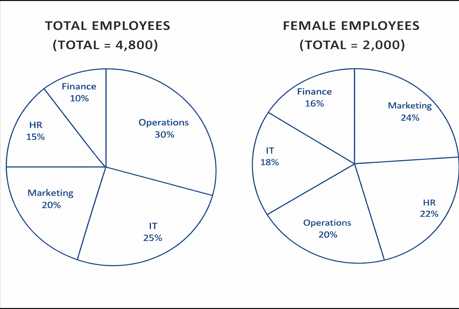
Study the following two pie charts carefully to answer the questions that follow. The first pie chart shows the percentage distribution of the "Total Employees (4,800)" working in five different departments (HR, IT, Marketing, Operations, and Finance) of a company.The second pie chart shows the percentage distribution of "Female Employees (2,000)" working in the same five departments.
Note: Total Employees = Male Employees + Female Employees.
In which department is the percentage of male employees (with respect to the total employees of that specific department) the highest?
Solution
The table can be constructed as:
_COiEx7y.png)
Percentage of male employees with respect to the total employees is highest for Operations.
Get AI Help

SRCC Quant Questions | SRCC Quantitative Ability
SRCC DILR Questions | LRDI Questions For SRCC
SRCC Verbal Ability Questions | VARC Questions For SRCC
Free SRCC DILR Questions
Book Free CAT Mentorship
Get personalized CAT strategy from a 99%iler
500+ students mentored
OTP Verification
Enter the 6-digit code sent to your phone
Booking Summary
Enter OTP
Didn't receive the OTP?


