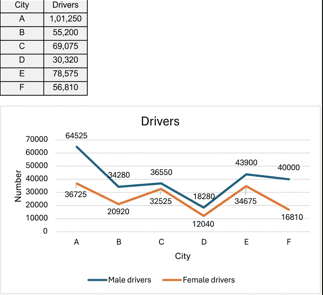
The given table depicts the number of drivers in 6 cities and the graph depicts the distribution of the drivers as male and female in the said cities. Study the table and graph and answer the questions that follow
Which of the following options most closely represents the difference, expressed as a percentage, between male and female drivers out of the totalnumber of drivers across all the cities combined?
Solution
_nIZraRW.png)
Difference between total male and female drivers = 237535 - 153695 = 83840.
Required percentage = $$\frac{83840}{391230}\times\ 100\ \approx\ 21\%$$.
Get AI Help

SRCC Quant Questions | SRCC Quantitative Ability
SRCC DILR Questions | LRDI Questions For SRCC
SRCC Verbal Ability Questions | VARC Questions For SRCC
Free SRCC DILR Questions
Book Free CAT Mentorship
Get personalized CAT strategy from a 99%iler
500+ students mentored
OTP Verification
Enter the 6-digit code sent to your phone
Booking Summary
Enter OTP
Didn't receive the OTP?


