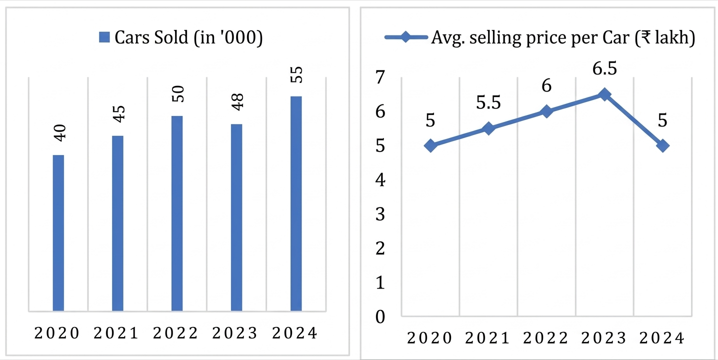
Auto-Grow Ltd., an automobile manufacturing company, tracks its annual car sales (in thousand units) and average selling price per car (in ₹ lakh) over a period of five consecutive years from 2020 to 2024. The company uses a mixed graph where the bar chart represents the number of cars sold and the line graph represents the average selling price per car.
Additional information:
The manufacturing cost per car was constant at ₹2 lakh from 2020 to 2022 and increased by10% each year thereafter.
The company incurred fixed operational costs of ₹100 crore per year.
Profit (or loss) for a year = Total revenue − (Total variable cost + Fixed cost).
Ignore taxes and depreciation.
The company defines profit margin as $$\frac{\Pr ofit}{Total\ Revenue}\times\ 100$$. The year with the least profit margin is:
Solution
Using the given data, we construct the following table where all the prices are in lakhs.
_8LUP1ej.png)
The year with the least profit margin is 2024.
Get AI Help

SRCC Quant Questions | SRCC Quantitative Ability
SRCC DILR Questions | LRDI Questions For SRCC
SRCC Verbal Ability Questions | VARC Questions For SRCC
Free SRCC DILR Questions
Book Free CAT Mentorship
Get personalized CAT strategy from a 99%iler
500+ students mentored
OTP Verification
Enter the 6-digit code sent to your phone
Booking Summary
Enter OTP
Didn't receive the OTP?


