Please enter the following details


The multi-layered pie-chart below shows the sales of LED television sets for a big retail electronics outlet during 2016 and 2017. The outer layer shows the monthly sales during this period, with each label showing the month followed by sales figure of that month. For some months, the sales figures are not given in the chart. The middle-layer shows quarterwise aggregate sales figures (in some cases, aggregate quarter-wise sales numbers are not given next to the quarter). The innermost layer shows annual sales. It is known that the sales figures during the three months of the second quarter (April, May, June) of 2016 form an arithmetic progression, as do the three monthly sales figures in the fourth quarter (October, November, December) of that year.
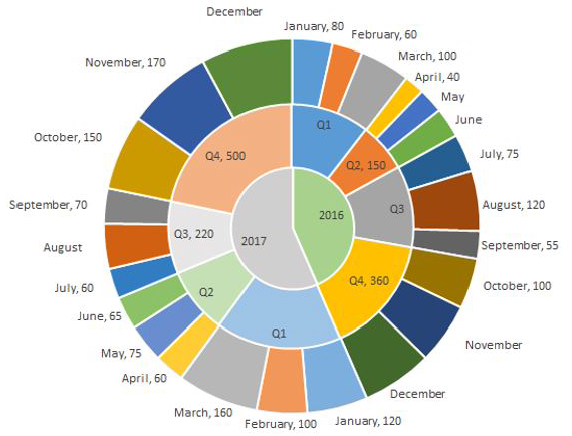
What is the percentage increase in sales in December 2017 as compared to the sales in December 2016?
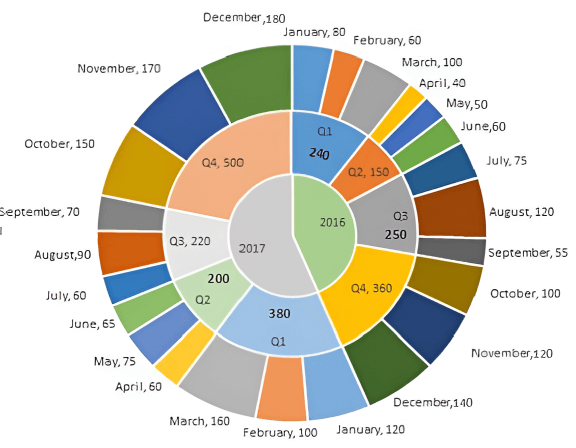
We have been given details about the quarterly sales figures. Also, we have been given details about the sales figures every month. Some of the data are missing and some additional conditions have been given in the question. Let us try to complete the pie chart as much as possible with the data available to us.
It is known that the sales figures during the three months of the second quarter (April, May, June) of 2016 form an arithmetic progression.
We know that the sales in April is 40.
Let the sales in May be 40+x and the sales in June be 40+2x.
We know that the total sales in Q2 is 150.
=> 40 + 40 + x + 40 + 2x = 150
3x = 30
x = 10
Therefore, sales in May 2016 = 40 + 10 = 50
Sales in June 2016 = 40 + 20 = 60
Similarly, it has been given that the sales in October, November, and December 2016 form an arithmetic progression.
Sales in October = 100
Sales in Q4 = 360
Let the sales in November be 100+y and the sales in December be 100+2y.
100 + 100 + y + 100 + 2y = 360
300 + 3y = 360
=> y = 20
Sales in November 2016 = 120 and Sales in December 2016 = 140
Sales in Q1 of 2016 = Sum of the sales in the months of January, February, and March 2016
= 80 + 60 + 100
= 240
Sales in Q3 of 2016 = Sum of the sales in the months of July, August, and September 2016
= 75 + 120 + 55
= 250
Sales in Q1 of 2017 = 120 + 100 + 160 = 380
Sales in Q2 of 2017 = 65 + 75 + 60 = 200
We know that sales in Q3 of 2017 = 220
Let the sales in August of 2017 be ‘a’.
60 + 70 + a = 220
=> a = 90
Sales in August 2017 = 90
We know that sales in Q4 of 2017 = 500
Let the sales in December of 2017 be ‘d’.
150 + 170 + d = 500
=> d = 180
Sales in December 2017 = 180
Sales in December 2016 = 140
Sales in December 2017 = 180
Percentage change = (180-140)/140 = 40/140 = 28.57%
Therefore, option C is the right answer.
Video Solution

Your Doubts
Drop Your File Here!

Ask Your Doubt
Drop Your File Here!
Create a FREE account and get:
- All Quant CAT complete Formulas and shortcuts PDF
- 38+ CAT previous year papers with video solutions PDF
- 5000+ Topic-wise Previous year CAT Solved Questions for Free