Please enter the following details


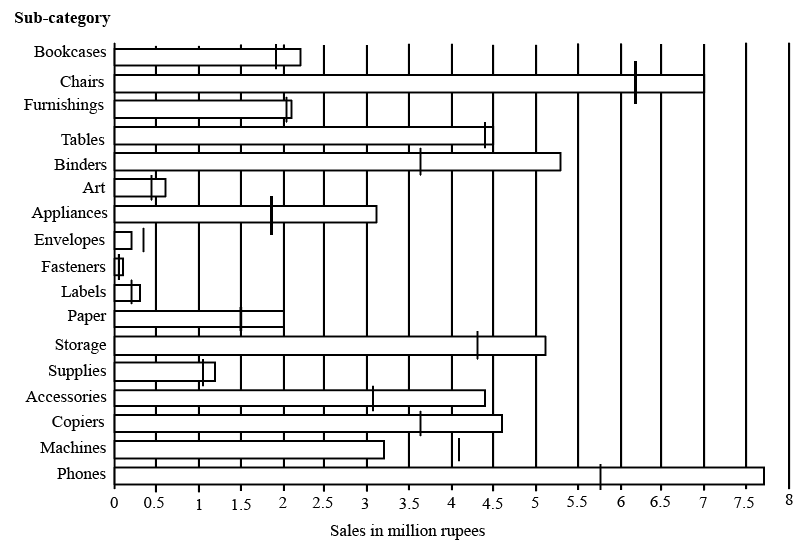
The horizontal bars in the above diagram represent 2020 aggregate sales (in ₹ million) of a company for the different subcategories of its products. The top four product subcategories (Bookcases, Chairs, Furnishings, Tables) belong to furniture product category; the bottom four product subcategories (Accessories, Copiers, Machines, Phones) belong to the technology product category while all other product subcategories belong to the office supply product category. For each of the product subcategories, there is a vertical line indicating the sales of the corresponding subcategory in 2019.
The total sales (in ₹ million) in 2019 from products in office supplies category is closest to
The total sales from products in the office supply category in 2019 is :
Sum of sales of :
Binders: 3.6 million
Art : 0.4 million.
Appliances: 1.9 million
Envelops: 0.3 million
Fasteners: 0.1 million
Labels: 0.2 million
Paper = 1.5 million.
Storage: 4.3 million.
Supplies: 1.1 million.
The sum of sales of these products = 3.6+0.4+1.9+0.3+0.1+0.2+1.5+4.3+1.1 = 13.4 million.
The closest among the option is 13.5 million.
Video Solution

Your Doubts

Drop Your File Here!

Ask Your Doubt
Drop Your File Here!
Create a FREE account and get:
- All Quant CAT complete Formulas and shortcuts PDF
- 38+ CAT previous year papers with video solutions PDF
- 5000+ Topic-wise Previous year CAT Solved Questions for Free