Following table shows the percentage population of six states below poverty line and proportion of male and female.

Sign in
Please select an account to continue using cracku.in
↓ →
Following table shows the percentage population of six states below poverty line and proportion of male and female.
If the total population of state A is 5000 then what is the no. of females above poverty line in state A?
Total population of A=5000
Population of A below poverty line =16% => population of A above poverty line = 84% = 4200
Number of females above poverty line in A = $$\frac{4}{7}\cdot4200\ =2400$$
If the population of C&D together is 20000 what is the total no. of females below poverty line in the above states?
Since the individual populations of C and D aren't given , the number of females below poverty line cannot be determined.
If the population of males below poverty line in state C is 6000 & state E 1000 then what is the ratio of the total population of state C& E is
Let total population of C and E be 100x and 100y respectively.
Number of males below poverty line in C = $$\frac{3}{7}\cdot14x$$ = 6x = 6000 => x=1000
Number of males below poverty line in E = $$\frac{4}{5}\cdot25y$$ = 20y=1000=>y= 50
Hence ratio = 20:1
If in state F population of females below poverty line is 16000, then what is the population of males below poverty line in that state?
Let total population of F be 100x
Population below poverty line = 20x
Females below poverty line = $$\frac{3}{5}\cdot\ 20x=12x$$ = 16000
=> x= 1333.333
Males below poverty line = $$\frac{2}{5}\cdot\ 20x=8x$$ = 10666.66
Study the pie chart and table carefully to answer the questions that below:


What is the number of women in the accounts department ?
Total employees in Accounts department= 8% of 4600= 368
Ratio of Men: women= 1:3
So, total women in accounts department= $$\ \frac{\ 1}{4}\times\ 368=92$$
What is the total number of employees working in the IT department and HR department together ?
The total number of employees :4600
Now total percentage of employees working in IT and HR : 26+11 =37 %
Total number of employees woking in the two sectors = 4600(0.37)
=1702
Thus, the correct option is D.
What is the ratio of the total number of men to the total number of women working in all the departments together ?
Number of Men in HR= $$\ \frac{\ 1}{2}\times11\%\ of\ 4600=\ \ \frac{\ 1}{2}\times\ \ \frac{\ 11}{100}\times\ 4600=253\ $$
Number of Men in Accounts=$$\ \frac{\ 3}{4}\times8\%\ of\ 4600=\ \ \frac{\ 1}{2}\times\ \ \frac{\ 8}{100}\times\ 4600=276\ $$
Number of Men in Production= $$\ \frac{\ 3}{5}\times15\%\ of\ 4600=\ \ \frac{\ 1}{2}\times\ \ \frac{\ 15}{100}\times\ 4600=414\ $$
Number of Men in IT= $$\ \frac{\ 1}{4}\times26\%\ of\ 4600=\ \ \frac{\ 1}{2}\times\ \ \frac{\ 26}{100}\times\ 4600=299\ $$
Number of Men in Marketing= $$\ \frac{\ 1}{2}\times22\%\ of\ 4600=\ \ \frac{\ 1}{2}\times\ \ \frac{\ 22}{100}\times\ 4600=506\ $$
Number of Men in Merchandising= $$\ \frac{\ 5}{6}\times18\%\ of\ 4600=\ \ \frac{\ 1}{2}\times\ \ \frac{\ 18}{100}\times\ 4600=690\ $$
Total men= 253+276+414+299+506+690=2438.
Total Women= 4600-2438=2162.
Ratio of men and women= $$\ \frac{\ 2438}{2162}=\ $$= $$\ \frac{\ 53}{47}\ $$
Hence, Option C
The number of women in the merchandising department forms what per cent of the total number of employees in the organization ?
Total Employees =4600.
Total employees in Merchandising= 18% of 4600= 828.
Ratio of women and men= 1/5.
So, number of women= $$\ \frac{\ 1}{6}\times828=\ 138\ $$
% of women= $$\ \frac{\ 138}{4600}\times100=\ 3\%\ $$
What is the ratio of the number of men in the production department to the number of men in the marketing department ?
Total employees given= 4600
Total employees in production = 15% of 4600= 690.
Ratio of men and women in Production= 3:2
Number of men= $$\ \ \frac{\ 3}{5}\times\ 690=3\times\ 138=414$$
Total employees in Marketing= 22% of 4600= 22$$\times\ $$46= 1012.
Ratio of men and women in Production= 1:1
Therefore number of men= $$\ \frac{\ 1}{2}\times\ 1012=\ 506$$
So, Number of men in Production: Number of men in Marketing= $$\ \frac{\ 414}{506}=\ \frac{\ 9}{11}$$
Answer the questions on the basis of the information given below.
The following bar graph gives the production, exports and per capita consumption of rice in country A, for the five years from 2006 to 2010.

Consumption = Production - Exports
Per Capita Consumption = (Consumption) $$\div$$ (Population)
In which year was the percentage increase in the consumption of rice over the previous year, the highest?

From the above table, it is clear that the percentage increase in the consumption of rice over the previous year was highest in 2008
B is the correct answer.
What is the population of country A in the year 2008 (in million)?
Population = $$\ \frac{\ Consumption}{Percapita\ consumption}$$
In 2008, the population of A = $$\ \frac{\ 230-138}{38.7}\ $$ = 2.79 million
C is the correct answer.
The ratio of exports to consumption in the given period was the highest in the year

Exports to consumption ratio was highest in the year 2006
Answer is option A.
In which of the given years was the population of country A, the highest?
Population = $$\ \frac{\ Consumption}{Percapita\ consumption}$$

The population of country A was the highest in the year 2010.
Which of the designs best completes the following sequence?

Option A is correct,
In the centre region, the dots and stripes are alternating, thus the centre will now be "dots".
Hexagon and circles will alternate in twos.
Refer to the given bar diagram showing the sales (in Rs. crores) of top market brands among pain killers in India and answer the questions.

What is the difference between the sales of Voveran in 2006 and those of Calpol in 2005 (in Rs. lacs)?
The sales of Voveran in 2006 = 23 Crore
The sales of Calpol in 2005 = 13 Crore
Difference= 10 Crore
i.e 1000 lakhs
Percentage of increase in sales from 2005 to 2006 is the highest for which brand of a pain killer?
Percentage of increase in sales from 2005 to 2006:
Voveran: (23-16)/16= 43.75
Volini: (9.5-6.5)/6.5=46.15
Dolonex:(10-6)/6= 66.66
Sumo:(7-5)/5=40
Option C is correct.
Percentage increase in sales from 2005 to 2006 is the lowest for which brand of a pain killer?
Percentage of increase in sales from 2005 to 2006:
Voveran: (23-16)/16= 43.75%
Volini: (9.5-6.5)/6.5=46.15%
Moov: 1/4= 25%
Nise: (18-15)/15=20%
Option D
What is the approximate percentage of increase in the sales of Voveran from 2005 to 2006?
Percentage of increase in sales from 2005 to 2006:
Voveran: (23-16.5)/16.5= 39.39% ..(nearly) 40%
Option B
What number should replace the question mark in the image below?

Lower number is eight times the upper number, i.e.
6 $$\times\ $$ 8 = 48
12 $$\times\ $$ 8 = 96
y $$\times\ $$ 8 = 192
y = $$\frac{192}{8}$$ = 24
Answer is option D.
What image from bottom row should replace the question mark?

Images are shifting by one position to the left side. In each step, there are two shaded and one unshaded image. Therefore, shaded triangle with index C at upper vertex will fill the blank.
Image 6 is suitable image and answer is option B.
The pie charts below show the percentage of students in each faculty at North West University and the number of non-US students in the Arts faculty. These percentages have been rounded to the nearest whole number. There are a total of 1049 students in Arts faculty. Use this information to answer the following questions.


What percentage of students in the Arts faculty are non-US students?
Total students in Arts faculty = 1049
Total non US students in arts faculty = 79+21+6+2+4 = 112
Now in percentage
We get :$$\frac{112}{1049}\times\ 100$$= 11%
How many students are there in the Engineering faculty?
Let the total number of students be x
Now it is given that 1049 students are in arts which is 23%
so we can say
x(23/100) = 1049
We get x =4560
Now Engineering faculty = 9%
so we get number = (0.09)(4560) = 410
How many students are there at the University?
Let the total number of students be x
Now it is given that 1049 students are in arts which is 23%
so we can say
x(23/100) = 1049
We get x =4560
If six percent of Science students are Asian. How many Asian students are studying Science?
Let the total number of students be x
Now it is given that 1049 students are in arts which is 23%
so we can say
x(23/100) = 1049
We get x =4560
Now students studying science will be 4560(21/100) = 957
Now Asian students are studying Science will be 6% of total science
= 0.06(957)
= 57
There are 34 European medical students. What percentage of the faculty does this represent?
Let the total number of students be x
Now it is given that 1049 students are in arts which is 23%
so we can say
x(23/100) = 1049
We get x =4560
Now we know that medical students = 5%
So number of medical students : 4560(0.05) = 228 students
Now out of this 34 students are European
So percentage of these with respect to total = $$\frac{34}{228}\times\ 100\ =\ 15\%$$
The table below shows the number of people who responded to a survey about their favourite style of music. Use this information to answer the following questions to the nearest whole percentage.

What percentage of respondents under 31 indicated that Blues is their favourite style of music?
Total number of respondents under 31 = 66
Total number of persons who liked blue = 3+2 =5
So in percentage we get (5/66 )(100) = 7.6
What percentage of respondents aged 21-30 indicated a favourite style other than Rock music?
Total respondents in 21-30 =33
Respondents liking Rock = 12
So respondents liking other = 33-12 =21
Therefore in percentage : (21/33)*100 = 64%
What percentage of the total sample indicated that Jazz is their favourite style of music?
Total number of people liking Jazz = 16
Total sample = 68+66 =134
So percentage = (16/134)(100) =12%
Answer the questions based on the information given below
The Venn diagram given below shows the estimated readership of 3 daily newspapers (X, Y & Z) in a city. The total readership and advertising cost for each of these papers is as below
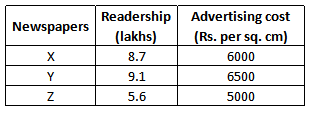
The total population of the city is estimated to be 14 million. The common readership (in lakhs) is indicated in the given Venn diagram
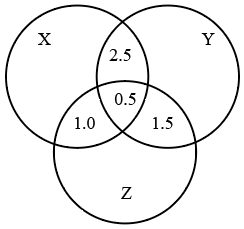
The number of people (in lakhs) who read at least one newspaper is

Now X = 8.7-2.5-0.5-1 =4.7
Y = 9.1-2.5-0.5-1.5 =4.6
Z = 5.6-1-1.5-0.5 =3.1
Now at least 1 will be
4.7+4.6+3.1+2.5+1+1.5+0.5 = 17.4
A factory is to commission two production lines. Production line 1 is to use existing technology. Production line 2 is to use the latest innovation in technology and, while promising to achieve considerable advances in productivity, it will take longer to start and is likely to experience teething problems. Graph indicates the productive record of each product line. Refer to the graph to answer the following

A. Can the duration of reported breakdown be established?
B. Can the loss of production be quantified?
As the graph representing production line 1 is showing a steady increase, the given graphs represent cumulative productions. The graph representing production line 2 is showing no change from the 4th month to 6th month so It was the period of breakdown.
As the graph representing production line 2 is not following any pattern, we cannot quantify the loss of production as the production in those months cannot be determined.
So Only A can be answered
The image below indicates the number of residents at 5 hotels on 1 Feb and 1 July 1998. Which hotel had the greatest increase in the total number of adult residents on 1 July 1998 compared with 1 Feb of that year?

Tabulating the percentage, we get

From the table, in case of Y, the percentage is 50% and rest of the hotels have less than 50%. Hence C is the answer.
Coefficient of variation is useful to study
In statistics, the coefficient of variation (COV) is a simple measure of relative event dispersion. It is equal to the ratio between the standard deviation and the mean. The most common use of the COV is to compare relative risk, although it can be applied to any type of quantitative likelihood or probability distribution.
There is another use and meaning of the COV. When interpreting mathematical models, COV is calculated as the ratio between root mean squared error and the mean of a separate dependent variable. This type of COV analysis is less common, but it can be constructive when determining if a model is a good fit for a specific task or type of analysis. It is used to measure disparity and consistency.
Answer the following questions based on the information given below.
A survey of movie goers from five cities A, B, C, D and E is summarized below. The first column gives the percentage of viewers in each city who watch less than one movie a week. The second column gives the total number of viewers who view one or more movies per week

How many viewers in the city C watch less than one movie a week?
The total number of moviegoers in a city = Number of people who watch less than 1 movie per week + Number of people who watch one or more movie per week
For city A, the percentage of viewers who watch less than one movie a week = 60, hence the percentage of viewers who view one or more movies per week = 100-60 = 40
=> 40% of the total number of viewers in A = 2400 => The total number of viewers = $$\ \frac{\ 2400\times\ 100}{40}$$ = 6000
=> The number of viewers who watch less than one movie a week = $$6000\times\ \frac{\ 60}{100}$$ =3600
Similarly, we can tabulate the data for the rest of the cities:

The viewers in the city C watch less than one movie a week = 13600
Which city has the highest number of viewers who watch less than one movie a week?
The total number of moviegoers in a city = Number of people who watch less than 1 movie per week + Number of people who watch one or more movie per week
For city A, the percentage of viewers who watch less than one movie a week = 60, hence the percentage of viewers who view one or more movies per week = 100-60 = 40
=> 40% of the total number of viewers in A = 2400 => The total number of viewers = $$\ \frac{\ 2400\times\ 100}{40}$$ = 6000
=> The number of viewers who watch less than one movie a week = $$6000\times\ \frac{\ 60}{100}$$ =3600
Similarly, we can tabulate the data for the rest of the cities:
E has the highest number of viewers who watch less than one movie a week.
A city with second lowest number of movie watchers is
The total number of moviegoers in a city = Number of people who watch less than 1 movie per week + Number of people who watch one or more movie per week
For city A, the percentage of viewers who watch less than one movie a week = 60, hence the percentage of viewers who view one or more movies per week = 100-60 = 40
=> 40% of the total number of viewers in A = 2400 => The total number of viewers = $$\ \frac{\ 2400\times\ 100}{40}$$ = 6000
=> The number of viewers who watch less than one movie a week = $$6000\times\ \frac{\ 60}{100}$$ =3600
Similarly, we can tabulate the data for the rest of the cities:
Both A and D have second lowest number of movie watchers. B is the answer.
The total number of all movie goers in the five cities who watch less than one movie per week is
The total number of moviegoers in a city = Number of people who watch less than 1 movie per week + Number of people who watch one or more movie per week
For city A, the percentage of viewers who watch less than one movie a week = 60, hence the percentage of viewers who view one or more movies per week = 100-60 = 40
=> 40% of the total number of viewers in A = 2400 => The total number of viewers = $$\ \frac{\ 2400\times\ 100}{40}$$ = 6000
=> The number of viewers who watch less than one movie a week = $$6000\times\ \frac{\ 60}{100}$$ =3600
Similarly, we can tabulate the data for the rest of the cities:
The total number of all moviegoers in the five cities who watch less than one movie per week = 3600+750+13600+3300+24000 = 45250
The following pie-charts give the percentage distribution of employees in different Departments in XYZ Company Ltd. during the years 2005 and 2006. Answer the questions using this data.

If the average monthly salary of employees in Administration was Rs 12,000 in 2005, what was the approximate total Salary expense of Administration in 2005?
Average Salary in Administration = $$\ \frac{\ Total\ Salary\ }{Total\ number\ of\ People}$$
Total number of people on Administration = $$22\%\ of\ 18,000\ =\ 3,960$$
Hence $$12,000\ =\ \frac{\ Total\ Salary}{3,960}$$
Total Salary = $$12,000\times\ 3960\ =\ 47520000$$ = $$4.7\ crores$$
What is the percentage increase in No. of employees in Sales & Marketing?
No of the employees in Sales & Marketing in 2005 = $$18\%\ of\ 18,000\ =\ 3240$$
No of the employees in Sales & Marketing in 2006 = $$20\%\ of\ 20,000\ =\ 4000$$
Percent Increase = $$\ \frac{\ 4000-3240}{3240}\times\ 100\%\ =\ 23.45\%$$
In which Dept is the variation in strength the maximum in 2006?

From above chart we can get the following table.
Variation of A = |4800-3960| = 840
Variation of B = |5200-4140 | = 1060
Variation of C = |4000-3240 | = 760
Variation of D = | 4000 - 5220 | = 1220
Variation of E = |2000-1440| =560
D has max variation
If 300 employees left Operations at the end of 2005, how many joined in 2006?

From the above charts, the following table can be made.
Let $$N$$ be the number of people who joined in 2006 in Operations department, then
$$\ 4140-300+N\ =5200$$
$$N\ =1360$$
The following table gives cost data of select stock prices on 3rd Dec 2003 in two markets, BSE of India and NQE of Kya Kya island. Closing stock refers to the price at the close of trading hours and opening stock to the price at the beginning of the day. The currency of Kya Kya is # and the exchange rate is # = Rs 11.

Which share and which market showed the highest % increase on 3rd Dec 2003?
We will go by the options to check each one of them
Option A says SIFY on BSE.
% increase= $$\ \frac{\text{ Closing Price-Opening Price}}{\text{Opening Price}}\cdot100\%=\ \frac{\ 247-232}{232}\cdot100\%=\ \ \frac{\ 15}{232}\cdot100\%=6.465\%$$
Option B says INFY on NQE.
% increase= $$\ \frac{\text{ Closing Price-Opening Price}}{\text{Opening Price}}\cdot100\%=\ \frac{\ 10.5-9.5}{9.5}\cdot100\%=\ \ \frac{\ 1}{9.5}\cdot100\%=10.52\%$$
Option C says Wipro on NQE.
% increase= $$\ \frac{\text{ Closing Price-Opening Price}}{\text{Opening Price}}\cdot100\%=\ \frac{\ 6.5-5.5}{5.5}\cdot100\%=\ \ \frac{\ 1}{5.5}\cdot100\%=18.18\%$$
Option D says TCS on NQE
% increase= $$\ \frac{\text{ Closing Price-Opening Price}}{\text{Opening Price}}\cdot100\%=\ \frac{\ 40-40.5}{40.5}\cdot100\%=\ \ \frac{\ -0.5}{40.5}\cdot100\%=-1.23\%$$
So, Option C shows the highest increase.
Arbitrage means buying in one market and selling simultaneously in another market. If Mr. Ghosh Babu were to buy a share at the opening price on one exchange and be able to sell it at the opening price on the other exchange, on which share does he make maximum % profit?
First we convert the currency of Kya Kya into Rs. by multiplying the values to 11 and we can get the following table:

In SIFY, profit made by him= $$\ \frac{\ 232-231}{231}\cdot100\%=0.43\%$$
In INFY, profit made= $$\ \frac{\ 105-104.5}{104.5}\cdot100\%=0.47\%$$
In WIPRO, profit made= $$\ \frac{\ 60.5-60}{60}\cdot100\%=0.83\%$$
In TCS, Profit made= $$\ \frac{\ 450-445.5}{445.5}\cdot100\%=1.01\%$$
Therefore, max profit is made in TCS share
In an M&A deal SIFY is purchased by its parent company SATYAM which purchases 15% of SIFY’s equity shares. Total SIFY’s equity shares is 1 million. How much does Satyam pay in Rs. for the stake if 50% of its purchases were on BSE’s opening price and balance on BSE’s closing price?
Given, total shares of SIFY= 1000000
Shares purchased by SATYAM= 15% of 1000000= 150000.
Now, 50% of the shares were purchased at BSE's opening price i.e. Rs. 232 and 50% of the shares were purchased at BSE's closing price, Rs. 247.
So, total amount paid by SATYAM= 75000*(232)+ 75000(247)= Rs. 75000(479)= Rs. 35925000 which is close to Rs. 36 millions.
The following chart presents the data collected for an on-line job portal InfiniteJobs.com. For each Question, there are two Statements, each of which could be either True or False. Choose one of the following options as an answer:

Statement X: The percentage increase in number of Registrations from 2004 to 2005 is higher for Managerial candidates than for Technical candidates
Statement Y: The overall Registrations have grown by more than 25%
Considering statement X,
Percentage increase for Managerial candidates= $$\ \frac{\ \left(45292-19236\right)}{19236}\cdot100=\ \ \frac{\ 26056}{19236}\cdot100=135.45\%$$
Percentage increase in Technical candidates= $$\ \frac{\ \left(63298-61205\right)}{61205}\cdot100=3.3\%$$
Therefore statement X is true.
Considering statement Y,
Total registrations in 2004= 61205+19236= 80441.
Total registrations in 2005= 63298+45292= 108690.
So, growth in the overall number of registrations= $$\ \frac{\ \left(108690-80441\right)}{80441}\cdot100=35.11\%$$, which is greater than 25%.
So, both statement X and Y are true.
Statement X: The percentage of drop-outs (from Registration stage to posting CV’s) had decreased from 2004 to 2005 for Managerial category
Statement Y: The percentage of drop-outs was higher for Technical than for Managerial category in 2005
Statement X:
Percentage of drop-outs for Managerial category in 2004 = $$\ \frac{\ 19236\ -\ 15389}{19236}\times\ 100\ \approx\ 20\%$$
Percentage of drop-outs for Managerial category in 2005 = $$\ \frac{\ 45292\ -\ 40763}{45292}\times\ 100\ \approx\ 10\%$$
Therefore, percentage of drop-outs from 2004 to 2005 has decreased. Statement X is true.
Statement Y:
Percentage of drop-outs for Managerial category in 2005 = $$\ \frac{\ 45292\ -\ 40763}{45292}\times\ 100\ \approx\ 10\%$$
Percentage of drop-outs for Technical category in 2005 = $$\ \frac{\ 63298\ -\ 60133}{63298}\times\ 100\ \approx\ 5\%$$
Percentage of drop-out is lower for Technical category.
Statement Y is false
Answer is option A.
Statement X: The success rate of candidates getting short-listed based on CV’s is higher for Managerial category than for Technical category in 2005.
Statement Y: The success rate of candidates getting short-listed based on CV’s is better for Managerial category in 2005 than in 2004.
Evaluating statement X,
In the year 2005, In Managerial category, the number of candidates the number of candidates shortlisted based on CV=$$\ \frac{\ 399}{40763}=0.00978$$
In the year 2005, In Technical category, the number of candidates the number of candidates shortlisted based on CV=$$\ \frac{\ 637}{60133}=0.0106$$
So, statement X is false.
Evaluating statement Y,
In the year 2005, In Managerial category, the number of candidates the number of candidates shortlisted based on CV=$$\ \frac{\ 399}{40763}=0.00978$$
In the year 2004, In Managerial category, the number of candidates the number of candidates shortlisted based on CV=$$\ \frac{\ 138}{15389}=0.00896$$
So, statement Y is True. Hence, Option B.
Statement X: In 2004, the number of candidates offered jobs as a proportion of the number of CV’s posted was higher for Technical than for Managerial candidates
Satement Y: In 2004, among those short-listed by Employers, the Technical category had a higher success rate in securing jobs than the Managerial category.
Let's evaluate statement X first.
For technical jobs in 2004, the number of candidates offered jobs as a proportion of the number of CV’s posted=$$\ \frac{\ 181}{59981}=0.00301$$
For Managerial jobs in 2004, the number of candidates offered jobs as a proportion of the number of CV’s posted=$$\ \frac{\ 48}{15389}=0.00312$$
So, statement X is false.
Evaluating Y,
In technical category in 2004, the number of candidates offered jobs as a proportion of the candidates shortlisted=$$\ \frac{\ 181}{684}=0.2646$$
In Managerial category in 2004, the number of candidates offered jobs as a proportion of the candidates shortlisted=$$\ \frac{\ 48}{138}=0.3478$$
So, statement Y is also false.
Hence, option D.
The following line graph shows the ratio of the wheat production to rice production of a state in India over a period 7 years from 1999 - 2006. Answer the questions based on this data.

If the rice production in 2003 was 4 lac tons what was its wheat production during 2003?
In the year 2003, Wheat: Rice=1.2 and it is given that Rice production= 4 lac tons.
Let the wheat production during 2003 be x.
So, $$\ \frac{\ x}{4}=\ \frac{\ 1.2}{1}$$
=> x= 4.8 lac tons
Study the weekly data table and daily data graph for Toya Motors share prices at the National Stock Exchange and answer the following questions. Toya Motors NSE Share prices for 3 months.

.png)
What is the average share price for 10/8/2005 to 12/9/2005?
Average of share price for 10/8 to 12/9 is $$\ \frac{\ 483+475+467+513}{4}$$ = 483
The drop in the sales price during October 2005 is approximately
Price at end of September (near to beginning of october)= 535
Price at the end October = 461
$$% decrease$$ = $$\frac{535-461\ }{535}\times\ 100\%$$
= $$13.83$$%
10% is the closest option
If you purchased 100 shares on 31/8/2005 and sold them on 10/10/2005 what will be your gains?
Money spent to buy 100 shares on 31/08 is 100*461 = 46,100
Money Recieved after selling 100 shares on 10/10 = 538*100 = 53,800
Overall profit = 53,800-46,100 = 7,700
Study the sector wise sales of a group of companies for the financial year 2004 - 2005 and answer the following questions.


This group of companies operates in multiple sectors. The holding company has decided to closely monitor minimum number of sectors (not exceeding 5) contributing together a major part (at least 80%) of sales of the group. Identify the correct set of sectors
Engineering, Material, Services and CIS contributes around 81% of market share.
The average profit against the sales across the sectors is 10% while the profit margin of engineering is 12% and CIS, 20%. What is the average profit across the remaining sectors?
Let us represent the sales revenue in terms of 'k'.
Total sales revenue = 100k
Sales revenue from Engineering = 31k
Sales revenue from CIS = 19k
Remaining revenue from other sectors = 50k
Profit margin = Profit/Revenue
Let the profit margin of remaining sectors be x%.
So the eqn is:
10*100k = x*50k + 12*31k + 20*19k
after cancelling 'k' from both sides, we get:
=> x = 4.94% (answer)
Terms of Service

Educational materials for CAT preparation