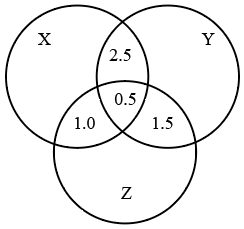
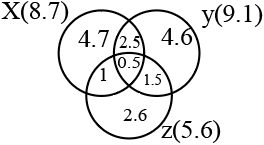
According to a survey conducted in a neighbourhood, at least 70% of the people read the Hindu, at least 75% of the people read the Times of India and at least 80% of the people read the Deccan Chronicle. What is the minimum percentage of people in the neighbourhood, who read all three newspapers?
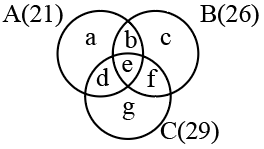
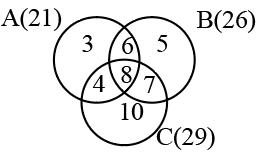
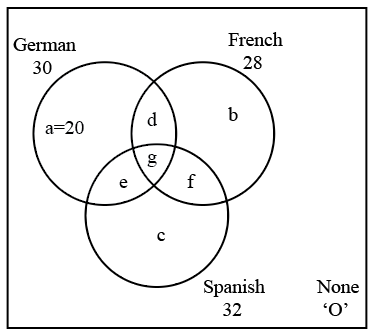
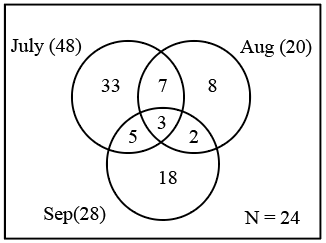
SNAP Venn Diagrams is an important topic in the Quantitative, Data Interpretation & Data Sufficiency section of the SNAP 2026 Exam. Questions from Venn Diagrams test a candidate's ability to analyze overlapping sets, interpret relationships between groups, and apply logical reasoning to solve counting problems. These questions often involve concepts such as sets, unions, intersections, and complements. Practicing topic-wise questions and solving problems from SNAP Previous Papers is an effective way to strengthen concepts and improve accuracy. Additionally, attempting SNAP Mock Tests will help candidates understand the latest exam pattern and the types of questions that can be expected in the actual exam. To gain a better understanding of all the topics covered in the exam, candidates should also refer to the SNAP Syllabus.