CAT 2003 Question Paper (Leaked)
DIRECTIONS for the following three questions: In each question, there are two statements: A and B, either of which can be true or false on the basis of the information given below.
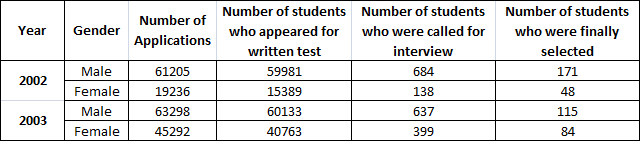
A research agency collected the following data regarding the admission process of a reputed management school in India.
CAT 2003 (Leaked) - Question 1
Statement A: The success rate of moving from written test to interview stage for males was worse than for females in 2003.
Statement B: The success rate of moving from written test to interview stage for females was better in 2002 than in 2003.
CAT 2003 (Leaked) - Question 2
Statement A: In 2002, the number of females selected for the course as a proportion of the number of females who bought application forms, was higher than the corresponding proportion for males.
Statement B: In 2002, among those called for interview, males had a greater success rate than females.
CAT 2003 (Leaked) - Question 3
Statement A: The percentage of absentees in the written test among females decreased from 2002 to 2003.
Statement B: The percentage of absentees in the written test among males was larger than among females in 2003.

DIRECTIONS for the following three questions: Answer the questions on the basis of the information given below.
The length of an infant is one of the measures of his/her development in the early stages of his/her life.
The figure below shows the growth chart of four infants in the first five months of life.
_4xriv7G.png)
CAT 2003 (Leaked) - Question 4
After which month did Seeta's rate of growth start to decline?
CAT 2003 (Leaked) - Question 5
Who grew at the fastest rate in the first two months of life?
CAT 2003 (Leaked) - Question 6
The rate of growth during the third month was the lowest for

CAT 2003 (Leaked) - Question 7
Among the four infants, who grew the least in the first five months of life? (in %)
DIRECTIONS for the following three questions: Answer the questions on the basis of the information given below.
The table below provides certain demographic details of 30 respondents who were part of a survey. The demographic characteristics are: gender, number of children, and age of respondents. The first number in each cell is the number of respondents in that group. The minimum and maximum age of respondents in each group is given in brackets. For example, there are five female respondents with no children and among these five, the youngest is 34 years old, while the oldest is 49.

CAT 2003 (Leaked) - Question 8
The percentage of respondents aged less than 40 years is at least
CAT 2003 (Leaked) - Question 9
Given the information above, the percentage of respondents older than 35 can be at most

CAT 2003 (Leaked) - Question 10
The percentage of respondents that fall into the 35 to 40 years age group (both inclusive) is at least
