Based on the above information which of the following is true?
CAT 2001 Question Paper
Directions for the following two questions: Answer the questions based on the following information.
The batting average (BA) of a Test batsman is computed from runs scored and innings played — completed innings and incomplete innings (not out) in the following manner:
$$r_1 =$$ Number of runs scored in completed innings
$$n_1 =$$ Number of completed innings
$$r_2 =$$ Number of runs scored in incomplete innings
$$n_2 =$$ Number of incomplete innings
$$BA=\frac{r_1+r_2}{n_1}$$
To better assess a batsman’s accomplishments, the ICC is considering two other measures $$MBA_1$$ and $$MBA_2$$ defined as follows:
$$MBA_1 = \frac{r_1}{n_1} + \frac{n_2}{n_1}*max[0,(\frac{r_2}{n_2}-\frac{r_1}{n_1})]$$
$$MBA_2 = \frac{r_1 + r_2}{n_1 + n_2}$$
Solution
Lets take $$n_1 = n_2 = 10$$ and $$r_1 = r_2 =100$$ .
Using given formula we have $$BA = 20$$ and $$MBA_1 = MBA_2 = 10$$ .
So we have $$BA$$ highest which is not the case in option A,B and C. Hence the correct option is D.
An experienced cricketer with no incomplete innings has BA of 50. The next time he bats, the innings is incomplete and he scores 45 runs. It can be inferred that
Solution
With no incomplete innings and $$BA$$ of 50 , lets assume $$r_1 = 50$$ and $$n_1 = 1$$.
Now we have $$BA = MBA_2 = 50$$
So we have $$r_2 = 45$$ and $$n_2 = 1$$ .
We have $$BA = 95$$ and $$MBA_2 = \frac{95}{2} < 50$$.
Hence $$MBA_2$$ decreases.
So $$BA$$ will increase and $${MBA}_2$$ will decrease.
Directions for the following two questions: Answer the questions based on the following information.
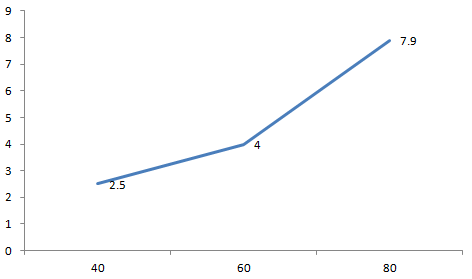
The petrol consumption rate of a new model car ‘Palto’ depends on its speed and may be described by the graph below.
The axis represents the speed and the Y axis represents the Fuel Consumption (Liters per hour)
Manasa makes a 200 km trip from Mumbai to Pune at a steady speed of 60 km/hr. What is the volume of petrol consumed for the journey?
[CAT 2001]
Solution
At 60 kmph, time taken to reach the destination = 200/60 = 3.33 hours.
Fuel consumed per hour at 60 kmph = 4 liters.
Therefore, total fuel consumed = 3.33*4 = 13.33 liters.

Manasa would like to minimize the fuel consumption for the trip by driving at the appropriate speed. How should she change the speed?
[CAT 2001]
Solution
If she drives at 40 kmph, the fuel consumed = 200/40 * 2.5 = 12.5 liters
If she drives at 60 kmph, the fuel consumed = 13.33 liters
If she drives at 80 kmph, the fuel consumed = 200/80 * 7.9 = 19.75 liters
To minimize fuel consumption, Manasa has to decrease the speed.
For the following questions answer them individually
A student took five papers in an examination, where the full marks were the same for each paper. His marks in these papers were in the proportion of 6 : 7 : 8 : 9 : 10. In all papers together, the candidate obtained 60% of the total marks. Then the number of papers in which he got more than 50% marks is
Solution
Let the marks in the five papers be 6k, 7k, 8k, 9k and 10k respectively.
So, the total marks in all the 5 papers put together is 40k. This is equal to 60% of the total maximum marks. So, the total maximum marks is 5/3 * 40k
So, the maximum marks in each paper is 5/3 * 40k / 5 = 40k/3 = 13.33k
50% of the maximum marks is 6.67k
So, the number of papers in which the student scored more than 50% is 4
A square, whose side is 2 m, has its corners cut away so as to form an octagon with all sides equal. Then the length of each side of the octagon, in metres, is
Solution
Let the length of each side of the octagon be x.

So, length of the square will be x+2*(x/√2) = 2
=> x(1+√2) = 2 => x = 2/(1+√2)

Let x, y and z be distinct integers. x and y are odd and positive, and z is even and positive. Which one of the following statements cannot be true?
Solution
Take x=3 , z=2 , y=5.
$$y(x-z)^2 = 5(3-2)^2 = 5$$
Option A gives 5 which is odd.
If x > 5 and y < -1, then which of the following statements is true?
Solution
Substitute x=6 and y=-6 ,
x+4y = -18
x = 6, -4y = 24
-4x = -24, 5y = -30
So none of the options out of a,b or c satisfies .
A red light flashes three times per minute and a green light flashes five times in 2 min at regular intervals. If both lights start flashing at the same time, how many times do they flash together in each hour?
Solution
A red light flashes three times per minute and a green light flashes five times in 2 min at regular intervals. So red light fashes after every 1/3 min and green light flashes every 2/5 min. LCM of both the fractions is 2 min .
Hence they flash together after every 2 min. So in an hour they flash together 30 times .

Of 128 boxes of oranges, each box contains at least 120 and at most 144 oranges. X is the maximum number of boxes containing the same number of oranges. What is the minimum value of X?
Solution
Each box contains at least 120 and at most 144 oranges.
So boxes may contain 25 different numbers of oranges among 120, 121, 122, .... 144.
Lets start counting.
1st 25 boxes contain different numbers of oranges and this is repeated till 5 sets as 25*5=125.
Now we have accounted for 125 boxes. Still 3 boxes are remaining. These 3 boxes can have any number of oranges from 120 to 144.
Already every number is in 5 boxes. Even if these 3 boxes have different number of oranges, some number of oranges will be in 6 boxes.
Hence the number of boxes containing the same number of oranges is at least 6.
A certain city has a circular wall around it, and this wall has four gates pointing north, south, east and west. A house stands outside the city, 3 km north of the north gate, and it can just be seen from a point 9 km east of the south gate. What is the diameter of the wall that surrounds the city?
Solution
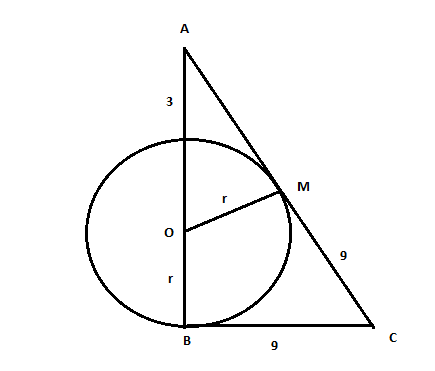
B is the south gate. A is the house and BC = 9 km.
In triangle ABC and triangle AMO
ABC = OMA = 90 degree
BAC = OAM = Common angle
Triangle ABC is similar to triangle AMO.
$$\frac{(2r+3)}{\sqrt{(r+3)^2-r^2}} = \frac{9}{r}$$
r = 9/2
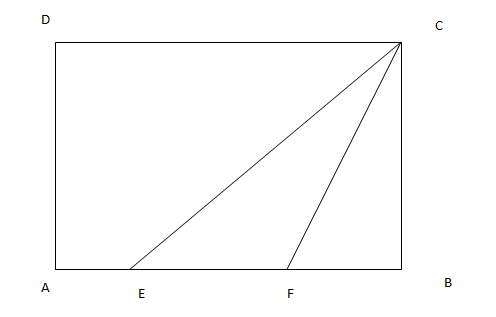
In the given diagram, ABCD is a rectangle with AE = EF = FB. What is the ratio of the areas of CEF and that of the rectangle?
Solution
Let the length of AB be 3X and the length of AD (and BC) be Y.
As the length of AB = 3X, AE = EF = FB =X
So, the area of the rectangle ABCD is length * breadth = 3X * Y = 3XY
The area of triangle CEF = 1/2 * base * height = 1/2 * EF * BC = 1/2*X*Y
So, required ratio = 1/2 : 3 = 1:6

A can complete a piece of work in 4 days. B takes double the time taken by A, C takes double that of B, and D takes double that of C to complete the same task. They are paired in groups of two each. One pair takes two-thirds the time needed by the second pair to complete the work. Which is the first pair?
Solution
A takes 4 days to complete the work.
So, B takes 8 days to complete the same work.
C takes 16 days to complete the work.
D takes 32 days to complete the same work.
In order to measure, let the total work be of 64 units. Hence, the speed of working of each of the four persons is given below.
A - 16 units/hr
B - 8 units/hr
C - 4 units/hr
D - 2 units/hr
From the given options, we need to find two pairs in such a way that their speeds are in the ratio 3:2. Note that A+D=18 while B+C=12 and the ratio is 3:2
Hence, the first pair is A and D and the second pair is B and C
In a four-digit number, the sum of the first 2 digits is equal to that of the last 2 digits. The sum of the first and last digits is equal to the third digit. Finally, the sum of the second and fourth digits is twice the sum of the other 2 digits. What is the third digit of the number?
Solution
Let the 4 digit no. be xyzw.
According to given conditions we have x+y=z+w --- Eq 1 , x+w=z --- Eq 2,y+w=2x+2z --- Eq 3
Eq 2 - Eq 3 : x-y = -2x-z --- Eq 4
Eq 1+ Eq 4 :2x = -2x+w
4x=w --- Eq 5
Substitute w = 4x inEq2
5x = z
Substitute w = 4x inEq3
y+4x=2x+10x
y = 8x
Now the minimum value x can take is 1 so z =5 and the no. is 1854, which satisfies all the conditions.
Hence option A .
Two men X and Y started working for a certain company at similar jobs on January 1, 1950. X asked for an initial monthly salary of Rs. 300 with an annual increment of Rs. 30. Y asked for an initial monthly salary of Rs. 200 with a rise of Rs. 15 every 6 months. Assume that the arrangements remained unaltered till December 31, 1959. Salary is paid on the last day of the month. What is the total amount paid to them as salary during the period?
Solution
January 1, 1950 to December 31, 1959 is a period of 10 years or 20 half years.
The person X after 1st year gets Rs. 300 in next year he gets Rs. 330 and so on.
So his earning is in AP with 10 300+330+360+...
Similarly earning of Y is in AP with 20 terms 200+215+230+245.... .
So, the total earnings of X equals 12*(300+330+....10 terms) = 52200
The total earnings of Y equals 6*(200+215+230+...20 terms) = 41100
So, the total earnings of the two equals 52200+41100 = 93300

Anita had to do a multiplication. In stead of taking 35 as one of the multipliers, she took 53. As a result, the product went up by 540. What is the actual product?
Solution
Let the number be X.
From the given information, 53x - 35x = 540 => 18x = 540 => x = 30
So, new product = 35*30 = 1050
A college has raised 75% of the amount it needs for a new building by receiving an average donation of Rs. 600 from the people already solicited. The people already solicited represent 60% of the people the college will ask for donations. If the college is to raise exactly the amount needed for the new building, what should be the average donation from the remaining people to be solicited?
Solution
Let there be total 100 people whom the college will ask for donation. Out of these 60 people have already given average donation of 600 Rs. Thus total amount generated by 60 people is 36000. This is 75% of total amount required . so the amount remaining is 12000 which should be generated from remaining 40 people. So average amount needed is 12000/40 = 300
x and y are real numbers satisfying the conditions 2 < x < 3 and - 8 < y < -7. Which of the following expressions will have the least value?
Solution
$$xy^2$$ will have it's least value when y=-7 and x=2 and equals 98.
So $$xy^2>98$$
$$x^2y$$ will have it's least value when y=-8 and x=3 and equals -72.
So, $$x^2y > -72$$
$$5xy$$ will have it's least value when y=-8 and x=3 and equals -120
So, $$5xy > -120$$
So, of the three expressions, the least possible value is that of 5xy

$$m$$ is the smallest positive integer such that for any integer $$n \geq m$$, the quantity $$n^3 - 7n^2 + 11n - 5$$ is positive. What is the value of $$m$$?
Solution
$$n^3 - 7n^2 + 11n - 5 = (n-1)(n^2 - 6n +5) = (n-1)(n-1)(n-5)$$
This is positive for n > 5
So, m = 6
A ladder leans against a vertical wall. The top of the ladder is 8 m above the ground. When the bottom of the ladder is moved 2 m farther away from the wall, the top of the ladder rests against the foot of the wall. What is the length of the ladder?
Solution
When the ladder is moved 2 m away from the wall, the top of the ladder rests against the foot of the wall. So, the hypotenuse is 2 m more than the second side of the right triangle. The other non-hypotenuse side is 8 m. So, $$8^2 + x^2 = (x+2)^2$$
=> x = 15 m and length of the ladder = x+2 = 17 m
Three friends, returning from a movie, stopped to eat at a restaurant. After dinner, they paid their bill and noticed a bowl of mints at the front counter. Sita took one-third of the mints, but returned four because she had a momentary pang of guilt. Fatima then took one-fourth of what was left but returned three for similar reason. Eswari then took half of the remainder but threw two back into the bowl. The bowl had only 17 mints left when the raid was over. How many mints were originally in the bowl?
Solution
Let the total number of mints in the bowl be n
Sita took n/3 - 4. Remaining = 2n/3 + 4
Fatim took 1/4(2n/3 + 4) - 3. Remaining = 3/4(2n/3 + 4) + 3
Eswari took 1/2(3/4(2n/3+4)+3) - 2
Remaining = 1/2(3/4(2n/3+4)+3) + 2 = 17
=> 3/4(2n/3+4)+3 = 30 => (2n/3+4) = 36 => n = 48
So, the answer is option d)

If 09/12/2001(DD/MM/YYYY) happens to be Sunday, then 09/12/1971 would have been a
Solution
30 years. The number of leap years is 8 (1972,1976,1980,1984,1988,1992,1996,2000).
So, the total number of days = 22*365 + 8*366 = 10958
10958 mod 7 = 3
Since 9/12/2001 is a Sunday, 9/12/1971 should be a Thursday.
In a number system the product of 44$$_{10}$$ and 11$$_{10}$$ is 3414. The number 3111 of this system, when converted to the decimal number system, becomes
Solution
The product of 44 and 11 in decimal is 484.
If base is x , then 3*x^3+4*x^2+x+4 = 484 .
Hence, the given base system is of number 5.
Now, we have to convert 3111 (in base 5) to decimal number system.
3111 in base 5 equals $$1*5^0 + 1*5^1 + 1*5^2 + 3*5^3 = 1+5+25+375=406$$
At his usual rowing rate, Rahul can travel 12 miles downstream in a certain river in 6 hr less than it takes him to travel the same distance upstream. But if he could double his usual rowing rate for this 24 miles round trip, the downstream 12 miles would then take only 1 hr less than the upstream 12 miles. What is the speed of the current in miles per hour?
Solution
$$12/(R - S) = T$$
$$12/(R + S) = T - 6$$
$$12/(2R - S) = t$$
$$12/(2R + S) = t - 1$$
=> $$12/(R - S) - 12/(R + S) = 6$$ and $$12/(2R - S) - 12/(2R + S) = 1$$
=> $$12R + 12S - 12R + 12S = 6R^2 - 6S^2$$ and $$24R + 12S - 24R + 12S = 4R^2 - S^2$$
=> $$24S = 6R^2 - 6S^2 and 24S = 4R^2 - S^2$$
=> $$6R^2 - 6S^2 = 4R^2 - S^2$$
=> $$2R^2 = 5S^2$$
=> $$24S = 10S^2 - S^2 = 9S^2$$
=> $$S = 24/9 = 8/3$$

Every 10 years the Indian Government counts all the people living in the country. Suppose that the director of the census has reported the following data on two neighbouring villages Chota Hazri and Mota Hazri.
Chota Hazri has 4,522 fewer males than Mota Hazri.
Mota Hazri has 4,020 more females than males.
Chota Hazri has twice as many females as males.
Chota Hazri has 2,910 fewer females than Mota Hazri.
What is the total number of males in Chota Hazri?
Solution
Let the number of males in Mota Hazri = x
No. of males in Chota Hazri = x - 4522
Let the number of females in Mota Hazri = y
No. of females in Chota Hazri = y - 2910
(y - 2910) = 2(x - 4522) => y = 2x - 9044 + 2910 = 2x - 6134
Also y = x + 4020
So, x + 4020 = 2x - 6134 => x = 10154
So, number of males in Chota Hazri = 10154 - 4522 = 5632
Three classes X, Y and Z take an algebra test.
The average score in class X is 83.
The average score in class Y is 76.
The average score in class Z is 85.
The average score of all students in classes X and Y together is 79.
The average score of all students in classes Y and Z together is 81.
What is the average for all the three classes?
Solution
Let x , y and z be no. of students in class X, Y ,Z respectively.
From 1st condition we have
83*x+76*y = 79*x+79*y which give 4x = 3y.
Next we have 76*y + 85*z = 81(y+z) which give 4z = 5y .
Now overall average of all the classes can be given as $$\frac{83x+76y+85z}{x+y+z}$$
Substitute the relations in above equation we get,
$$\frac{83x+76y+85z}{x+y+z}$$ = (83*3/4 + 76 + 85*5/4)/(3/4 + 1 + 5/4) = 978/12 = 81.5
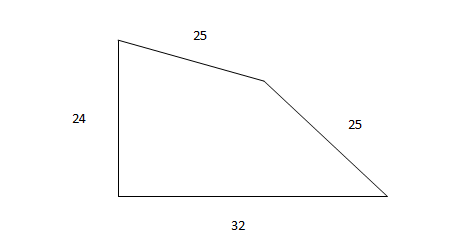
Two sides of a plot measure 32 m and 24 m and the angle between them is a perfect right angle. The other two sides measure 25 m each and the other three angles are not right angles. What is the area of the plot?
Solution
Length of the diagonal of the right triangle is 40.
The height of the isosceles triangle formed, with 40 as its base is 15.
So, area = (1/2 * 32 * 24) + (1/2 * 40 * 15) = 384 + 300 = 684 $$m^2$$

All the page numbers from a book are added, beginning at page 1. However, one page number was added twice by mistake. The sum obtained was 1000. Which page number was added twice?
Solution
If the number of pages is 44, the sum will be 44*45/2 = 22*45 = 990
So, the number 10 was added twice
Shyama and Vyom walk up an escalator (moving stairway). The escalator moves at a constant speed. Shyama takes three steps for every two of Vyom’s steps. Shyama gets to the top of the escalator after having taken 25 steps, while Vyom (because his slower pace lets the escalator do a little more of the work) takes only 20 steps to reach the top. If the escalator were turned off, how many steps would they have to take to walk up?
Solution
Let the number of steps on the escalator be x.
So, by the time Shyama covered 25 steps, the escalator moved 'x-25' steps.
Hence, the ratio of speeds of Shyama and escalator = 25:(x-25)
Similarly, the ratio of speeds of Vyom and escalator = 20:(x-20)
But the ratio is 3:2
Ratio of speeds of Shyama and Vyom = 25(x-20)/20*(x-25) = 3/2
=> 10(x-20) = 12(x-25)
=> 2x = 100 => x = 50
At a certain fast food restaurant, Brian can buy 3 burgers, 7 shakes, and one order of fries for Rs. 120 exactly. At the same place it would cost Rs. 164.5 for 4 burgers, 10 shakes, and one order of fries. How much would it cost for an ordinary meal of one burger, one shake, and one order of fries?
Solution
Let the price of 1 burger be x and the price of 1 shake be y and the prize of 1 french fries be z
3x + 7y + z = 120
4x + 10y + z = 164.5
=> x + 3y = 44.5
=> x = 44.5 - 3y
=> 3(44.5 - 3y) + 7y + z = 120 => z = 120 - 133.5 + 2y
So, x+y+z = 44.5 - 3y + y -13.5 + 2y = 31
So, the cost of a meal consisting of 1 burger, 1 shake and 1 french fries = Rs 31

If a, b, c and d are four positive real numbers such that abcd = 1, what is the minimum value of (1 + a)(1+b)(1+c)(1+d)?
Solution
Since the product is constant,
(a+b+c+d)/4 >= $$(abcd)^{1/4}$$
We know that abcd = 1.
Therefore, a+b+c+d >= 4
$$(a+1)(b+1)(c+1)(d+1)$$
= $$1+a+b+c+d+ ab + ac + ad + bc + bd + cd+ abc+ bcd+ cda+ dab+abcd$$
We know that $$abcd = 1$$
Therefore, $$a = 1/bcd, b = 1/acd, c = 1/bda$$ and $$d = 1/abc$$
Also, $$cd = 1/ab, bd = 1/ac, bc = 1/ad$$
The expression can be clubbed together as $$1 + abcd + (a + 1/a) + (b+1/b) + (c+1/c) + (d+1/d) + (ab + 1/ab) + (ac+ 1/ac) + (ad + 1/ad)$$
For any positive real number $$x$$, $$x + 1/x \geq 2$$
Therefore, the least value that $$(a+1/a), (b+1/b)....(ad+1/ad)$$ can take is 2.
$$(a+1)(b+1)(c+1)(d+1) \geq 1 + 1 + 2 + 2 + 2+ 2 + 2 + 2 + 2$$
=> $$(a+1)(b+1)(c+1)(d+1) \geq 16$$
The least value that the given expression can take is 16. Therefore, option C is the right answer.
There’s a lot of work in preparing a birthday dinner. Even after the turkey is in the oven, there’s still the potatoes and gravy, yams, salad, and cranberries, not to mention setting the table.
Three friends — Asit, Arnold and Afzal — work together to get all of these chores done. The time it takes them to do the work together is 6 hr less than Asit would have taken working alone, 1 hr less than Arnold would have taken alone, and half the time Afzal would have taken working alone. How long did it take them to do these chores working together?
Solution
Let the time taken working together be t.
Time taken by Arnold = t+1
Time taken by Asit = t+6
Time taken by Afzal = 2t
Work done by each person in one day = $$\frac{1}{(t+1)}+\frac{1}{(t+6)}+\frac{1}{2t}$$
Total portion of workdone in one day $$=\frac{1}{t}$$
$$\frac{1}{(t+1)}+\frac{1}{(t+6)}+\frac{1}{2t}=\frac{1}{t}$$
$$\frac{1}{(t+1)}+\frac{1}{(t+6)}=\frac{2-1}{2t}$$
$$2t+7=\frac{(t+1)\cdot(t+6)}{2t}$$
$$3t^2-7t+6=0 \longrightarrow\ t=\frac{2}{3} $$or $$t=-3$$
Therefore total time = $$\frac{2}{3}$$hours = 40mins
Alternatively,
$$\frac{1}{(t+1)}+\frac{1}{(t+6)}+\frac{1}{2t}=\frac{1}{t}$$
From the options, if time $$= 40$$ min, that is, $$t = \frac{2}{3}$$
LHS = $$\frac{3}{5} + \frac{3}{20} + \frac{3}{4} = \frac{(12+3+15)}{20} = \frac{30}{20} = \frac{3}{2}$$
RHS = $$\frac{1}{t}=\frac{3}{2}$$
The equation is satisfied only in case of option C
Hence, C is correct
Euclid has a triangle in mind. Its longest side has length 20 and another of its sides has length 10. Its area is 80. What is the exact length of its third side?
Solution
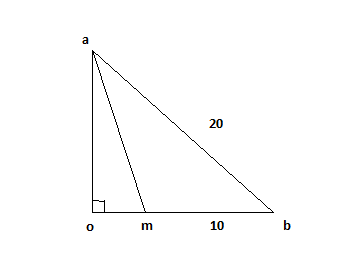
We know that area = 0.5*h*10 ; we get h = 16=oa.
Using pythagoras we find
$$ob^2+oa^2 = ab^2$$
$$ob^2+16^2 = 20^2$$
ob = 12
Using pythagoras in triangle oam we get
am = $$\sqrt {2^2 + 16^2 } $$ = $$\sqrt {260}$$.

For a Fibonacci sequence, from the third term onwards, each term in the sequence is the sum of the previous two terms in that sequence. If the difference in squares of 7th and 6th terms of this sequence is 517, what is the 10th term of this sequence?
It is known that all the terms of the Fibonacci sequence are natural numbers
Solution
It is given that in a Fibonacci sequence, from the third term on wards, each term in the sequence is the sum of the previous two terms in that sequence.
Let x and y be the 1st and 2nd term respectively.
3rd term = x+y
4th term = x+2y
5th term = 2x+3y
6th term = 3x+5y
7th term = 5x+8y
We know that difference of the squares of 6th and 7th terms is 517 = 47*11 .
And $$a^2-b^2=(a+b)(a-b)$$.
Applying above formula we get (8x+13y)(2x+3y) = 47*11.
So only possible way is (8x+13y)=47 and
2x+3y=11 .
Solving we get x=1 and y=3 .
Using the concept that every term is the sum of the previous two terms, as used in the beginning of the solution, we get 10th term as 21x+34y, which gives 10th term as 123.
Fresh grapes contain 90% water by weight while dried grapes contain 20% water by weight and the remaining proportion being pulp. What is the weight of dry grapes available from 20 kg of fresh grapes?
Solution
Fresh grapes contain 90% water so water in 20kg of fresh pulp = (90/100)x20= 18kg.
In 20kg fresh grapes, the weight of water is 18kg and the weight of pulp is 2kg.
The concept that we apply in this question is that the weight of pulp will remain the same in both dry and fresh grapes. If this grape is dried, the water content will change but pulp content will remain the same.
Suppose the weight of the dry grapes be D.
80% of the weight of dry grapes = weight of the pulp = 2 kg
(80/100) x D =2 kg.
D = 2.5 kg
Train X departs from station A at 11 a.m. for station B, which is 180 km so far. Train Y departs from station B at 11 a.m. for station A. Train X travels at an average speed of 70 km/hr and does not stop anywhere until it arrives at station B. Train Y travels at an average speed of 50 km/hr, but has to stop for 15 min at station C, which is 60 km away from station B enroute to station A. Ignoring the lengths of the trains, what is the distance, to the nearest kilometre, from station A to the point where the trains cross each other?
Solution
Distance between A-B , A-C, C-B is 180, 120 and 60 km respectively.
Let x be the distance from A where the 2 trains meet.
According to given condition we have
$$\frac{x}{70}=\frac{60}{50} + \frac{1}{4} + \frac{120-x}{50}$$.
Solving the equation we get x around 112 km.

A set of consecutive positive integers beginning with 1 is written on the blackboard. A student came along and erased one number. The average of the remaining numbers is $$\frac{602}{17}$$. What was the number erased?
Solution
Since the number starts from 1 if there are n numbers then initial average = $$\dfrac{n+1}{2}$$.
Average of N natural number can be either an integer {ab} or {ab.50} type. For example average of first 10 number = 5.5 whereas the average of first 11 natural numbers is 6.
Even if we erased the largest number change in average will be always less than 0.5.
Here we are given the average is 602/17 or 35$$\frac{7}{17}$$ Hence we can say that average must have been 35.5 or 35 before.
Case 1: If the average was 35.5 before the erasing process.
We know that average of 1st N natural number = $$\dfrac{N+1}{2}$$
35.5 = $$\dfrac{N+1}{2}$$
N = 70.
Sum of these 70 numbers = 70*71/2 = 35*71 = 2485.
Sum of the 69 numbers which we are left with after removing a number = (602/17)*69 = 2443.41. Which is not possible as the sum of natural numbers will always be an integer. Hence, we can say that case is not possible.
Case 1: If the average was 35 before the erasing process.
We know that average of 1st N natural number = $$\dfrac{N+1}{2}$$
35 = $$\dfrac{N+1}{2}$$
N = 69.
Sum of these 69 numbers = 69*70/2 = 35*69 = 2415.
Sum of the 68 numbers which we are left with after removing a number = (602/17)*68 = 2408.
Hence, we can say that the erased number = 2415 - 2408 = 7.
In triangle DEF shown below, points A, B and C are taken on DE, DF and EF respectively such that EC = AC and CF = BC. If angle D equals 40 degress , then angle ACB is ?
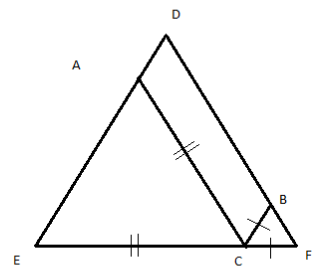
Solution
Let angle EAC = x, so angle AEC = x and angle ACE = 180-2x
Let angle FBC = y, so angle BFC = y and angle BCF = 180-2y
So, angle ACB = 180-(180-2x+180-2y) = 2(x+y) - 180
x+y = 180 - 40 = 140
So, angle ACB = 280 - 180 = 100
The owner of an art shop conducts his business in the following manner: every once in a while he raises his prices by X%, then a while later he reduces all the new prices by X%. After one such updown cycle, the price of a painting decreased by Rs. 441. After a second up-down cycle the painting was sold for Rs. 1,944.81. What was the original price of the painting?
Solution
Let the price of the painting be P
One cycle of price increase and decrease reduces the price by $$x^2/100 * P = 441$$
Let the new price be N => $$P - x^2/100 * P = N$$
Price after the second cycle = $$N - x^2/100 * N$$ = 1944.81
=> $$(P - x^2/100 * P)(1 - x^2/100) = 1944.81$$
=> $$(P - 441)(1 - 441/P) = 1944.81$$
=> $$P - 441 - 441 + 441^2/P = 1944.81$$
=> $$P^2 - (882 + 1944.81)P + 441^2 = 0$$
=> $$P^2 - 2826.81P + 441^2 = 0$$
From the options, the value 2756.25 satisfies the equation.
So, the price of the article is Rs 2756.25

Three runners A, B and C run a race, with runner A finishing 12 m ahead of runner B and 18 m ahead of runner C, while runner B finishes 8 m ahead of runner C. Each runner travels the entire distance at a constant speed. What was the length of the race?
Solution
Let x be the required distance.
Let a,b,c be speed of the A,B and C respectively.
From the given conditions we have,
$$\frac{a}{b}=\frac{x}{x-12}$$ and $$\frac{a}{c}=\frac{x}{x-18}$$ and $$\frac{b}{c}=\frac{x}{x-8}$$ . From first 2 equations we can deduce $$\frac{b}{c}=\frac{x-12}{x-18}$$.
$$\frac{b}{c}=\frac{x-12}{x-18} = \frac{x}{x-8}$$
x = 48 satisfy the equation.
Let x and y be two positive numbers such that $$x + y = 1.$$
Then the minimum value of $$(x+\frac{1}{x})^2+(y+\frac{1}{y})^2$$ is
Solution
Approach 1:
The given expression is symmetric in x and y and the limiting condition (x+y=1) is also symmetric in x and y.
=>This means that the expression attains the minimum value when x = y
x=y=1/2
So, the value = $$(x+\frac{1}{x})^2+(y+\frac{1}{y})^2$$ = $$(2+\frac{1}{2})^2+(2+\frac{1}{2})^2$$ =12.5
Approach 2:
$$(x+1/x)^2$$ + $$(y+1/y)^2$$ = $$(x+1/x+y+1/y)^2$$ - $$2*(x+1/x)(y+1/y)$$
Let x+1/x and y+1/y be two terms. Thus (x+1/x+y+1/y)/2 would be their Arithmetic Mean(AM) and $$\sqrt{(x+1/x)(y+1/y)}$$ would be their Geometric Mean (GM).
Therefore, we can express the above equation as $$(x+1/x)^2$$ + $$(y+1/y)^2$$ = $$4AM^2$$ - $$GM^2$$. As AM >= GM, the minimum value of expression would be attained when AM = GM.
When AM = GM, both terms are equal. That is x+1/x = y +1/y.
Substituting y=1-x we get
x+1/x = (1-x) + 1/(1-x)
On solving we get 2x-1 = (2x-1)/ x(1-x)
So either 2x-1 = 0 or x(1-x) = 1
x(1-x) = x * y
As x and y are positive numbers whose sum = 1, 0<= x, y <=1. Hence, their product cannot be 1.
Thus, 2x-1 = 0 or x=1/2
=> y = 1/2
So, the value = $$(x+\frac{1}{x})^2+(y+\frac{1}{y})^2$$ = $$(2+\frac{1}{2})^2+(2+\frac{1}{2})^2$$ = 12.5
Based on the figure below, what is the value of x, if y = 10?
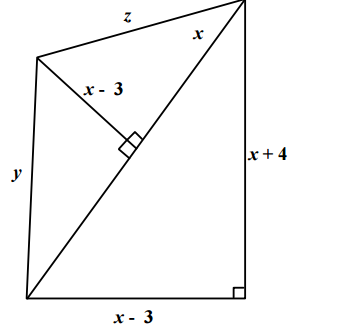
Solution
We will solve this question by taking the options.
Suppose x = 11
x+4 = 15, x-3 = 8
Hyptenuse = $$\sqrt{225+64} = 17$$
17-11 = 6
$$6^2+(x-3)^2 = y^2$$
x-3 = 8
y = 10 which is similar to what is given in the question.
Hence x = 11

A rectangular pool of 20 m wide and 60 m long is surrounded by a walkway of uniform width. If the total area of the walkway is 516 $$m^2$$ , how wide, in metres, is the walkway?
Solution
If the width of the walkway is x, then its area = (60+2x)(20+2x) - 1200 = 516
Solving this, we get x = 3m
Let $$b$$ be a positive integer and $$a = b^2 - b$$. If $$b \geq 4$$ , then $$a^2 - 2a$$ is divisible by
Solution
We know that a=$$b^2-b$$.
So$$a^2-a$$ = b($$b^3-2b^2-b+2$$) . = (b - 2)(b - 1)( b)(b + 1)
The above given is a product of 4 consecutive numbers with the lowest number of the product being 2(given b >= 4)
In any set of four consecutive numbers, one of the numbers would be divisible by 3 and there would be two even numbers with the minimum value of the pair being (2,4).
Thus, for any value of b >=4, $$a^2-4$$ would be divisible by 3 x 2 x 4 = 24.
Thus, option C is the right choice. Options A and B are definitely wrong as a set of four consecutive numbers need not always include a multiple of 5 eg:(6,7,8,9)
Ashish is given Rs. 158 in one-rupee denominations. He has been asked to allocate them into a number of bags such that any amount required between Re 1 and Rs. 158 can be given by handing out a certain number of bags without opening them. What is the minimum number of bags required?
Solution
The possible arrangements are 1,multiples of 2 ,remaining. So we have 1+2+4+8+16+32+64+31 = 158. Hence minimum no. of bags required is 8.
In some code, letters a, b, c, d and e represent numbers 2, 4, 5, 6 and 10. We just do not know which letter represents which number. Consider the following relationships:
I. a + c = e,
II. b - d = d and
III. e + a = b
Which of the following statements is true?
Solution
We have a +c=e so possible summation 6+4=10 or 4+2 = 6.
Also b=2d so possible values 4=2*2 or 10=5*2.
So considering both we have b=10 , d=5, a=4 ,c=2, e=6.
Hence the correct option is B .
Ujakar and Keshab attempted to solve a quadratic equation. Ujakar made a mistake in writing down the constant term. He ended up with the roots (4, 3). Keshab made a mistake in writing down the coefficient of x. He got the roots as (3, 2). What will be the exact roots of the original quadratic equation?
Solution
We know that quadratic equation can be written as $$x^2$$-(sum of roots)*x+(product of the roots)=0.
Ujakar ended up with the roots (4, 3) so the equation is $$x^2$$-(7)*x+(12)=0 where the constant term is wrong.
Keshab got the roots as (3, 2) so the equation is $$x^2$$-(5)*x+(6)=0 where the coefficient of x is wrong .
So the correct equation is $$x^2$$-(7)*x+(6)=0. The roots of above equations are (6,1).
A change-making machine contains one-rupee, two-rupee and five-rupee coins. The total number of coins is 300. The amount is Rs. 960. If the numbers of one-rupee coins and two-rupee coins are interchanged, the value comes down by Rs. 40. The total number of five-rupee coins is
Solution
Let the number of coins of the three denominations be x, y and z respectively.
x+y+z = 300
x+2y+5z = 960
2x+y+5z = 920
=> 3(x+y) + 10z = 1880
=> 3(300 - z) + 10z = 1880
=> 900 + 7z = 1880 => z = 980/7 = 140
So, the number of 5 rupee coins is 140
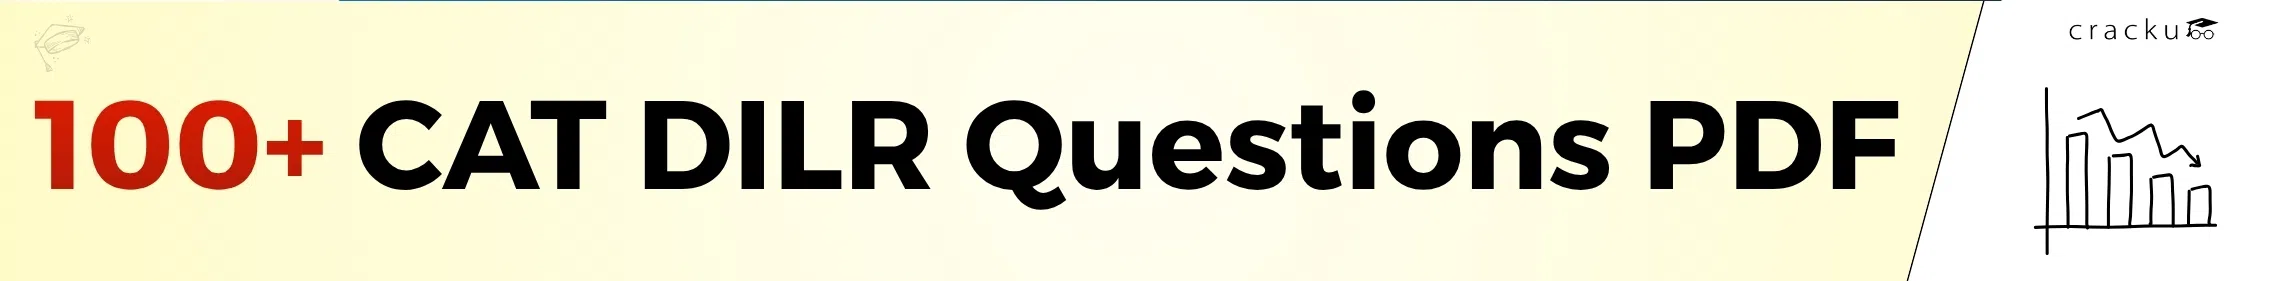
The figure below shows the network connecting cities A, B, C, D, E and F. The arrows indicate permissible direction of travel. What is the number of distinct paths from A to F?
Solution
The distinct paths are:
A -> D -> C -> F
A -> D -> E -> F
A -> D -> C -> E -> F
A -> B -> D -> C -> F
A -> B -> D -> E -> F
A -> B -> D -> C -> E -> F
A -> B -> C -> F
A -> B -> E -> F
A -> B -> F
A -> B -> C -> E -> F
So, the total number of distinct paths is 10
Let n be the number of different five-digit numbers, divisible by 4 with the digits 1, 2, 3, 4, 5 and 6, no digit being repeated in the numbers. What is the value of n?
Solution
To be divisible by 4 , last 2 digits of the 5 digit no. should be divisible by 4 . So possibilities are 12,16,32,64,24,36,52,56 which are 8 in number. Remaining 3 digits out of 4 can be selected in $$^4C_3 $$ ways and further can be arranged in 3! ways . So in total = 8*4*6 = 192
Directions for the following four questions: Answer the questions based on the table given below.
The following table describes garments manufactured based upon the color and size for each lay. There are four sizes: M – medium, L – large, XL – extra large and XXL – extra extra large. There are three colors: yellow, red and white.

How many lays are used to produce yellow fabrics?
Solution
Manually counting non-zero value number of fabrics in yellow fabric category. We get 14. Hence option D.
1, 3, 4, 6, 7, 8, 9, 11, 12, 15, 21, 24, 25, 27

How many lays are used to produce XL fabrics?
Solution
Manually counting lays for which number of lays produced is non-zero . We get 15 lays. Hence option A.
How many lays are used to produce XL yellow or XL white fabrics?
Solution
Manually counting lays which are are used to produce XL yellow or XL white fabrics. We get 15 number of such lays.
How many varieties of fabrics, which exceed the order, have been produced?
Solution
Counting the number of variety of fabrics which have positive non-zero surplus, we get 4 such varieties. Hence option B.

Directions for the following four questions: Answer the questions based on the table given below concerning the busiest 20 international airports in the world.

How many international airports of type ‘A’ account for more than 40 million passengers?
Solution
1 Million = 10 lakhs. Using the conversion and manually counting the international airports of type ‘A’ accounting for more than 40 million passengers, we get 5 such airports. Hence option B .
What percentage of top ten busiest airports is in the United States of America?
Solution
There are 6 airports from USA which are in top 10 busiest aiports. Hence 600/10 = 60%. Hence option A.
Of the five busiest airports, roughly, what percentage of passengers in handled by Heathrow Airport?
Solution
Total passengers handled in top 5 airports are 336648008 . So percentage of passengers handled by heathrow airport is (62263710*100)/(336648008) which is approximately equal to 20%.

How many international airports not located in the USA handle more than 30 million passengers?
Solution
All the top 20 busiest airports handle more than 30 million passengers. So, we have to just count the airports which are not located in the USA, out of these 20 airports. The airports ranked 4, 6, 7, 8, 11, 18 are located outside the USA. Thus, there are 6 such airports.
Hence, option B is the correct answer.
Directions for the following five questions: Answer the questions based on the two graphs shown below.
Figure I (the chart on the left) shows the amount of work distribution, in man-hours, for a software company between offshore and onsite activities.
Figure 2 (the chart on the right) shows the estimated and actual work effort involved in the different offshore activities in the same company during the same period.
[Note: Onsite refers to work performed at the customer’s premise and offshore refers to work performed at the developer’s premise.]

Which work requires as many man-hours as that spent in coding?
Solution
The number of man-hours spent in coding = 425(offshore) + 100(onsite) = 525
The number of man-hours spent in offshore design and offshore coding together = 100+425 = 525
So, option a) is the correct answer
Roughly, what percentage of the total work is carried out onsite?
Solution
Total number of man-hours needed for the entire work to be done = 100+75+425+100+300+150 = 1150
Man-hours spent onsite = 75+100+150 = 325
So, required percentage = 325/1150 * 100% = 13/46 * 100% = 28.26% = 30% approx

The total effort in man-hours spent onsite is nearest to which of the following?
Solution
Total number of man-hours spent onsite = 75+100+150 = 325
The sum of the estimated and actual effort for offshore design = 200 (approx)
The estimated man-hours of offshore coding = 425
The actual man-hours of offshore testing = 300 (approx)
Half of the man-hours of estimated offshore coding = 210(approx)
So, option c) is the closest
If the total working hours were 100, which of the following tasks will account for approximately 50 hr?
Solution
Total working hours = 1150
So, we have to find the task where the number of working hours is approximately 575
Coding = 425 + 100 = 525
Design = 100 + 75 = 175
Offshore testing = 300
Offshore testing + design = 300 + 100 = 400
So, option a) is the correct answer
If 50% of the offshore work were to be carried out onsite, with the distribution of effort between the tasks remaining the same, the proportion of testing carried out offshore would be
Solution
Total number of hours needed for testing = 300+150 = 450
New number of hours spend offshore for testing = 300/2 = 150
So, required percentage = 150/450 * 100% = 33.33%
From the options, the closest answer is option b)
If 50% of the offshore work were to be carried out onsite, with the distribution of effort between the tasks remaining the same, which of the following is true of all work carried out onsite?
Solution
Total offshore work = 100+420+300 = 820. If 50% of the offshore work were to be carried out onsite i.e 410 carried out onsite.
So new work carried out onsite is in design is [80 + (100*410)/(825)] which is around 130. Also new work carried out onsite is in coding is [100 + (425*410)(825)] which is around 315.
And new work carried out onsite is in testing is [150+(300*410)(825)] which is around 300. Hence the amount of coding done is greater than that of testing.
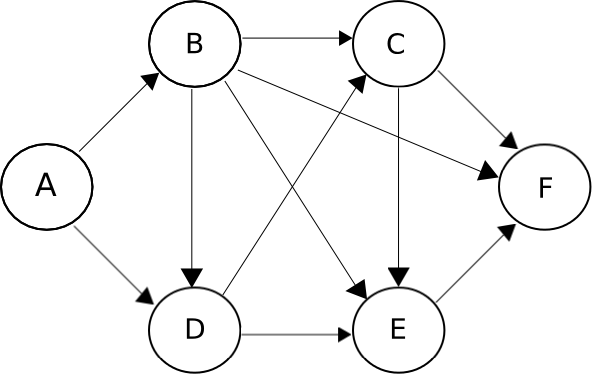
Directions for the following three questions: Answer the questions based on the pipeline diagram below.
The following sketch shows the pipelines carrying material from one location to another. Each location has a demand for material. The demand at Vaishali is 400, at Jyotishmati is 400, at Panchal is 700, and at Vidisha is 200. Each arrow indicates the direction of material flow through the pipeline. The flow from Vaishali to Jyotishmati is 300. The quantity of material flow is such that the demands at all these locations are exactly met. The capacity of each pipeline is 1,000.
The quantity moved from Avanti to Vidisha is
Solution
We know that quantity between Vaishali and jyotishmati is 300,
So quantity in avanti-vaishal route should be 700.
Now at jyotishmati the required quantity is 400+700 = 1100.
But through vaishali only 300 comes , so 800 should come through Vidisha-jyotishmati route.
Now demand at vidisha is 200. So total quantity required in avanti - vidisha route is 800+200=1000. Hence option D.
The free capacity available at the Avanti-Vaishali pipeline is
Solution
We know that quantity between Vaishali and jyotishmati is 300,
So quantity in avanti-vaishal route should be 400+300=700.
So free capacity is 1000-700=300. Hence option D .
What is the free capacity available in the Avanti-Vidisha pipeline?
Solution
We know that quantity between Vaishali and jyotishmati is 300, So quantity in avanti-vaishal route should be 700. Now at jyotishmati the required quantity is 400+700 = 1100.
But through vaishali only 300 comes , so 800 should come through Vidisha-jyotishmati route.
Now demand at vidisha is 200. So total quantity required in avanti - vidisha route is 800+200=1000.
Hence, free capacity available = 1000-1000=0. Hence option D.
Directions for the following three questions: Answer these questions based on the data given below:
There are six companies, 1 through 6. All of these companies use six operations, A through F. The
following graph shows the distribution of efforts put in by each company in these six operations.
The Y axis represents the % distribution of effort and the X axis represents the company

Suppose effort allocation is inter-changed between operations B and C, then C and D, and then D and E. If companies are then ranked in ascending order of effort in E, what will be the rank of company 3?
Solution
If suppose effort allocation is inter-changed between operations B and C, then C and D, and then D and E then operation E will have value of B . So arranging effort in E in ascending order we have company 4 ,company 5 , company 3, ... Hence company 3 is ranked third. Hence option B.
A new technology is introduced in company 4 such that the total effort for operations B through F get evenly distributed among these. What is the change in the percentage of effort in operation E?
Solution
Now from B through F total work done is 81.7%. Dividing it in 5 we get 16.34. So difference in operation E is 28.6-16.34 = 12.3 %. Hence there is a reduction of 12.3 .
Suppose the companies find that they can remove operations B, C and D and redistribute the effort released equally among the remaining operations. Then which operation will show the maximum share across all companies and all operations?
Solution
Operations B, C and D have more effort weightage in companies 1,3,5,6.
Also we notice that among them operation E has highest already, and for E company 5 has already the highest percentage. So redistributing the share of E would increase further more. Hence option D.
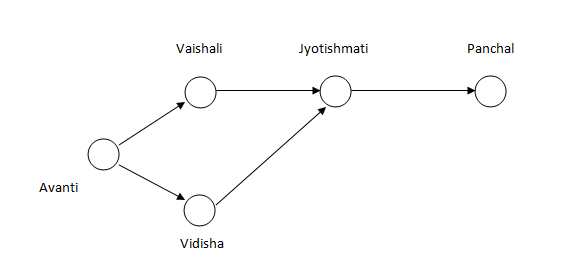
Directions for the following three questions: Answer the questions based on the pie charts given below.
Chart 1 shows the distribution of 12 million tonnes of crude oil transported through different modes over a specific period of time.
Chart 2 shows the distribution of the cost of transporting this crude oil. The total cost was Rs. 30 million.
The cost in rupees per tonne of oil moved by rail and road happens to be roughly
Solution
Total tonnes of transportation by both rail and road is about 31*12/100 = 3.72 million tonnes and total cost incured 18*30/100 = 5.4 .
Hence required value is 5.4/3.72 which is about 1.5.
Hence option B .
From the charts given, it appears that the cheapest mode of transport is
Solution
Cheapest mode of transport will be the one which will have highest transport volume and comparatively lowest cost. We can figure out from the graph that Road have wide gap with very less costs.
For Road, Cost = 6/22
For Rail, Cost = 12/9
For Pipeline, = 65/49
For Ship, Cost = 10/9
Lowest cost is for road.
If the costs per tonne of transport by ship, air and road are represented by P, Q and R respectively, which of the following is true?
Solution
If the costs per tonne of transport by ship, air and road are represented by P, Q and R respectively.
P = 10/9
Q = 7/11
R = 6/22
We can see that P>Q and Q>R and P>R. Hence option C.
Directions for the following two questions: Answer the following questions based on the information given below.
Elle is three times older than Yogesh. Zaheer is half the age of Wahida. Yogesh is older than Zaheer.
Which of the following can be inferred?
Solution
E = 3Y
Z = W/2
Y > Z
So, Y > W/2 => 2Y > W => 2E/3 > W => E > 3W/2 => E > W
So, Elle is older than W
Which of the following information will be sufficient to estimate Elle’s age?
Solution
E = 3Y
Z = W/2
Y > Z
Using statement A alone, Z and W can be determined but not E
Using statement B, Y = W. So, using this statement alone, we can get a relation between all the four ages but cannot determine the absolute values.
Using both the statements, we can determine the value of E.
10 = W/2
W = 20 = Y
E = 3*20 = 60
So, c) is the correct answer.
Directions for the following three questions: Answer the questions based on the passage below.
A group of three or four has to be selected from seven persons. Among the seven are two women: Fiza and Kavita, and five men: Ram, Shyam, David, Peter and Rahim. Ram would not like to be in the group If Shyam is also selected. Shyam and Rahim want to be selected together in the group. Kavita would like to be in the group only if David is also there. David, if selected, would not like Peter in the group. Ram would like to be in the group only if Peter is also there. David insists that Fiza be selected in case he is there in the group.
Which of the following is a feasible group of three?
Solution
Shyam and Rahim have to be selected together. This rules out options a) and c). Ram will be in the group only if Peter is also there. This rules out option d). Option b) is a feasible group
Which of the following is a feasible group in four?
Solution
David and Peter cannot be selected together. So, option d) is not possible.
David and Fiza have to be selected together. So, option b) is ruled out.
Shyam and Rahim have to be selected together. So, option a) is also ruled out.
Option c) is the correct answer
Which of the following statements is true?
Solution
If Ram is selected, Peter also has to be selected. If Kavita is selected, David also has to be selected. But, Peter and David cannot be selected together. So, option a) is false.
If both the women are selected, David has to be selected. If David is selected, Peter cannot be selected. So, Ram also cannot be selected. Shyam and Rahim have to be selected together but there is room for only one more person. So, option b) cannot be true.
If David is selected in the group, Fiza has to be there. So, David cannot be in a group of all men. But, Ram and Shyam cannot be selected together. So, a group of all men is not possible. So option c is false.
For the following questions answer them individually
What are the values of m and n?
I. n is an even integer, m is an odd integer, and m is greater than n.
II. Product of m and n is 30.
Solution
Using either statement alone, we cannot answer the question.
The factors of 30 are 1, 2, 3, 5, 6, 10, 15 and 30. From the information given in both statements, the value of m is 15, and n is 2. So, option c).
This is a previous year's CAT question. We can also consider the negative values, which gives us other possibilities. So, a single answer can't be obtained.
Is Country X’s GDP higher than country Y’s GDP?
I. GDPs of the countries X and Y have grown over the past 5 years at compounded annual rate of 5% and 6% respectively.
II. Five years ago, GDP of country X was higher than that of country Y.
Solution
Even by using both the statements, we do not know whether country X has a higher GDP than country Y because we do not know the absolute values of the GDPs 5 years back. So, the question cannot be answered.
What is the value of X?
I. X and Y are unequal positive even integers, less than 10, and $$\frac{X}{Y}$$ is an odd integer.
II. X and Y are positive even integers, each less than 10, and product of X and Y is 12.
Solution
If we take the first statement alone,
X and Y can be among 2, 4, 6, and 8.
It is given that X/Y is an odd integer. So, X must be greater than Y.
If we take different pairs of (X,Y) among (8, 2), (8, 4), (8, 6), (6, 2), (6, 4), (4, 2), only (6, 2) satisfies the above condition of X/Y being an odd integer.
So, we can uniquely determine the values of X and Y which are 6 and 2 respectively.
If we take the second statement alone,
12 = 2 * 2 * 3
We want 12 to be the product of two even numbers.
The only possibility is when the numbers are 2 and 6.
However, we don't know any relation between X and Y.
So, both of them can be either 2 or 6.
Therefore, statement II alone is not sufficient to determine the value of X.
Hence, option A is the correct answer.
On a given day a boat ferried 1,500 passengers across the river in 12 hr. How many round trips did it make?
I. The boat can carry 200 passengers at any time.
II. It takes 40 min each way and 20 min of waiting time at each terminal.
Solution
The question asked is about the number of round trips made in 12 hours. This can be answered if we know the time of travel and the time of waiting. So, the question can be answered by using statement 2 alone but not by using statement 1 alone.
What will be the time for downloading software?
I. Transfer rate is 6 kilobytes per second.
II. The size of the software is 4.5 megabytes.
Solution
We cannot answer the question using either of the statements alone. If we consider both the statements i.e. transfer rate is 6 kilobytes per second and the size of the software is 4.5*1024 kilobytes = 4608 kilobytes then download time = 4608 / 6 seconds. Hence, the question can be answered by using both the statements together, but cannot be answered by using either statement alone.
A square is inscribed in a circle. What is the difference between the area of the circle and that of the square?
I. The diameter of the circle is $$25 \sqrt{2}$$ cm.
II. The side of the square is $$25$$ cm.
Solution
In these type of questions, we don't need to find out the exact answer but just check if the answer can be calculated.
When a square is inscribed inside a circle, the diagonal of the square is a diameter of the circle. Hence, if either the circle diameter or side of the square is given, then we can determine the areas of both the circle and square as well as the difference between their areas.
Hence, the question can be answered by using either statement alone.
Two friends, Ram and Gopal, bought apples from a wholesale dealer. How many apples did they buy?
I. Ram bought one-half the number of apples that Gopal bought.
II. The wholesale dealer had a stock of 500 apples.
Solution
Consider the first statement. We just know the relation between number of apples of bought by the two guys. Hence, the question cannot be answered using this statement.
Based on the total number of available apples, we cannot determine how many of them were bought by Ram and Gopal.
Using both statements together, we don't know how many apples the two of them bought together. Hence, we cannot answer the question using even both the statements together.
At a village mela, the following six nautankis (plays) are scheduled as shown in the table below.
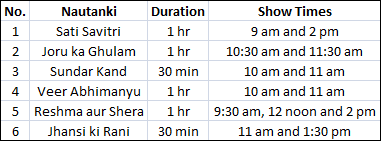
You wish to see all the six nautankis. Further, you wish to ensure that you get a lunch break from
12.30 p.m. to 1.30 p.m. Which of the following ways can you do this?
Solution
According to given conditions , following time table is possible:

hence option C.
Mrs Ranga has three children and has difficulty remembering their ages and months of their birth. The clue below may help her remember.
. The boy, who was born in June, is 7 years old.
. One of the children is 4 years old but it was not Anshuman.
. Vaibhav is older than Suprita.
. One of the children was born in September, but it was not Vaibhav.
. Suprita’s birthday is in April.
. The youngest child is only 2-year-old.
Based on the above clues, which one of the following statements is true?
Solution
According to given conditions ,we get

The Bannerjees, the Sharmas, and the Pattabhiramans each have a tradition of eating Sunday lunch as a family. Each family serves a special meal at a certain time of day. Each family has a particular set of chinaware used for this meal. Use the clues below to answer the following question.
. The Sharma family eats at noon.
. The family that serves fried brinjal uses blue chinaware.
. The Bannerjee family eats at 2 o’clock.
. The family that serves sambar does not use red chinaware.
. The family that eats at 1 o’clock serves fried brinjal.
. The Pattabhiraman family does not use white chinaware.
. The family that eats last likes makkai-ki-roti.
Which one of the following statements is true?
Solution
According to given conditions we have -

While Balbir had his back turned, a dog ran into his butcher shop, snatched a piece of meat off the counter and ran out. Balbir was mad when he realised what had happened. He asked three other shopkeepers, who had seen the dog, to describe it. The shopkeepers really did not want to help Balbir. So each of them made a statement which contained one truth and one lie.
. Shopkeeper number 1 said: “The dog had black hair and a long tail.”
. Shopkeeper number 2 said: “The dog had a short tail and wore a collar.”
. Shopkeeper number 3 said: “The dog had white hair and no collar.”
Based on the above statements, which of the following could be a correct description?
Solution
We know that Shopkeeper 1 said: “The dog had black hair and a long tail.”. Lets consider the first part as false and other as true. So we have - dog didn't have black hair and the dog had a long tail. Shopkeeper 2 said: “The dog had a short tail and wore a collar.” Here first part has to be false and other consequently will be true. So the dog wore a collar. Shopkeeper 3 said: “The dog had white hair and no collar.” Here 2nd part has to be false and hence 1st part has to be true. Thus, our first assumption satisfies all required conditions. Hence, in this case, we have - The dog had white hair, long tail and a collar. Hence option b.
On her walk through the park, Hamsa collected 50 coloured leaves, all either maple or oak. She sorted them by category when she got home, and found the following:
The number of red oak leaves with spots is even and positive.
The number of red oak leaves without any spot equals the number of red maple leaves without spots.
All non-red oak leaves have spots, and there are five times as many of them as there are red spotted oak leaves.
There are no spotted maple leaves that are not red.
There are exactly 6 red spotted maple leaves.
There are exactly 22 maple leaves that are neither spotted nor red.
How many oak leaves did she collect?
Solution
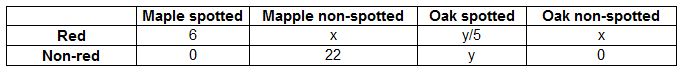
6+x+22+x+6y/5 = 50
=> 5x + 3y = 55
Since y/5 is even, y should be a multiple of 10
The only possible value is 10
So, y = 10 and x = 5
No. of oak leaves = 17
Eight people carrying food baskets are going for a picnic on motorcycles.
Their names are A, B, C, D, E, F, G, and H. They have 4 motorcycles M1, M2, M3 and M4 among them. They also have 4 food baskets O, P, Q and R of different sizes and shapes and each can be carried only on motorcycles M1, M2, M3 and M4 respectively.
No more than 2 persons can travel on a motorcycle and no more than one basket can be carried on a motorcycle. There are 2 husband-wife pairs in this group of 8 people and each pair will ride on a motorcycle together.
C cannot travel with A or B. E cannot travel with B or F. G cannot travel with F, or H, or D.
The husband-wife pairs must carry baskets O and P. Q is with A and P is with D.
F travels on M1 and E travels on M2 motorcycles.
G is with Q, and B cannot go with R.
Who is travelling with H?
Solution
It is given in the statements, that C cannot travel with A or B. E cannot travel with B or F. G cannot travel with F, or H, or D. By formulating the table we get
Q is with A and G is with Q => G and Q are travelling together on motorcycle M3
F travels on M1 and E travels on M2 motorcycles.
D is travelling with P on M2 => D and E are traveling together on M2
B cannot go with R => F and B go together on M1
Therefore, C and H go together on M4
So, the table can formed as below :
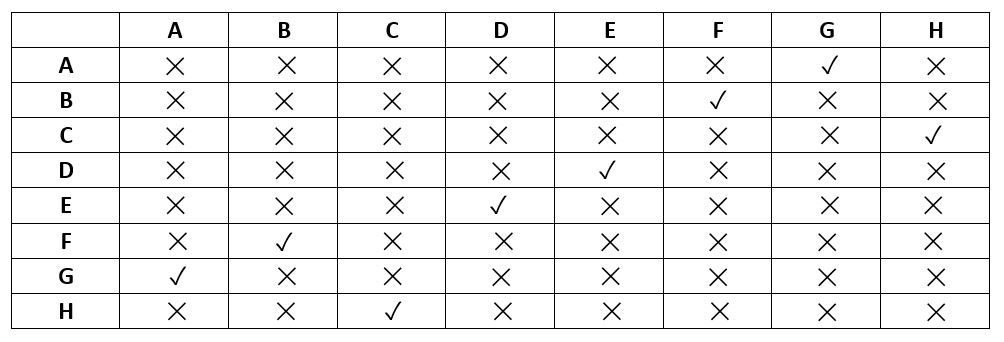
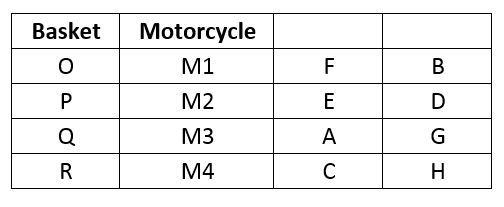
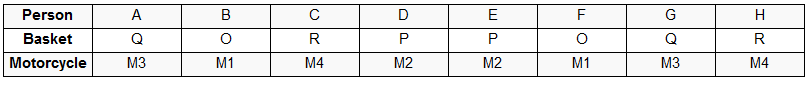
Hence, C would be travelling with H.
In a family gathering there are 2 males who are grandfathers and 4 males who are fathers. In the same gathering there are 2 females who are grandmothers and 4 females who are mothers. There is at least one grandson or a granddaughter present in this gathering. There are 2 husband-wife pairs in this group. These can either be a grandfather and a grandmother, or a father and a mother. The single grandfather (whose wife is not present) has 2 grandsons and a son present. The single grandmother (whose husband is not present) has 2 grand daughters and a daughter present. A grandfather or a grandmother present with their spouses does not have any grandson or granddaughter present. What is the minimum number of people present in this gathering?
Solution
The bare minimum requirement for the single grandfather and grandmother are as follows:
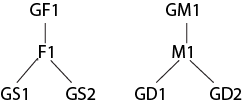
GF implies Grandfather, GM Grandmother, F Father, M Mother, GS Grandson and GD Granddaughter. The family trees above account for 2 fathers, 2 mothers, 1 GF and 1 GM. Hence, we need 1 more GF, 1 GM, 2 fathers and 2 mothers and two married couples.
The bare minimum tree that would provide this structure is as follows:

Using these three structures, we have fit all of our requirements. Thus, if GF1, GF2 and GM1 are siblings with the following family trees present, we would have the required number of people in attendance. Hence, the minimum is 12 people.
I have a total of Rs. 1,000. Item A costs Rs. 110, item B costs Rs. 90, item C costs Rs. 70, item D costs Rs. 40 and item E costs Rs. 45. For every item D that I purchase, I must also buy two of item B. For every item A, I must buy one of item C. For every item E, I must also buy two of item D and one of item B. For every item purchased I earn 1,000 points and for every rupee not spent I earn a penalty of 1,500 points. My objective is to maximise the points I earn. What is the number of items that I must purchase to maximise my points?
Solution
According to given condition we find average costs for products bought.
If D is bought then - D +2*B . So we spend 40+180 =220 Rs for 3000 points. Hence, cost per 1000 points is 73.33
If A is bought then - A+C . So we spend 110 + 70 = 180 for 2000 points. Hence, cost per 1000 points is 90
If E is bought then - E+2*D+4*B+B . So we spend 45 + 80 + 360 + 90 = 575 for 8000 points. Hence, cost per 1000 points is 71.875.
If B is bought then I spend Rs 90 per 1000 points.
If C is bought then I spend Rs 70 per 1000 points.
To maximise points we need to select the item that costs the least per 1000 points. Hence, C costs the least per 1000 points. Hence, we should buy as many C items as possible.
Maximum C that can be bought is [1000/70] = 14 items and Rs 20 would be left over. However, the unspent money would attract a penalty of 30000 points. Hence, instead of buying 14 C items, we should buy 13 C items and 1 B item so that total money spent is 1000.
Four friends Ashok, Bashir, Chirag and Deepak are out for shopping. Ashok has less money than three times the amount that Bashir has. Chirag has more money than Bashir. Deepak has an amount equal to the difference of amounts with Bashir and Chirag. Ashok has three times the money with Deepak. They each have to buy at least one shirt, or one shawl, or one sweater, or one jacket that are priced Rs. 200, Rs. 400, Rs. 600, and Rs. 1,000 a piece respectively. Chirag borrows Rs. 300 from Ashok and buys a jacket. Bashir buys a sweater after borrowing Rs. 100 from Ashok and is left with no money. Ashok buys three shirts. What is the costliest item that Deepak could buy with his own money?
Solution
According to given conditions Bashir started with 500Rs Chirag should have 700 + something , which when subtracted from 500 get money which Deepak has. Also Ashok should have < 1500 and his money should be 3 times that of deepak . Thus there;s only 1 possibility that Ashok has 1200rs and deepak has 400rs. So the costliest item that deepak can buy is shawl worth 400 rs.
In a ‘keep-fit’ gymnasium class there are 15 females enrolled in a weight-loss programme. They all have been grouped in any one of the five weight-groups W1, W2, W3, W4, or W5. One instructor is assigned to one weight-group only.
Sonali, Shalini, Shubhra and Shahira belong to the same weight-group.
Sonali and Rupa are in one weight-group, Rupali and Renuka are also in one weight-group.
Rupa, Radha, Renuka, Ruchika, and Ritu belong to different weight groups.
Somya cannot be with Ritu, and Tara cannot be with Radha.
Komal cannot be with Radha, Somya, or Ritu.
Shahira is in W1 and Somya is in W4 with Ruchika.
Sweta and Jyotika cannot be with Rupali, but are in a weight-group with total membership of four.
No weight-group can have more than five or less than one member.
Amita, Babita, Chandrika, Deepika and Elina are instructors of weight-groups with membership sizes 5, 4, 3, 2 and 1 respectively. Who is the instructor of Radha?
Solution
According to given conditions, the groups are as follows:
Case 1:
W1 : Sonali, Shalini, Shubhra ,Shahira and Rupa
W4: Somya , Ruchika, Jyotika, sweta
: Renuka, Rupali, Komal
: Ritu and Tara
: Radha
Case 2:
W1 : Sonali, Shalini, Shubhra ,Shahira and Rupa
W4: Somya , Ruchika
: Renuka, Rupali, Komal
: Ritu, Tara, Jyotika, sweta
: Radha
Hence, Radha must be alone in a group . Therefore, her trainer is Elina.
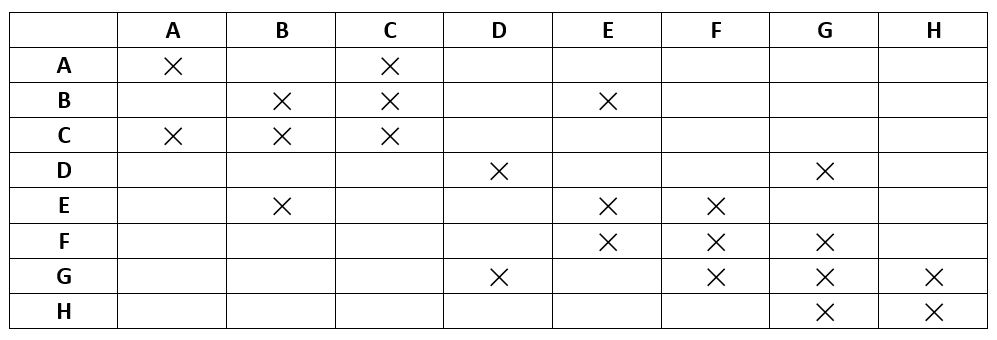
A king has unflinching loyalty from eight of his ministers M1 to M8, but he has to select only four to make a cabinet committee. He decides to choose these four such that each selected person shares a liking with at least one of the other three selected. The selected persons must also hate at least one of the likings of any of the other three persons selected.
M1 likes fishing and smoking, but hates gambling.
M2 likes smoking and drinking, but hates fishing.
M3 likes gambling, but hates smoking,
M4 likes mountaineering, but hates drinking,
M5 likes drinking, but hates smoking and mountaineering.
M6 likes fishing, but hates smoking and mountaineering.
M7 likes gambling and mountaineering, but hates fishing.
M8 likes smoking and gambling, but hates mountaineering.
Who are the four people selected by the king?
Solution

Looking at each option and the table. Only Option D satisfies the given condition that each selected person shares a liking with at least one of the other three selected. The selected persons must also hate at least one of the likings of any of the other three persons selected.
Directions for the following four questions: Answer the questions based on the following information.
A and B are two sets (e.g. A = Mothers, B = Women).
The elements that could belong to both the sets (e.g. women who are mothers) is given by the set $$C = A \cap B$$.
The elements which could belong to either A or B, or both, is indicated by the set $$D = A \cup B$$ .
A set that does not contain any elements is known as a null set represented by $$\phi$$(e.g. if none of the women in the set B is a mother, then $$C = A \cap B$$ is a null set, or C = $$\phi$$).
Let ‘V’ signify the set of all vertebrates, ‘M’ the set of all mammals, ‘D’ dogs, ‘F’ fish, ‘A’ alsatian and ‘P’, a dog named Pluto.
Given that $$X = M \cap D$$ is such that $$X = D$$. Which of the following is true?
Solution
It is given that $$X = M \cap D$$ is such that $$X = D$$, which means D is a subset of M . Which means all dogs are mammals. Hence , option A.
If $$Y = F \cap (D \cap V)$$ is not a null set, it implies that
Solution
We know that all dogs are vertebrates. Hence $$D \cap V)$$ = D . Ahead it is given that $$Y = F \cap D $$ is not a null set which implies that some fish are dogs. Hence , option C.
If $$Z = (P \cap D) \cup M$$, then
Solution
From $$P \cap D$$ is a set containing just pluto ,as pluto is subset of dog D, hence $$P \cap D$$ = P . Also $$P \cup M$$ would be set of pluto and all mammals together.
If $$P \cap A = \phi$$ and $$P \cup A = D$$, then which of the following is true?
Solution
We know that $$P \cap A = \phi$$ means that the pluto is not an alsatian and $$P \cup A = D$$ means that the pluto along with alsatian makes the set D . hence option D - Both A and C.
Directions for the following five questions: Answer the questions based on the following information.
For the word given at the top of each table, match the dictionary definitions on the left (A, B, C, D) with their corresponding usage on the right (E, F, G, H). Out of the four possibilities given in the boxes below the table, select the one that has all the definitions and their usages correctly matched.
EXCEED

Solution
Take a look at the sentence F where it is mentioned "Their accomplishment exceeded our expectations." This means exceed refers toB. So B goes with F.
Now take a look at the sentence G.It is written that "He exceeded his authority....". Here "exceed " refers to crossing the limit which is mentioned in D. Hence D will go with G.
Only option A goes with B-F, D-G
INFER

Solution
The sentence in E goes like this:"We see smoke and infer fire." It means we are infering fire based on some reason. Hence A will go with E.
"Surmise" ,means "to suppose something is true without having proof." In F, the usage of infer is similar where it is mentioned that the user may infer something without any proof. Hence B goes with F.
In G, infer means to point out something which relates option C.
Hence the correct option is D
Mellow

Solution
In E mellow means "freed from rashness" which appropriately matches with B.
In H, mellow soils means "soils of soft and loamy consistency" which matches with C.
In G, mellow means "to be adequately aged so as to exhibit softness". This matches with A.
Hence the correct option is C.
Relief

Solution
Point E says that the release of a sentry after the morning shift is followed by a ceremony => D-E
In point F, removing shows helped to lighten his distress => A-F
Clearly, playing cards acts as a diversion to that person => C-G
In point H, disaster victims were offered an aid => B-H
Purge

Solution
In option E, the opposition was removed after the coup, so C-E is a pair.
In option F, he removed his name from the charge of heresy, hence A-F is a pair.
In option G, causing evacuation of interior parts is bad for the brain, hence D-G.
In option H, cleaning water by distillation is recommended. B-H fits best.
The Union Government’s present position vis-a-vis the upcoming United Nations conference on racial and related discrimination worldwide seems to be the following: discuss race please, not caste; caste is our very own and not at all as bad as you think. The gross hypocrisy of that position has been lucidly underscored by Kancha Ilaiah. Explicitly, the world community is to be cheated out of considering the matter on the technicality that caste is not, as a concept, tantamount to a racial category. Internally, however, allowing the issue to be put on agenda at the said conference would, we are patriotically admonished, damage the country’s image. Somehow, India’s virtual beliefs elbow out concrete actualities. Inverted representations, as we know, have often been deployed in human histories as balm for the forsaken — religion being the most persistent of such inversions. Yet, we would humbly submit that if globalising our markets is thought as good for the ‘national’ pocket, globalising our social inequities might not be so bad for the mass of our people. After all, racism was as uniquely institutionalised in South Africa as caste discrimination has been within our society; why then can’t we permit the world community to express itself on the latter with a fraction of the zeal with which, through the years, we pronounced on the former?
As to the technicality about whether or not caste is admissible into an agenda about race (that the conference is also about ‘related discriminations’ tends to be forgotten), a reputed sociologist has recently argued that where race is a ‘biological’ category caste is a ‘social’ one. Having earlier fiercely opposed implementation of the Mandal Commission Report, the said sociologist is at least to be complemented now for admitting, however tangentially, that caste discrimination is a reality, although, in his view, incompatible with racial discrimination. One would like quickly to offer the hypothesis that biology, in important ways that affect the lives of many millions, is in itself perhaps a social construction. But let us look at the matter in another way.
If it is agreed — as per the position today at which anthropological and allied scientific determinations rest — that the entire race of homo sapiens derived from an originary black African female (called ‘Eve’), then one is hard put to understand how, on some subsequent ground, ontological distinctions are to be drawn either between races or castes. Let us also underline the distinction between the supposition that we are all god’s children and the rather more substantiated argument about our descent from ‘Eve’, lest both positions are thought to be equally diversionary. It then stands to reason that all subsequent distinctions are, in modern parlance, ‘constructed’ ones, and like all ideological constructions, attributable to changing equations between knowledge and power among human communities through contested histories here, there, and elsewhere.
This line of thought receives, thankfully, extremely consequential buttress from the findings of the Human Genome Project. Contrary to earlier (chiefly 19th-century colonial) persuasions on the subject of race, as well as, one might add, the somewhat infamous Jensen offerings in the 20th century from America, those finding deny genetic difference between ‘races’. If anything, they suggest that environmental factors impinge on gene-function, as a dialectic seems to unfold between nature and culture. It would thus seem that ‘biology’ as the constitution of pigmentation enters the picture first only as a part of that dialectic. Taken together, the originary mother stipulation and the Genome findings ought indeed to furnish ground for human equality across the board, as well as yield policy initiatives towards equitable material dispensations aimed at building a global order where, in Hegel’s stirring formulation, only the rational constitutes the right. Such, sadly, is not the case as everyday fresh arbitrary grounds for discrimination are constructed in the interests of sectional dominance.
When the author writes ‘globalising our social inequities’, the reference is to
Solution
Read these lines "Yet, we would humbly submit that if globalising our markets are thought good for the ‘national’ pocket, globalising our social inequities might not be so bad for the mass of our people. After all, racism was as uniquely institutionalised in South Africa as caste discrimination has been within our society; why then can’t we permit the world community to express itself on the latter with a fraction of the zeal with which, through the years, we pronounced on the former?"
The issue at the hand is to openly discuss the social inequities.Hence option A is correct.
Option C is incorrect as delimitation means to fix the limits which is nowhere mentioned in the passage.
According to the author, ‘inverted representations as balm for the forsaken’
Solution
The author says inverted representations have "often been deployed in human histories as balm for the forsaken - religion being the most persistent of such inversions." The word "balm" might seem positive, but the author's framing is critical - these inversions are deployed to pacify the oppressed, not to genuinely help them.
The author is pointing out that such representations serve to keep people oppressed by offering false comfort rather than real change. Option A is wrong because the author isn't endorsing this as "good." Option D misreads the meaning — it's not about inverting the status quo but about maintaining it through ideological deception.
Based on the passage, which broad areas unambiguously fall under the purview of the UN conference being discussed?
A. Racial prejudice
B. Racial pride
C. Discrimination, racial or otherwise
D. Caste-related discrimination
E. Race-related discrimination
Solution
Option C is out. Also there is nothing related to racial pride. Out of others only A and E are the broad areas that fall under UN preview of discussion.
According to the author, the sociologist who argued that race is a ‘biological’ category and caste is a ‘social’ one,
Solution
The passage says the sociologist is "to be complimented now for admitting, however tangentially, that caste discrimination is a reality." This maps directly to option B.
Option A is wrong - the author notes the sociologist "earlier fiercely opposed the Mandal Commission Report," placing him in opposition to the author's orientation.
Option D goes too far: the sociologist acknowledges caste discrimination tangentially but is arguing the two are incompatible, not affirming both equally.
Option C distorts the argument - the sociologist speaks of conceptual incompatibility between race and caste, not between people.
An important message in the passage, if one accepts a dialectic between nature and culture, is that
Solution
Option A is out . Option D is also out as caste is completely social construct. Out of B and C , B can be inferred from the last part of the passage.
Studies of the factors governing reading development in young children have achieved a remarkable degree of consensus over the past two decades. The consensus concerns the causal role of ‘phonological skills in young children’s reading progress. Children who have good phonological skills, or good ‘phonological awareness’ become good readers and good spellers. Children with poor phonological skills progress more poorly. In particular, those who have a specific phonological deficit are likely to be classified as dyslexic by the time that they are 9 or 10 years old.
Phonological skills in young children can be measured at a number of different levels. The term phonological awareness is a global one, and refers to a deficit in recognising smaller units of sound within spoken words. Development work has shown that this deficit can be at the level of syllables, of onsets and rimes, or phonemes. For example, a 4-year old child might have difficulty in recognising that a word like valentine has three syllables, suggesting a lack of syllabic awareness. A five-year-old might have difficulty in recognizing that the odd work out in the set of words fan, cat, hat, mat is fan. This task requires an awareness of the sub-syllabic units of the onset and the rime. The onset corresponds to any initial consonants in a syllable words, and the rime corresponds to the vowel and to any following consonants. Rimes correspond to rhyme in single-syllable words, and so the rime in fan differs from the rime in cat, hat and mat. In longer words, rime and rhyme may differ. The onsets in val:en:tine are /v/ and /t/, and the rimes correspond to the selling patterns ‘al’, ‘en’ and’ ine’.
A six-year-old might have difficulty in recognising that plea and pray begin with the same initial sound. This is a phonemic judgement. Although the initial phoneme /p/ is shared between the two words, in plea it is part of the onset ‘pl’ and in pray it is part if the onset ‘pr’. Until children can segment the onset (or the rime), such phonemic judgements are difficult for them to make. In fact, a recent survey of different developmental studies has shown that the different levels of phonological awareness appear to emerge sequentially. The awareness of syllables, onsets, and rimes appears to merge at around the ages of 3 and 4, long before most children go to school. The awareness of phonemes, on the other hand, usually emerges at around the age of 5 or 6, when children have been taught to read for about a year. An awareness of onsets and rimes thus appears to be a precursor of reading, whereas an awareness of phonemes at every serial position in a word only appears to develop as reading is taught. The onset-rime and phonemic levels of phonological structure, however, are not distinct. Many onsets in English are single phonemes, and so are some rimes (e.g. sea, go, zoo).
The early availability of onsets and rimes is supported by studies that have compared the development of phonological awareness of onsets, rimes, and phonemes in the same subjects using the same phonological awareness tasks. For example, a study by Treiman and Zudowski used a same/different judgement task based on the beginning or the end sounds of words. In the beginning sound task, the words either began with the same onset, as in plea and plank, or shared only the initial phoneme, as in plea and pray. In the end-sound task, the words either shared the entire rime, as in spit and wit, or shared only the final phoneme, as in rat and wit. Treiman and Zudowski showed that four- and five-year-old children found the onset-rime version of the same/different task significantly easier than the version based on phonemes. Only the sixyear- olds, who had been learning to read for about a year, were able to perform both versions of the tasks with an equal level of success.
From the following statements, pick out the true statement according to the passage.
Solution
Option A: This is true; for example, the monosyllabic word pray has only one onset /pr/ while the trisyllabic word val:en:tine has two onsets - /v/ and /t/, and three rimes corresponding to the selling patterns ‘al’, ‘en’ and ’ine’. Therefore, Option A is a valid inference.
Options B and C: We do not know if these are necessarily true.
Which one of the following is likely to emerge last in the cognitive development of a child?
Solution
It is clearly stated in the passage phoneme emerges only at the age of 6. Hence option D.
A phonological deficit in which of the following is likely to be classified as dyslexia?
Solution
It can be inferred from the passage that phonological skills in young children can be measured at a number of different levels. Hence phonological deficit can be classified in any one or more of the options . Hence D.
The Treiman and Zudowski experiment found evidence to support which of the following conclusions?
Solution
We can clearly infer from the passage that 4-5 years old found the onset-rime version to be easier, it was only for the 6 years old who were able to perform both the versions with equal success. Hence option B.
The single-syllable words Rhyme and Rime are constituted by the exact same set of
A. rime(s)
B. onset(s)
C. rhyme(s)
D. phonemes(s)
Solution
It is stated in the passage that ' rimes correspond to rhymes in single-syllabus words ' . Hence option B. The onset parts would be different. For example, for cat and hat the onsets would be /c/ and /h/.
Billie Holiday died a few weeks ago. I have been unable until now to write about her, but since she will survive many who receive longer obituaries, a short delay in one small appreciation will not harm her or us. When she died we — the musicians, critics, all who were ever transfixed by the most heart-rending voice of the past generation — grieved bitterly. There was no reason to. Few people pursed self-destruction more whole-heartedly than she, and when the pursuit was at an end, at the age of 44, she had turned herself into a physical and artistic wreck. Some of us tried gallantly to pretend otherwise, taking comfort in the occasional moments when she still sounded like a ravaged echo of her greatness. Others had not even the heart to see and listen any more. We preferred to stay home and, if old and lucky enough to own the incomparable records of her heyday from 1937 to 1946, many of which are not even available on British LP, to recreate those coarse-textured, sinuous, sensual and unbearable sad noises which gave her a sure corner of immortality. Her physical death called, if anything, for relief rather than sorrow. What sort of middle age would she have faced without the voice to earn money for her drinks and fixes, without the looks — and in her day she was hauntingly beautiful — to attract the men she needed, without business sense, without anything but the disinterested worship of ageing men who had heard and seen her in her glory?
And yet, irrational though it is, our grief expressed Billie Holiday’s art, that of a woman for whom one must be sorry. The great blues singers, to whom she may be justly compared, played their game from strength. Lionesses, though often wounded or at bay (did not Bessie Smith call herself ‘a tiger, ready to jump’?), their tragic equivalents were Cleopatra and Phaedra; Holiday’s was an embittered Ophelia. She was the Puccini heroine among blues singers, or rather among jazz singers, for though she sang a cabaret version of the blues incomparably, her natural idiom was the pop song. Her unique achievement was to have twisted this into a genuine expression of the major passions by means of a total disregard of its sugary tunes, or indeed of any tune other than her own few delicately crying elongated notes, phrased like Bessie Smith or Louis Armstrong in sackcloth, sung in a thin, gritty, haunting voice whose natural mood was an unresigned and voluptuous welcome for the pains of love. Nobody has sung, or will sing, Bess’s songs from Porgy as she did. It was this combination of bitterness and physical submission, as of someone lying still while watching his legs being amputated, which gives such a blood-curdling quality to her Strange Fruit, the anti-lynching poem which she turned into an unforgettable art song. Suffering was her profession; but she did not accept it.
Little need be said about her horrifying life, which she described with emotional, though hardly with factual, truth in her autobiography Lady Sings the Blues. After an adolescence in which self-respect was measured by a girl’s insistence on picking up the coins thrown to her by clients with her hands, she was plainly beyond help. She did not lack it, for she had the flair and scrupulous honesty of John Hammond to launch her, the best musicians of the 1930s to accompany her — notably Teddy Wilson, Frankie Newton and Lester Young — the boundless devotion of all serious connoisseurs, and much public success. It was too late to arrest a career of systematic embittered self-immolation. To be born with both beauty and selfrespect in the Negro ghetto of Baltimore in 1915 was too much of a handicap, even without rape at the age of 10 and drug-addiction in her teens. But, while she destroyed herself, she sang, unmelodious, profound and heartbreaking. It is impossible not to weep for her, or not to hate the world which made her what she was.
Why will Billie Holiday survive many who receive longer obituaries?
Solution
The term , survive many who shall receive longer obituaries , means that her name and fame would continue to live longer than most people.
From the passage it can be inferred that her claim to fame was her creation of the Blues. Option B and D cannot be inferred from the passage. The passage does not state that she had a mellow voice as well. Instead it states that she had a thin and gritty voice. Hence, option A is the correct answer.
According to the author, if Billie Holiday had not died in her middle age
Solution
The passage explains that her physical death has been called for as relief rather than sorrow. Hence option C is clearly the answer.
You can also refer to the following lines:"What sort of middle age would she have faced without the voice to earn money for her drinks and fixes, without the looks — and in her day she was hauntingly beautiful — to attract the men she needed, without business sense, without anything but the disinterested worship of ageing men who had heard and seen her in her glory?" This implies option c.
Which of the following statements is not representative of the author’s opinion?
Solution
Following sentences from the passage shows that option D is not what author said ' Suffering was her profession; but she did not accept it.'.
According to the passage, Billie Holiday was fortunate in all but one of which of the following ways?
Solution
The question asks which of the following cannot be inferred with respect to the passage.
From the last paragraph , we can understand that she had a honest producer to work with, that she had the looks, and also that at her prime she had religious fan following.
But, the fact that Bessie and Louis Armstrong accompanied her cannot be inferred from the passage as it is only mentioned that she was inspired by the singing styles of Bessie and Louis Armstrong.
The narrative of Dersu Uzala is divided into two major sections, set in 1902, and 1907, that deal with separate expeditions which Arseniev conducts into the Ussuri region. In addition, a third time frame forms a prologue to the film. Each of the temporal frames has a different focus, and by shifting them Kurosawa is able to describe the encroachment of settlements upon the wilderness and the consequent erosion of Dersu’s way of life. As the film opens, that erosion has already begun. The first image is a long shot of a huge forest, the trees piled upon one another by the effects of the telephoto lens so that the landscape becomes an abstraction and appears like a huge curtain of green. A title informs us that the year is 1910. This is as late into the century as Kurosawa will go. After this prologue, the events of the film will transpire even farther back in time and will be presented as Arseniev’s recollections. The character of Dersu Uzala is the heart of the film, his life the example that Kurosawa wishes to affirm. Yet the formal organization of the film works to contain, to close, to circumscribe that life by erecting a series of obstacles around it. The film itself is circular, opening and closing by Dersu’s grave, thus sealing off the character from the modern world to which Kurosawa once so desperately wanted to speak. The multiple time frames also work to maintain a separation between Dersu and the contemporary world. We must go back father even than 1910 to discover who he was. But this narrative structure has yet another implication. It safeguards Dersu’s example, inoculates it from contamination with history, and protects it from contact with the industrialised, urban world. Time is organised by the narrative into a series of barriers, which enclose Dersu in a kind of vacuum chamber, protecting him from the social and historical dialectics that destroyed the other Kurosawa heroes. Within the film, Dersu does die, but the narrative structure attempts to immortalise him and his example, as Dersu passes from history into myth.
We see all this at work in the enormously evocative prologue. The camera tilts down to reveal felled trees littering the landscape and an abundance of construction. Roads and houses outline the settlement that is being built. Kurosawa cuts to a medium shot of Arseniev standing in the midst of the clearing, looking uncomfortable and disoriented. A man passing in a wagon asks him what he is doing, and the explorer says he is looking for a grave. The driver replies that no one has died here, the settlement is too recent. These words enunciate the temporal rupture that the film studies. It is the beginning of things (industrial society) and the end of things (the forest), the commencement of one world so young that no one has had time yet to die and the eclipse of another, in which Dersu had died. It is his grave for which the explorer searches. His passing symbolises the new order, the development that now surrounds Arseniev. The explorer says he buried his friend three years ago next to huge cedar and fir trees, but now they are all gone. The man on the wagon replies they were probably chopped down when the settlement was built, and he drives off. Arseniev walks to a barren, treeless spot next to a pile of bricks. As he moves, the camera tracks and pans to follow, revealing a line of freshly built houses and a woman hanging her laundry to dry. A distant train whistle is heard, and the sounds of construction in the clearing vie with the cries of birds and the rustle of wind in the trees. Arseniev pauses, looks around for the grave that once was, and murmurs desolately, ‘Dersu’. The image now cuts farther into the past, to 1902, and the first section of the film commences, which describes Arseniev’s meeting with Dersu and their friendship.
Kurosawa defines the world of the film initially upon a void, a missing presence. The grave is gone, brushed aside by a world rushing into modernism, and now the hunter exists only in Arseniev’s memories. The hallucinatory dreams and visions of Dodeskaden are succeeded by nostalgic, melancholy ruminations. Yet by exploring these ruminations, the film celebrates the timelessness of Dersu’s wisdom. The first section of the film has two purposes: to describe the magnificence and inhuman vastness of nature and to delineate the code of ethics by which Dersu lives and which permits him to survive in these conditions. When Dersu first appears, the other soldiers treat him with condescension and laughter, but Arseniev watches him closely and does not share their derisive response. Unlike them, he is capable of immediately grasping Dersu’s extraordinary qualities. In camp, Kurosawa frames Arseniev by himself, sitting on the other side of the fire from his soldiers. While they sleep or joke among themselves, he writes in his diary and Kurosawa cuts in several point-of-view shots from his perspective of trees that appear animated and sinister as the firelight dances across their gnarled, leafless outlines. This reflective dimension, this sensitivity to the spirituality of nature, distinguishes him from the others and forms the basis of his receptivity to Dersu and their friendship. It makes him a fit pupil for the hunter.
How is Kurosawa able to show the erosion of Dersu’s way of life?
Solution
In the first para and 2nd sentence itself the author mentions that Kurosawa uses 3 frames and shift them. Hence option C.
Arseniev’s search for Dersu’s grave
Solution
We can see 'We see all this at work in the enormously evocative prologue...' in 2nd para starting sentences where Arseniev’s search for Dersu’s grave is described . Since it is part of prologue it;s in start of film. Hence option A.
The film celebrates Dersu’s wisdom
Solution
In the last para it is described that 'The hallucinatory dreams and visions of Dodeskaden are succeeded by nostalgic, melancholy ruminations..' . Option D is perfect.
According to the author, the section of the film following the prologue
Solution
IN the 3rd para we can find the sentence '....and to delineate the code of ethics by which Dersu lives and which permits him to survive in these conditions...' Which is part of 1st section after prologue. Hence option C.
In the film, Kurosawa hints at Arseniev’s reflective and sensitive nature
Solution
We can easily find option B and C reffered in last para. hence it has to be all of these.
According to the author, which of these statements about the film is correct?
Solution
The film clearly doesn't expresses its arguments in cirtuitous way. Also it doesn't highlight insularity of anyone. Option C is correct as Dersu - the main protagonist is not in the beginning part. Also refer to the following liines of the paragraph:"The first section of the film has two purposes: to describe the magnificence and in human vastness of nature and to delineate the code of ethics by which Dersu lives and which permits him to survive in these conditions". These lines confirm that the protagonist does not appear in the first part.
Read the passage carefully and answer the questions that follow:
Democracy rests on a tension between two different principles. There is, on the one hand, the principle of equality before the law, or, more generally, of equality, and, on the other, what may be described as the leadership principle. The first gives priority to rules and the second to persons. No matter how skilfully we contrive out schemes, there is a point beyond which the one principle cannot be promoted without some sacrifice of the other.
Alexis de Tocqueville, the great 19th-century writer on democracy, maintained that the age of democracy, whose birth he was witnessing, would also be the age of mediocrity; in saying this, he was thinking primarily of a regime of equality governed by impersonal rules. Despite his strong attachment to democracy, he took great pains to point out what he believed to be its negative side: a dead level plane of achievement in practically every sphere of life. The age of democracy would, in his view, be an unheroic age; there would not be room in it for either heroes or hero-worshippers.
But modern democracies have not been able to do without heroes: this too was foreseen, with much misgiving, by Tocqueville. Tocqueville viewed this with misgiving because he believed, rightly or wrongly, that unlike in aristocratic societies, there was no proper place in a democracy for heroes and, hence, when they arose, they would sooner or later turn into despots. Whether they require heroes or not, democracies certainly require leaders, and, in the contemporary age, breed them in great profusion; the problem is to know what to do with them.
In a world preoccupied with scientific rationality, the advantages of a system based on an impersonal rule of law should be a recommendation with everybody. There is something orderly and predictable about such a system. When life is lived mainly in small, self-contained communities, men are able to take finer personal distinctions into account in dealing with their fellow men. They are unable to do this in a large and amorphous society, and organised living would be impossible here without a system of impersonal rules. Above all, such a system guarantees a kind of equality to the extent that everybody, no matter in what station of life, is bound by the same explicit, often written, rules, and nobody is above them. But a system governed solely by impersonal rules can at best ensure order and stability; it cannot create any shining vision of a future in which mere formal equality will be replaced by real equality and fellowship. A world governed by impersonal rules cannot easily change itself, or when it does, the change is so gradual as to make the basic and fundamental feature of society appear unchanged. For any kind of basic or fundamental change, a push is needed from within, a kind of individual initiative which will create new rules, new terms and conditions of life.
The issue of leadership thus acquires crucial significance in the context of change. If the modern age is preoccupied with scientific rationality, it is no less preoccupied with change. To accept what exists on its own terms is traditional, not modern, and it may be all very well to appreciate tradition in music, dance and drama, but for society as a whole the choice has already been made in favour of modernisation and development. Moreover, in some countries the gap between ideal and reality has become so great that the argument for development and change is now irresistible.
In these countries no argument for development has greater appeal or urgency than the one which shows development to be the condition for the mitigation, if not the elimination, of inequality. There is something contradictory about the very presence of large inequalities in a society which profess to be democratic. It does not take people too long to realise that democracy by itself can guarantee only formal equality; beyond this, it can only whet people’s appetite for real or substantive equality. From this arises their continued preoccupation with plans and schemes that will help to bridge the gap between the ideal of equality and the reality which is so contrary to it.
When pre-existing rules give no clear directions of change, leadership comes into its own. Every democracy invests its leadership with a measure of charisma, and expects from it a corresponding measure of energy and vitality. Now, the greater the urge for change in a society, the stronger the appeal of a dynamic leadership in it. A dynamic leadership seeks to free itself from the constraints of existing rules: in a sense, that is the test of its dynamism. In this process, it may take a turn at which it ceases to regard itself as being bound by these rules, placing itself above them. There is always a tension between ‘charisma’ and ‘discipline’ in the case of a democratic leadership, and when this leadership puts forward revolutionary claims, the tension tends to be resolved at the expense of discipline.
Characteristically, the legitimacy of such a leadership rests on its claim to be able to abolish or at least substantially reduce the existing inequalities in society. From the argument that formal equality or equality before the law is but a limited good, it is often one short step to the argument that it is a hindrance or an obstacle to the establishment of real or substantive equality. The conflict between a ‘progressive’ executive and a ‘conservative’ judiciary is but one aspect of this larger problem. This conflict naturally acquires added piquancy when the executive is elected, and the judiciary appointed.
Dynamic leaders are needed in democracies because
Solution
From the following text, which is picked up from passage '..as greater the urge for a change in society the stronger is the appeal for a dynamic leadership..' Hence option C.
What possible factor would a dynamic leader consider a ‘hindrance’ in achieving the development goals of a nation?
Solution
We can infer from the passage that equality before law or formal equality is a hindrance to the establishment of real or substantive equality. . Refer to the lines in the last paragraph:"From the argument that formal equality or equality before the law is but a limited good, it is often one short step to the argument that it is a hindrance or an obstacle to the establishment of real or substantive equality."This substantiates the answer.
Which of the following four statements can be inferred from the above passage?
A. Scientific rationality is an essential feature of modernity.
B. Scientific rationality results in the development of impersonal rules.
C. Modernisation and development have been chosen over traditional music, dance and drama.
D. Democracies aspire to achieve substantive equality.
Solution
Following sentences from the passages are in line with the statements A,B and D. In statement A, if modern age is preoccupied with scientific rationality then it is also no less preoccupied with change. In B, a world preoccupied with scientific rationality have advantages system based on impersonal rule of laws should be recommendation with everybody. Statement D,states that democracy guarantees formal equality beyond this it can only what people’s appetite for substantive equality.
Option C is a broad statement. In the passage, it has been mentioned that tradition is preferred in music, dance and drama. But in society, modernisation and development have been chosen, instead of tradition. Thus, option C cannot be inferred. So option A is the correct answer.
Tocqueville believed that the age of democracy would be an un-heroic age because
Solution
It can be inferred from the passage that tocqueville believed that unlike aristocratic societies there was no proper place in democracy for heroes and hence if they arose they would sooner or later turn to despots. Hence option A is the correct answer. Also refer to the following lines:"Tocqueville viewed this with misgiving because he believed, rightly or wrongly, that unlike in aristocratic societies there was no proper place in a democracy for heroes and, hence, when they arose they would sooner or later turn into despots."
A key argument the author is making is that
Solution
It can be inferred from the passage that impersonal rules can ensure stability but it can’t create any shinning version of a future in formal equality. Hence option D.
Which of the following four statements can be inferred from the above passage?
A. There is conflict between the pursuit of equality and individuality.
B. The disadvantages of impersonal rules can be overcome in small communities.
C. Despite limitations, impersonal rules are essential in large systems.
D. Inspired leadership, rather than plans and schemes, is more effective in bridging inequality.
Solution
A can be inferred from 1st para and D can be inferred as continued preoccupation with plans schemes will help to bridge the gap between ideals of equality and reality. Hence only A and D can be inferred.
Option B is a distortion of what is given in the passage. The author says that a need for impersonal rules is not felt in a small society. He is not mentioning it as solution.
Option C is only partly true. Impersonal rules are necessary in large and amorphous societies. Thus, a large society with a clear structure would not require impersonal rules.
In the modern scientific story, light was created not once but twice. The first time was in the Big Bang, when the universe began its existence as a glowing, expanding, fireball, which cooled off into darkness after a few million years. The second time was hundreds of millions of years later, when the cold material condensed into dense nuggets under the influence of gravity, and ignited to become the first stars.
Sir Martin Rees, Britain’s astronomer royal, named the long interval between these two enlightements the cosmic ‘Dark Age’. The name describes not only the poorly lit conditions, but also the ignorance of astronomers about that period. Nobody knows exactly when the first stars formed, or how they organized themselves into galaxies — or even whether stars were the first luminous objects. They may have been preceded by quasars, which are mysterious, bright spots found at the centres of some galaxies.
Now two independent groups of astronomers, one led by Robert Becker of the University of California, Davis, and the other by George Djorgovski of the Caltech, claim to have peered far enough into space with their telescopes (and therefore backwards enough in time) to observe the closing days of the Dark age.
The main problem that plagued previous efforts to study the Dark Age was not the lack of suitable telescopes, but rather the lack of suitable things at which to point them. Because these events took place over 13 billion years ago, if astronomers are to have any hope of unravelling them they must study objects that are at least 13 billion light years away. The best prospects are quasars, because they are so bright and compact that they can be seen across vast stretches of space. The energy source that powers a quasar is unknown, although it is suspected to be the intense gravity of a giant black hole. However, at the distances required for the study of Dark Age, even quasars are extremely rare and faint.
Recently some members of Dr Becker’s team announced their discovery of the four most distant quasars known. All the new quasars are terribly faint, a challenge that both teams overcame by peering at them through one of the twin Keck telescopes in Hawaii. These are the world’s largest, and can therefore collect the most light. The new work by Dr Becker’s team analysed the light from all four quasars. Three of them appeared to be similar to ordinary, less distant quasars. However, the fourth and most distant, unlike any other quasar ever seen, showed unmistakable signs of being shrouded in a fog because new-born stars and quasars emit mainly ultraviolet light, and hydrogen gas is opaque to ultraviolet. Seeing this fog had been the goal of would-be Dark Age astronomers since 1965, when James Gunn and Bruce Peterson spelled out the technique for using quasars as backlighting beacons to observe the fog’s ultraviolet shadow.
The fog prolonged the period of darkness until the heat from the first stars and quasars had the chance to ionise the hydrogen (breaking it into its constituent parts, protons and electrons). Ionised hydrogen is transparent to ultraviolet radiation, so at that moment the fog lifted and the universe became the well-lit place it is today. For this reason, the end of the Dark Age is called the ‘Epoch of Re-ionisation’. Because the ultraviolet shadow is visible only in the most distant of the four quasars, Dr Becker’s team concluded that the fog had dissipated completely by the time the universe was about 900 million years old, and oneseventh of its current size.
In the passage, the Dark Age refers to
Solution
Refer to the given lines "Sir Martin Rees, Britain’s astronomer royal, named the long interval between these two enlightenments the cosmic “Dark Age”. The name describes not only the poorly lit conditions, but also the ignorance of astronomers about the period."
Astronomers find it difficult to study the Dark Age because
Solution
Refer these line"The main problem that plagued previous efforts to study the Dark Age was not the lack of suitable telescopes but rather the lack of suitable things at which to point them. Because these events took place over 18 billion years ago, if astronomers are to have any hope of unraveling them they study objects that are at least 13 billion light years away."
This indicates B.
Option D is incorrect as by referring to these lines "However at the distances required for the study of Dark Age, even quasars are extremely rare and faint." , it is clear that the quasars are not faint to begin with but the distance which is required to study them is too large, so they appear faint.
The four most distant quasars discovered recently
Solution
Refer to the given lines "Recently some members of Dr. Becker’s steam announced their discovery of the four most distant quasars known, all the new quasars are terribly faint, a challenge that both teams overcame by peering at them through one of the twin Keck telescope in Hawaii. These are the world’s largest and can therefore collect the most light."
The fog of hydrogen gas seen through the telescopes
Solution
Refer to the given lines "The fog prolonged the period of darkness until the heat from the first stars and quasars had the chance to ionize the hydrogen (breaking it into its constituent parts, protons and electrons). Ionized hydrogen is transparent to ultraviolet radiation, so at that moment the fog lifted and the universe became the well-lit place it is today."
For the following questions answer them individually
Choose the most logical order of sentences from among the given choices to construct a coherent paragraph.
A. Although there are large regional variations, it is not infrequent to find a large number of people sitting here and there and doing nothing.
B. Once in office, they receive friends and relatives who feel free to call any time without prior appointment.
C. While working, one is struck by the slow and clumsy actions and reactions, indifferent attitudes, procedure rather than outcome orientation, and the lack of consideration for others.
D. Even those who are employed often come late to the office and leave early unless they are forced to be punctual.
E. Work is not intrinsically valued in India.
F. Quite often people visit ailing friends and relatives or go out of their way to help them in their personal matters even during office hours.
[CAT 2001]
Solution
Of the given options starting with E or A, E seems to be a better introduction since it highlights the main idea of the passage. Between E- A or E - C, we observe that E- A forms a mandatory pair since it moves from the general “India” to specific “regional variations”. We also notice that D-B also forms a pair with D discussing the "arrival" of employees at the office and then B adding about activities post-arrival (during office hours). F continues on the topic of mingling with relatives mentioned in B and hence, forms a block B - F. Thus, we are left with the arrangement EADBFC.
Option C is the correct answer.
Choose the most logical order of sentences from among the given choices to construct a coherent paragraph.
A. But in the industrial era destroying the enemy’s productive capacity means bombing the factories which are located in the cities.
B. So in the agrarian era, if you need to destroy the enemy’s productive capacity, what you want to do is burn his fields, or if you’re really vicious, salt them.
C. Now in the information era, destroying the enemy’s productive capacity means destroying the information infrastructure.
D. How do you do battle with your enemy?
E. The idea is to destroy the enemy’s productive capacity, and depending upon the economic foundation, that productive capacity is different in each case.
F. With regard to defence, the purpose of the military is to defend the nation and be prepared to do battle with its enemy.
[CAT 2001]
Solution
F introduces the theme of the passage. This is followed by a question in statement D. E follows with an answer to the question. This answer is further described in B, then A and finally C (chronologically in that order).
Choose the most logical order of sentences from among the given choices to construct a coherent paragraph.
A. Michael Hofman, a poet and translator, accepts this sorry fact without approval or complaint.
B. But thanklessness and impossibility do not daunt him.
C. He acknowledges too — in fact, he returns to the point often — that best translators of poetry always fail at some level.
D. Hofman feels passionately about his work and this is clear from his writings.
E. In terms of the gap between worth and rewards, translators come somewhere near nurses and street-cleaners.
[CAT 2001]
Solution
E starts the para by introducing the subject. A comes next and it introduces Michael Hofman. Statements C and D describe Michael Hofman and what he feels about the subject. D is the best concluding statement. Hence, the correct order is EACBD.
Choose the most logical order of sentences from among the given choices to construct a coherent paragraph.
A. Passivity is not, of course, universal.
B. In areas where there are no lords or laws, or in frontier zones where all men go armed, the attitude of the peasantry may well be different.
C. So indeed it may be on the fringe of the unsubmissive.
D. However, for most of the soil-bound peasants the problem is not whether to be normally passive or active, but when to pass from one state to another.
E. This depends on an assessment of the political situation.
[CAT 2001]
Solution
A is the best opening sentence. It introduces the subject. B follows by giving an example of where passivity might not be universal. D-E is a link as D talks about the problem of the peasants and E talks about the environment in which the problem occurs. The logical sequence of sentences is ABCDE.
Choose the most logical order of sentences from among the given choices to construct a coherent paragraph.
A. The situations in which violence occurs and the nature of that violence tends to be clearly defined at least in theory, as in the proverbial Irishman’s question: “Is this a private fight or can anyone join in?”
B. So the actual risk to outsiders, though no doubt higher than our societies, is calculable.
C. Probably the only uncontrolled applications of force are those of social superiors to social inferiors and even here there are probably some rules.
D. However, binding the obligation to kill, members of feuding families engaged in mutual massacre will be genuinely appalled if by some mischance a bystander or outsider is killed.
[CAT 2001]
Solution
A is the best opening sentence. It talks about the nature of violence being clearly defined. This is followed by C, which talks about an exception to the theory mentioned in A. C is followed by D and B is the best concluding statement. The correct order of sentences is, therefore, ACDB.
Fill in the Blanks: But _____ are now regularly written not just for tools, but well-established practices, organisations and institutions, not all of which seem to be _____ away.
Solution
We can identify the correct choice using the second blank: 'practices' do not wither or trade or die 'away'; they 'fade away.' Options A, B and C don't fit in the second blank and hence, can be eliminated.
Fill in the Blanks: The Darwin who _____ is most remarkable for the way in which he _____ the attributes of the world class thinker and head of the household.
Solution
"Combines" is a better fit for the 2nd blank as it has to deal with two phrases, hence eliminating options A and B.
The word in the 1st blank and the word "attributes" must be in the same tense. Hence option D is eliminated and the answer is option C.
Fill in the Blanks: Since her face was free of _____ there was no way to _____ if she appreciated what had happened.
Solution
"Diagnose" is a wrong word for the 2nd blank. Hence option C eliminated.
"Make-up" and "scars" are bad fit-in for the 1st blank.
As her face was expressionless, there was no way to find if she appreciated what had happened. This sounds more meaningful. Hence option B is the answer.
Fill in the Blanks: In this context, the _____ of the British labour movement is particularly _____.
Solution
Clearly, affair and activity don't fit in the first blank, hence can be eliminated. In the second blank, "significant" is the best fit complementing "experience" in the first blank. Hence option C.
Fill in the Blanks: Indian intellectuals may boast, if they are so inclined, of being _____ to the most elitist among the intellectual _____ of the world.
Solution
Even though both "cliques" and "societies" fit into the second blank, clearly "ancestors" fits into first blank the best.
Pick the word from the alternatives given that is most inappropriate in the given context.
Specious: A specious argument is not simply a false one but one that has the ring of truth.
Solution
Specious means 'deceitful' whereas credible means 'convincing'.
So, option c) is the correct answer.
Pick the word from the alternatives given that is most inappropriate in the given context.
Obviate: The new mass transit system may obviate the need for the use of personal cars.
Solution
Obviate means 'to prevent' whereas bolster means 'to strengthen'. So, the answer is option d).
Pick the word from the alternatives given that is most inappropriate in the given context.
Disuse: Some words fall into disuse as technology makes objects obsolete.
Solution
Disuse means being discarded, whereas prevalent is being in use. So, option a) is the most inappropriate word in this context.
Pick the word from the alternatives given that is most inappropriate in the given context.
Parsimonious: The evidence was constructed from very parsimonious scraps of information.
Solution
Parsimonious means frugal, whereas altruistic is the exact opposite of it. So, option d) is the correct answer.
Pick the word from the alternatives given that is most inappropriate in the given context.
Facetious: When I suggested that war is a method of controlling population, my father remarked that I was being facetious.
Solution
Facetious is being mischievous. Jovian means relating to god Jove (or Jupiter)
So, jovian is the correct answer.

