What is the total number of matches played in the tournament?
CAT 2000 Question Paper
Directions for the next 5 questions:
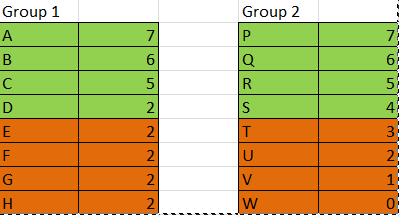
Sixteen teams have been invited to participate in the ABC Gold Cup cricket tournament. The tournament is conducted in two stages. In the first stage, the teams are divided into two groups. Each group consists of eight teams, with each team playing every other team in its group exactly once. At the end of the first stage, the top four teams from each group advance to the second stage while the rest are eliminated. The second stage comprises of several rounds. A round involves one match for each team. The winner of a match in a round advances to the next round, while the loser is eliminated, The team that remains undefeated in the second stage is declared the winner and claims the Gold Cup.
The tournament rules are such that each match results in a winner and a loser with no possibility of a tie. In the first stage a team earns one point for each win and no points for a loss. At the end of the first stage teams in each group are ranked on the basis of total points to determine the qualifiers advancing to the next stage. Ties are resolved by a series of complex tie-breaking rules so that exactly four teams from each group advance to the next stage.
Solution
In 1st stage there were 2 groups each group played 28 matches as $$^8C_2$$ = 28. So total 56 matches after 1st stage . IN 1st round of stage 2, 4 matches are played and in the next round we have 4 teams .The winner is one who defeats every team out of remaining 3 matches . so 3 matches more needed. In total 56+4+3=63.
The minimum number of wins needed for a team in the first stage to guarantee its advancement to the next stage is:
Solution
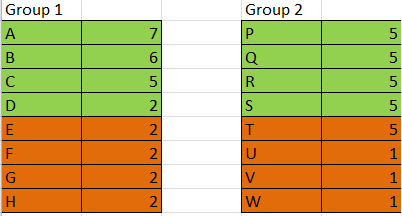
Let us first try to find the maximum number of points with which a team cannot advance to the second stage.
For this to happen the top five teams should have highest possible equal number of points and one team does not advance after the tie breaker.
To maximize the points of top 5 teams all of the top 5 teams should win their matches with the bottom 3 teams. Now each team has 3 points.
The top 5 teams play 5C2 = 10 matches among themselves. There are 10 points to be won from these 10 matches.
Now as all the top 5 teams should have equal number of points each team gets 2 points from these games.
In all each top 5 team gets 3+2 = 5 points each.
In this case after getting 5 points also one of the top 5 teams will not advance to the second round.
Thus the maximum number of points with which a team cannot advance to the second stage is 5.
Therefore at least 6 wins are required for a team to guarantee its advancement to the next stage.
What is the highest number of wins for a team in the first stage in spite of which it would be eliminated at the end of first stage?
Solution
There are 28 matches in the 1st round of 8 player group so in total 28 wins.To find this, we need the top 5 teams to win nearly equal matches. So Let each of the top 5 teams win 5 matches each and the remaining 3 matches are won by the bottom 2 teams. The qualifiers will be decided based on the tie breaking rules. Hence, even with 5 wins a team may end up not qualifying for the next round. Thus, option D is the correct answer.

What is the number of rounds in the second stage of the tournament?’
Solution
2nd stage 1st round has 8 teams , 2nd round will have 4 teams and 3rd round 2 teams where the winner wins .
Which of the following statements is true?
Solution
Consider the below case.
If D wins the tournament he would have 5 wins. But if P loses in second round, he would have 7 wins. Hence option A is incorrect.
We can see that T has more wins than D. Hence option B is incorrect.
Consider the below scenario:
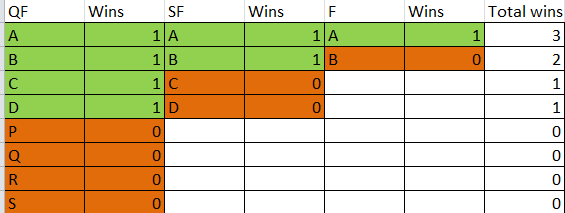
We can see that 2 teams have one win each in the second stage. Hence option D is incorrect.
Consider the following scenario.
If D wins the tournament he would have 5 wins. But T would lose the tournament with 5 wins. Hence option C is correct.
Directions for the next 5 questions: Answer the questions with reference to the table given below: Information Technology Industry in India (Figures are in million US dollars)

The total annual exports lay between 35 and 40 percent of the total annual business of the IT industry, in the years:
Solution
Total annual exports lay of the total annual business of the IT industry in 96-97 can be given as 1383/3807 = 0.36= 36% also total annual exports layof the total annual business of the IT industry in 97-98 can be given as 1970/5031 = 0.39 = 39%. Hence option b.

The highest percentage growth in the total IT business, relative to the previous year was achieved in:
Solution
Highest percentage growth in the total IT business, relative to the previous year was achieved in 95-96 which is equal to (2886-2041)/2041 = 845/2041 = 41.4%
Which one of the following statements is correct?
Solution
We can clearly see that option A and B are false. Also after adding we can verify that IT business in training during 1994- 1999 was higher than the total IT business in maintenance during the same period.
IT Training = 107+143+185+263+302 =1000
IT Maintainence = 142+172+182+221+236 = 953
Hence option C.
Additional instructions:
For any activity A, year X dominates years Y if IT business in activity A, in the year X, is greater than the IT business, in activity A, in the year Y. For any two IT business activities, A & B, year X dominates year Y if:
a) The IT business in activity A, in the year X, is greater than or equal to the IT business, in activity A in the year Y,
b) The IT business in activity B, in the year X, is greater than or equal to the IT business in activity B in the year Y and
c) There should be strict inequality in the case of at least one activity.
For the IT hardware business activity, which one of the following is not true?
Solution
IT business hardware activity in
1995-96 = 1037+35 = 1072
1996-97 = 1050+286 = 1336
1997-98 = 1205+201 = 1406
1998-99 = 1026+4 = 1030
We clearly see from the table that for IT hardware business activity 1996-97 dominates 1998-99. Hence option D is false.

Additional instructions:
For any activity A, year X dominates years Y if IT business in activity A, in the year X, is greater than the IT business, in activity A, in the year Y. For any two IT business activities, A & B, year X dominates year Y if:
a) The IT business in activity A, in the year X, is greater than or equal to the IT business, in activity A in the year Y,
b) The IT business in activity B, in the year X, is greater than or equal to the IT business in activity B in the year Y and
c) There should be strict inequality in the case of at least one activity.
For the two IT business activities, hardware and peripherals, which one of the following is true?
Solution
Hardware in 96-97 = 1050 + 286 = 1336
Hardware in 95-96 = 1037 + 35 = 1072
Peripherals in 96-97 = 195
Peripherals in 95-96 = 202
So, hardware dominates in 96-97 compared to 95-96 but the same is not true for peripherals. Thus, 96-97 cannot be said to dominate 95-96. Thus, A is not true.
The same is the case for options B and C. Thus, D is the right choice.
For the following questions answer them individually
Consider three real numbers, X, Y, and Z. Is Z the smallest of these numbers?
A. X is greater than at least one of Y and Z.
B. Y is greater than at least one of X and Z.
Solution
If we consider statemnet A. X is greater than at least one of Y and Z. Here X>Z or X>Y, both are possible.
By statement b. Y is greater than at least one of X and Z. Here Y>X or Y>Z.
If we consider bith the statements together then X>Y>Z or X,Y>Z.
In both cases Z is the smallest.
Let X be a real number. Is the modulus of X necessarily less than 3?
A. X(X+3)<0
B. X(X-3)>0
Solution
Considering statement A, X(X+3)<0 . Here values of x which satisfy are X=-2 , -1 .
Considering statement B, X(X-3)>0 . Here values of x which satisfy are X = ..,-2,-1,4,5,6,... So using only statement 1 we know that uniquely modulus of x has to be less than 3. Hence, the question can be answered by one of the statements alone, but cannot be answered by using the other statement alone.

Directions for the next 5 questions: Answer these questions based on the data provided in the table below: Factory Sector by Type of Ownership. All figures in the table are in percent of the total for the corresponding column.
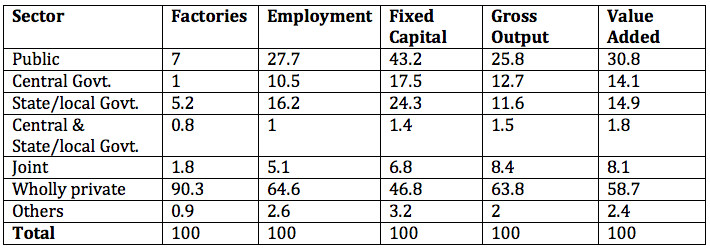
Suppose the average employment level is 60 per factory. The average employment in wholly private” factories is approximately:
Solution
If the total number of factories is 100, then the total number of employees = 60 × 100 = 6000 of which 64.6% = 3876 work in wholly private factories. Since the number of wholly private factories = 90.3, So we have 3876/90.3 = 43. hence option A.
Among the firms in different sectors, value added per employee is highest in:
Solution
Value added per employee = Value added / Employment . So we can see that Central and State/local governments have highest Value added per employee = 1.8/1 = 1.8
Capital productivity is defined as the gross output value per rupee of fixed capital. The three sectors with the higher capital productivity, arranged in descending order are:
Solution
We know that Compound productivity = Gross output / Fixed capital .So compound productivity for Public sector = 0.6, Central Government = 0.725, States/Local = 0.47, Central/States/Local = 1.07, Joint sector = 1.23 and wholly private = 1.36. Hence required is Wholly private, joint, central and state/local.

A sector is considered ‘pareto efficient’ if its value added per employee and its value added per rupee of fixed capital is higher than those of all other sectors. Based on the table data, the pareto efficient sector is:
Solution
We can find Value added/employment and value added/fixed capital for the different sectors. We get values as Wholly private 0.9 and 1.25; Joint sector 1.59 and 1.19; Central/State/Local 1.8, 1.28; others 0.92 and 0.75. Hence option C.
The total value added in all sectors is estimated at Rs. 14,000 crores. Suppose that the number of firms in the joint sector is 2700. The average value added per factory, in Rs. crores, in the central govt. is:
Solution
We know that number of factories in joint sector is 1.8% = 2700, so number of factories in Central Government = 1% of (2700 x 100/1.8) = 1500.
Value added by Central Government = 14.1% of 14,000= Rs. 1974 crores.
So we get = (1974 crores)/( 1500) = Rs. 1.32 crore
Directions for the next 4 questions: Answer these questions based on the data presented in the figure below. FEI for a country in a year, is the ratio (expressed as a percentage) of its foreign equity inflows to its GDP. The following figure displays the FEIs for select Asian countries for the years 1997 and 1998.
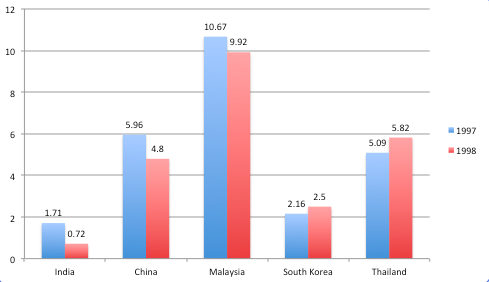
The country with the highest percentage change in FEI in 1998 relative to its FEI in 1997, is:
Solution
From the given data we can clearly notice that FEI for India decreased (changed) by greatest percentage.
For India the value = (1.71-0.72)/1.71 = 57.894%

Based on the data provided, it can be concluded that
Solution
We cant find absolute value of FEI as GDP value is not given . Hence option D.
It is known that China’s GDP in 1998 was 7% higher than its value in 1997, while India’s GDP drew by 2% during the same period. The GDP of South Korea, on the other hand, fell by 5%.
Which of the following statements is/are true?
-
Foreign equity inflows to China were higher in 1998 than in 1997.
-
Foreign equity inflows to China were lower in 1998 than in 1997.
-
Foreign equity inflows to India were higher in 1998 than in 1997.
-
Foreign equity inflows to South Korea decreased in 1998 relative to 1997.
-
Foreign equity inflows to South Korea increased in 1998 relative to 1997,
Solution
The given values in the graph are ratio of FEI to GDP un %. So if entire value increase we can conculde that there can be increase in numerator and decrease in value of denominator and if entire value decrease we can conculde that there can be decrease in numerator and increase in value of denominator. hence only options 2 and 5 comply to these .
China’s foreign equity inflows in 1998 were 10 times that into India. It can be concluded that:
Solution
Let the GDP of china and India be c and i respectively. According to given condition . We know that (Foreign inflows)china = 10*(Foreign inflows)India. And Foreign inflows = FEI * GDP . So we get , 4.8 * c = 10*0.72*i ; which is c=1.5*i . Hence , China’s GDP in 1998 was 50% higher than that of India.

Directions for the next 4 questions: Answer these questions based on the table below:
The table shows trends in external transactions of Indian corporate sector during the period 1993-94 to 1997-98. In addition, following definitions hold good:
Sales, Imports, and Exports, respectively denote the sales, imports and exports in year i.
Deficit in year I, Deficit1 = Imports - Exports
Deficit Intensity in year I, DI = Deficit/Sales Growth rate of deficit intensity in year I, GDI = $$\frac{DI_i - DI_{i-1}}{DI_{i-1}}$$
Further, note that all imports are classified as either raw material or capital goods.
Trends in External Transactions of Indian Corporate Sector (All figures in %)
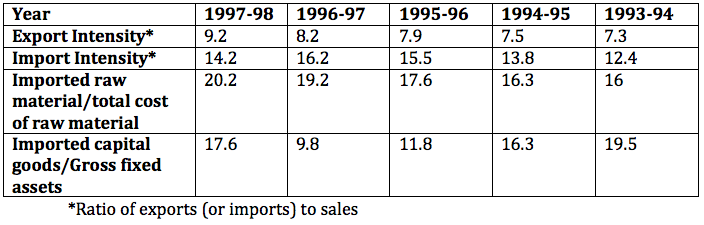
The highest growth rate in deficit intensity was recorded in:
Solution
We know that growth rate in deficit intensity can be calculated as GDIi = (DIi — DI(i-1))/DI(i-1) , so in year 1994-95 we have GDI = (6.3-5.1)/5.1 = max out of all others .Hence option A.
The value of the highest growth rate in deficit intensity is approximately:
Solution
We know that highest growth rate in deficit intensity was in the year 94-95 which is equal to 1.2*100/5.1 = 23.5% . hence option D.
In 1997-98 the total cost of raw materials is estimated as 50% of sales of that year. The turn over of Gross fixed assets, defined as the ratio of sales to Gross fixed assets, in 1997-98 is, approximately;
Solution
We know that Import / slaes = 14.2 and total import = 20.2*cost of raw material + 17.6 * gross fixed assets = 20.2*0.5*sales +17.6*GFA = 14.2* sales . Solving this we get 17.6 * GFA = 4.1 * sales . So required value is 17.6/4.1 = 4.3 . Hence option B .

Which of the following statements can be inferred to be true from the given data?
Solution
We can't say anything regarding exports and imports as the value given is export intensity and import intensity . Also statement C is clearly false. And we can infer option D easily from the table.
Answer these questions based on the data given below: The figures below present annual growth rate, expressed as the % change relative to the previous year, in four sectors of the economy of the Republic of Reposia during the 9 year period from 1990 to 1998. Assume that the index of production for each of the four sectors is set at 100 in 1989 Further, the four sectors: manufacturing, mining and quarrying, electricity, and chemicals, respectively, constituted 20%, 15%, 10%, 15 % of total industrial production 1989.

Which is the sector with the highest growth during the period 1989 and 1998?
Solution
From the graph it is clearly visible that Electricity had the highest growth during the period 1989 and 1998. Hence option C.
The overall growth rate in 1991 of the four sectors together is approximately:
Solution
Assume total base to be 100 (index = 100).
Contribution of manufacturing sector = 20% = 20 (in 1989).
In 1990, it has grown by 9%.
=> Contribution in 1990 = 1.09*20 = 20 + 1.8 = 21.8.
Hence, the growth of manufacturing sector in 1990 is 21.8 . Similarly for other sectors the growth rates fpr mining 15.6 , electricity 10.9 and chemicals is 16.2 . So total overall groth is 64.5 %. </br>
Growth of manufacturing sector in 199 is 21.8 - 0.01*21.8 = 21.6 . Similarly for other sectors the growth rates fpr mining 15.7 , electricity 11.88 and chemicals is 16.36 . So total overall groth is 65.54 %. Hence the growth rate change in 1991 is (65.54-64.5) / 64.5 = 1.5%.
Hence option D.

When was the highest level of production in the manufacturing sector achieved during the nine-year period 1990-98?
Solution
After 1991 each year there is a positive growth rate change for manufacturing sector. Hence highest level of production would be in the year 1998.
When was the lowest level of production of the mining and quarrying sector achieved during the nine year period 1990-1998?
Solution
Production rate in 1990 = 15.6 ; Production rate in 1991 = 15.7 ; Production rate in 1992 = 15.85 ; Production rate in 1993 = 15.46. So clearly we can see that production rate would be lowest in the year 1993. Hence option B.
The percentage increase of production in-the four sectors, namely, manufacturing, mining & quarrying, electricity and chemicals, taken together, in 1994, relative to 1989, is approximately:
Solution
Let first approximately calculate production in-the four sectors, manufacturing, mining & quarrying, electricity and chemicals in 1994 we get , 25.4 , 18 , 14.55 , 18.85 respectively . Hence overall growth = 76.8. Now The percentage increase of production in-the four sectors, taken together, in 1994, relative to 1989, is approximately = (76.8-60)/60 which is approx. 25 %. Hence option A.

It is known that the index of total industrial production in 1994 was 50 percent more that in 1989. Then, the percentage increase in production between 1989 and 1994 in sectors other than the four listed above is:
Solution
Since in 94 total production was 50% more than 89 , so total production = 150. Also we know that total production in given 4 sectors in 94 = 76.8. Hence other than the 4 sectors total production is 150 - 76.8 = 73.2 . Hence the percentage increase in production between 1989 and 1994 in sectors other than the four listed above is: (73.2-40) / 40 is approx 87.5% . Hence option B.
Answer these questions based on the following Information:
ABC Ltd. produces widgets for which the demand is unlimited and they can sell all of their production. The graph below describes the monthly variable costs incurred by the company as a function of the quantity produced. In addition, operating the plant for one shift results in a fixed monthly cost of Rs. 800. Fixed monthly costs for second shift operation are estimated at Rs. 1200. Each shift operation provides capacity for producing 30 widgets per month.
Note: Average unit cost, AC = Total monthly costs/monthly production, and Marginal cost MC is the rate of change in total cost for unit change in quantity produced.
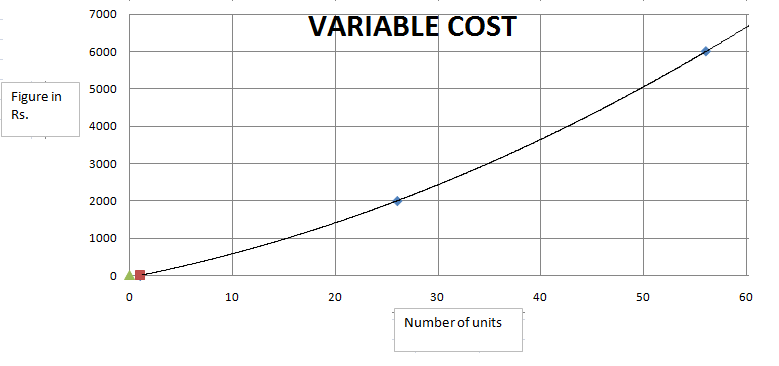
Total production in July is 40 units. What is the approximate average unit cost for July?
Solution
For 40 units total fixed costs would be 1200 + 800 = 2000 and variable cost = 3700 . So total cost = 5700 (approx). Hence approximate average unit cost for July = 5700 / 40 = 142.5 . Hence option C is the correct answer.
ABC Ltd. is considering increasing the production level. What is the approximate marginal cost of increasing production from its July level of 40 units.
Solution
We know that MC is the rate of change in total cost for unit change in quantity produced. SO for 40 units total cost = 2000+3700 = 5700 and for 50 units = 2000 + 5000 = 7000. So for additional 10 units change in total costs is 1300 . So for 1 unit we have MC = 130.

From the data provided it can be inferred that, for production levels in the range of 0 to 60 units,
Solution
As the graph is an increasing function, MC will always increase for increase in number of units.
Suppose that each widget sells for Rs. 150. What is the profit earned by ABC Ltd. in July, if it is know that 40 widgets were produced in this month? (Profit is defined as the excess of sales revenue over total cost).
Solution
Total sales = 150 * 40 = 6000. Total costs = 2000 + 3650(approx).= 5600 to 5700 .Hence , profit = 6000 - 5600 = 400 (approx). Hence option C.
Assume that the unit price is Rs. 150 and profit is defined as the excess of sales revenue over total costs. What is the monthly production level of ABC Ltd. at which the profit is highest?
Solution
As adding a shift dramatically increases the costs, we need to consider the two regions, 0<x<=30 and 30<x<=60, separately.
Region 1: As variable cost is less than equal to 100, and sales price is 150, profit would be max when production is maximum possible i.e. at 30 units.
Hence, at 30 units, total cost = 800 + 2400 = 3200. Sales = 30 * 150 = 4500. Profit = 4500-3200 = 1300
Region 2: As variable cost is less than equal to 100, and sales price is 150, profit would be max when production is maximum possible i.e. at 60 units
Hence, at 60 units, total cost = 800 + 1200 + 6500 = 8500. Sales = 150*60 = 9000. Hence, Profit = 9000 - 8500 = 500
Hence, profit is maximum at 30 units.

For monthly production level in the range of 30 to 60 Units,
Solution
When we take some value and check for the variation , we find that actual variation is opposite to that of option C.
Upto a certain level, AC is greater than MC and then AC is less than MC.
For producing 31 units, the average cost is 1200 + 800 + 2400 = Rs. 4400.
Average cost = 4400/31 = Rs.142 (Approx).
Let us calculate the marginal cost at this point.
As the number of units increases from 31 to 40, the variable cost increases from Rs.2400 to Rs.3700.
Marginal cost = (3700-2400)/10 = 1300/10 = Rs.130.
MC < AC for 31 units.
Let us calculate MC and AC for 60 units.
Average cost = (2000 + 6800)/60 = 8800/60 = Rs.146.66
As the number of units increases from 50 to 60, the variable cost increases from Rs.5000 to Rs.6800.
Marginal cost = Rs.1800/10 = Rs.180
MC > AC for 60 units.
As we can see, the trend is the inverse of what is mentioned in option C. Since none of the options capture the trend precisely, option D is the right answer.
For the following questions answer them individually
In a recent report, the gross enrolment ratios at the primary level, that is, the number of children enrolled in classes one to five as a proportion of all children aged 6 to 10, were shown to be very high for most states; in many cases they were way above 100 percent! These figures are not worth anything, since they are based on the official enrolment data compiled from school records. They might as well stand for ‘gross exaggeration ratios’.
Which of the following options best supports the claim that the ratios are exaggerated?
Solution
Let’s comprehend the given information first. The ratio of the number of children from classes one to five to all children aged 6 to 10 is very high, often greater than 1. This is the premise. The author says that it is not a valid report as the data is based on official enrolment data compiled from school records and therefore is exaggerated. This is the conclusion.
Here, the assumption is that the enrolment data in school records is often not correct. In order to strengthen the argument, we need to bolster the assumption.
Now, let’s check each option to determine the option that strengthens the assumption.
The first option is the definition of gross enrolment ratio. This statement gives the reason for the high gross enrolment ratios. Hence it is strengthening the premise and weakening the conclusion. Therefore, option A is wrong.
The passage does not talk about the attendance of the students and also attendance is not related to the gross enrolment ratio. Option B does not strengthen the argument. Hence, option B is wrong.
Option C says that 22 percent of the children who do not belong to the age group 6-10 and who have not started going to school but have enrolled in class one are included in the numerator of the ratio. This explains why the ratio is high. Also, the ratio is clearly exaggerated as the students have not started going to school yet. Therefore, option C is the answer as it explains why the ratios are exaggerated.
The decline in the number of children in the age group 6 - 10 has nothing to do with the gross enrolment ratio. Hence, option D is wrong.
Therefore, the answer is option C.
Szymanski suggests that the problem of racism in football may be present even today. He begins by verifying an earlier hypothesis that clubs’ wage bills explain 90% of their performance. Thus, if players’ salaries were to be only based on their abilities, clubs that spend more should finish higher. If there is pay discrimination against some group of players — fewer teams bidding for black players thus lowering the salaries for blacks with the same ability as whites — that neat relation may no longer hold. He concludes that certain clubs seem to have achieved much less than what they could have, by not recruiting black players.
Which of the following findings would best support Szymanski conclusions?
Solution
It is given that 90 percent of a club’s performance can be explained by wage bills. If a player’s salary is based on only on their abilities then the clubs that paid more amounts must finish higher. This relation will not hold true if there is pay discrimination. The conclusion of the passage is that certain clubs seem to have achieved less than they could have, by not recruiting black players.
Here, the assumption is that certain clubs paid more than many other clubs but did not finish at a position they could have had.
Now, let’s check each option and verify whether it strengthens Szymanski’s conclusions.
Option A is not relevant here because it does not address our assumption in any way. Hence, option A is wrong.
The clubs that the author is talking about could have chosen a few black players, paid the black players lower wages and achieved as much as they did now. So, if it is a fact that clubs hired white players at relatively high wages and did not show proportionately good performance, then we can conclude that these clubs achieved less than they could have had. Hence, option B is correct.
According to option C, the towns have a history of discrimination against blacks. But, the clubs might or might not show the discrimination. Hence, the underperformance of these clubs cannot strengthen Szymanski’s conclusions. Therefore, option C is wrong.
Option D is a fact which can be deduced from the information given in the passage. Hence, it doesn’t strengthen the conclusion.
Therefore, option B is the correct answer.

The pressure on Italy’s 257 jails has been increasing rapidly. These jails are old and overcrowded. They are supposed to hold up to 43,000 people -9,000 fewer than now. San Vittore in Milan, which has 1,800 inmates, is designed for 800. The number of foreigners inside jails has also been increasing. The minister in charge of prisons fears that tensions may snap, and so has recommended to the government an amnesty policy.
Which one of the following, if true, would have most influenced the recommendation of the minister?
Solution
The reason for the minister to advance his new recommendation is most likely because of an incident or incidents which might have occurred in the prisons due to snapping of tensions among the prisoners. This reason is best captured in option d), which says that disturbances have been reported in 58 prisons.
The offer of the government to make iodised salt available at a low price of one rupee per kilo is welcome, especially since the government seems to be so concerned about the ill effects of non-iodised salt. But it is doubtful whether the offer will actually be implemented. Way back in 1994, the government, in an earlier effort, had prepared reports outlining three new and simple but experimental methods for reducing the costs of iodisation to about five paise per kilo. But these reports have remained just those — reports on paper.
Which one of the following, if true, most weakens the author’s contention that it is doubtful whether the offer will be actually implemented?
Solution
If there is evidence that the earlier proposal had been put into practice and not just remained a proposal on paper, then the contention of the author that the new proposal will also remain a proposal on paper is weakened. This is captured by the statement in option c), which says that many small-scale and joint-sector units have completed trials to use the three iodisation methods for regular production. This weakens the author's contention.
About 96% of Scandinavian moths have ears tuned to the ultrasonic pulses that bats, their predators, emit. But the remaining 4% do not have ears and are deaf. However, they have a larger wingspan than the hearing moths, and also have higher wing-loadings the ratio between a wing’s area and its weight — meaning higher maneuverability.
Which one of the following can be best inferred from the above passage?
Solution
The deaf moths have all the abilities for better maneuverability - for frequent changes in flight direction. So, deaf moths may try to avoid their predators by frequently changing their flight patterns. Option b) is the correct inference.

Argentina’s beef cattle herd has dropped to under 50 million from 57 million ten years ago in 1990. The animals are worth less, too: prices fell by over a third last year, before recovering, slightly. Most local meat packers and processors are in financial trouble, and recent years have seen a string of plant closures. The Beef Producers’ Association has now come up with a massive advertisement campaign calling upon Argentines to eat more beef—their “juicy, healthy, rotund, plate- filling” steaks.
Which one of the following, if true, would contribute most to a failure of the campaign?
Solution
The campaign can fail badly if the Association is not able to convince the target audience to consume more beef. This can happen if the consumers have changed their lifestyle and prefer eating leaner meats. So, a) is the best reason why the campaign might fail.
The problem of traffic congestion in Athens has been testing the ingenuity of politicians and town planners for years. But the measures adopted to date have not succeeded in decreasing the number of cars en the roads in the city centre. In 1980, an odds and evens number- plate legislation was introduced, under which odd and even plates were banned in the city centre on alternate days, thereby expecting to halve the number of cars in the city centre. Then in 1993 it was decreed that all cars in use in the city centre must be fitted with catalytic converters; a regulation had just then been introduced, substantially reducing import taxes on cars with catalytic converters, the only condition being that the buyer of such a ‘clean’ car offered for destruction a car at least 15 years old.
Which one of the following options, if true, would best support the claim that the measures adopted to date have not succeeded?
Solution
According to the given information, all the three options a), b) and c) have led to an increase in the number of cars in the city.
So, the government's attempts at reducing the number of cars in the city have not succeeded.
Therefore, the answer is d) all the above.
Although in the limited sense of freedom regarding appointments and internal working, the independence of the Central Bank is unequivocally ensured, the same cannot be said of its right to pursue monetary policy without co-ordination with the central government. The role of the Central Bank has turned out to be subordinate and advisory in nature.
Which of the following best supports the conclusion drawn in the passage?
Solution
Among all the options, the only statement where there is a clash between the ideology of the Central Bank and the ideology of the Government is option b), the Government resorting to monetisation despite the reservations of the Central Bank. Hence, option b) is the answer.

The Shveta-chattra or the “White Umbrella” was a symbol of sovereign political authority placed over the monarchy’s head at the time of the coronation. The ruler so inaugurated was regarded not as a temporal autocrat but as the instrument of protective and sheltering firmament of supreme law. The white umbrella symbol is of great antiquity and its varied use illustrates the ultimate common basis of non-theocratic nature of states in the Indian tradition. As such, the umbrella is found, although not necessarily a white one, over the head of Lord Ram, the Mohammedan sultans and Chatrapati Shivaji.
Which one of the following best summarises the above passage?
Solution
Sentences in options a) and c) do not capture the full essence of the paragraph. In b) it is said that the umbrella is the instrument of the supreme law, whereas, according to the paragraph, the ruler is the instrument of the supreme law. So, b) is also wrong. The best summary is the one in option d).
The theory of games is suggested to some extent by parlour games such as chess and bridge. Friedman illustrates two distinct features of these games. First, in a parlour game played for money, if one wins the other (others) loses (lose). Second, these games are games involving a strategy. In a game of chess, while choosing what action is to be taken, a player tries to guess how his/her opponent will react to the various actions he or she might take. In contrast, the card-pastime, ‘patience’ or ‘solitaire’ is played only against chance.
Which one of the following can best be described as a “game”?
Solution
According to the passage, one opponent must lose in a game. In option A, no one loses.
Option D is irrelevant.
Option B does not involve strategies.
Only option C fits to be the answer.
Persons X, Y, Z and Q live in red, green, yellow or blue coloured houses placed in a sequence on a street. Z lives in a yellow house. The green house is adjacent to the blue house. X does not live adjacent to Z. The yellow house is the only house in between the green and red houses. The colour of the house X lives in is:
Solution
According to given condition the correct sequence of houses is 1st is blue, 2nd green, 3rd is yellow and last red.
Now in the yellow house i.e. 3rd Z lives and X doesnt live as a neighbour i.e. Green and Red house.
So, X lives in blue house.
My bag can carry no more than ten books, I must carry at least one book each of management, mathematics, physics and fiction. Also, for every management book I carry I must carry two or more fiction books, and for every mathematics book I carry I must carry two or more physics books. I earn 4, 3, 2 and 1 points for each management, mathematics, physics and fiction book, respectively, I carry in my bag. I want to maximise the points I can earn by carrying the most appropriate combination of books in my bag. The maximum points that I can earn are:
Solution
The points would be maximum when the person carries 1 management, 2 fiction, 2 maths and 5 physics book.
Hence total points 4+2+6+10 = 22.
Hence option c.
Five persons with names P, M, U, T and X live separately in any one of the following: a palace, a hut, a fort, a house or a hotel. Each one likes two different colours from among the following: blue, black, red, yellow and green. U likes red and blue. T likes black. The person living in a palace does not like black or blue. P likes blue and red. M likes yellow. X lives in a hotel. M lives in a:
Solution
According to given condition we know that P likes Blue and red , M likes yellow , U likes Red and blue , T likes Black and x lives in a hotel . Since the person in palace doesnt like blue or black. Only 1 such person is possible i.e. M
There are ten animals — two each of lions, panthers, bison, bears, and deer — in a zoo. The enclosures in the zoo are named X, Y, Z, P and Q and each enclosure is allotted to one of the following attendants: Jack, Mohan, Shalini, Suman and Rita. Two animals of different species are housed in each enclosure. A lion and a deer cannot be together. A panther cannot be with either a deer or a bison. Suman attends to animals from among bison, deer , bear and panther only. Mohan attends to a lion and a panther. Jack does not attend to deer, lion or bison. X, Y and Z are allotted to Mohan, Jack and Rita respectively. X and Q enclosures have one animal of the same species. Z and P have the same pair of animals. The animals attended by Shalini are:
Solution
Correct arrange ment would be

Hence option C.

Eighty kilograms (kg) of store material is to be transported to a location 10 km away. Any number of couriers can be used to transport the material. The material can be packed in any number of units of 10,20 or 40kg. Couriers charges are Rs. 10 per hour. Couriers travel at the speed of 5 km/hr if carrying 10kg, at 2 km/hr if carrying 20kg and at 1 km/hr if carrying 40 kg. A courier cannot carry more than 40 kg of load. The minimum cost at which 80kg of store material can be transported to its distinction will be:
Solution
According to given conditions , for 10 kg it will take 2 hrs/10kg and total cost for 80 kg to be 160rs . for 20 kg it will take 5 hrs/20kg and total cost for 80 kg to be 200rs , for 40 kg it will take 10 hrs/40kg and total cost for 80 kg to be 200rs. So the cheapest is 160 rs.
How many people are watching TV programme P?
A. Number of people watching TV programme Q is 1000 and number of people watching both the programmes, P and Q, is 100.
B. Number of people watching either P or Q or both is 1500.
Solution
Considering 1st statement we know that number of people watching Q alone is 900 and both P and Q is 100. But we cant find the number of people watching P. Also, using statement B alone, we cannot find the number of people watching P. But if we consider B along with A , we can definately get total no. of people watching P . Hence, the question can be answered by using both the statements together, but cannot be answered by using either statement alone.
Ghosh Babu has decided to take a non-stop flight from Mumbai to No-man’s-land in South America. He is scheduled to leave Mumbai at 5 am, Indian Standard Time on December 10, 2000. What is the local time at No-man's-land when he reaches there?
A. The average speed of the plane is 700 kilometres per hour.
B. The flight distance is 10,500 kilometres.
Solution
Mumbai and No-man’s-land would be in different time zones. Using both the statements together we would just know the time mumbai local time when ghosh babu reaches at island. Hence, the question cannot be answered even by using both statements together.

What are the ages of two individuals, X and Y?
A. The age difference between them is 6 years.
B. The product of their ages is divisible by 6.
Solution
According to statement A, |X - Y| = 6
According to statement B, XY = 6k
we have 2 equations and 3 variables, which cannot be solved => Cannot be answered using both the statements.
The current debate on intellectual property rights (IPRs) raises a number of important issues concerning the strategy and policies for building a more dynamic national agricultural research system, the relative roles of public and private sectors, and the role of agribusiness multinational corporations (MNCs). This debate has been stimulated by the international agreement on Trade Related Intellectual Property Rights (TRIPs), negotiated as part of the Uruguay Round. TRIPs, for the first time, seeks to bring innovations in agricultural technology under a new worldwide IPR regime. The agribusiness MNCs (along with pharmaceutical companies) played a leading part in lobbying for such a regime during the Uruguay Round negotiations. The argument was that incentives are necessary to stimulate innovations, and that this calls for a system of patents which gives innovators the sole right to use (or sell/lease the right to use) their innovations for a specified period and protects them against unauthorised copying or use. With strong support of their national governments, they were influential in shaping the agreement on TRIPs, which eventually emerged from the Uruguay Round.
The current debate on TRIPs in India - as indeed elsewhere - echoes wider concerns about ‘privatisation’ of research and allowing a free field for MNCs in the sphere of biotechnology and agriculture. The agribusiness corporations, and those with unbounded faith in the power of science to overcome all likely problems, point to the vast potential that new technology holds for solving the problems of hunger, malnutrition and poverty in the world. The exploitation of this potential should be encouraged and this is best done by the private sector for which patents are essential. Some, who do not necessarily accept this optimism, argue that fears of MNC domination are exaggerated and that farmers will accept their products only if they decisively outperform the available alternatives. Those who argue against agreeing to introduce an IPR regime in agriculture and encouraging private sector research are apprehensive that this will work to the disadvantage of farmers by making them more and more dependent on monopolistic MNCs. A different, though related apprehension is that extensive use of hybrids and genetically engineered new varieties might increase the vulnerability of agriculture to outbreaks of pests and diseases. The larger, longer-term consequences of reduced biodiversity that may follow from the use of specially bred varieties are also another cause for concern. Moreover, corporations, driven by the profit motive, will necessarily tend to underplay, if not ignore, potential adverse consequences, especially those which are unknown and which may manifest themselves only over a relatively long period. On the other hand, high-pressure advertising and aggressive sales campaigns by private companies can seduce farmers into accepting varieties without being aware of potential adverse effects and the possibility of disastrous consequences for their livelihood if these varieties happen to fail. There is no provision under the laws, as they now exist, for compensating users against such eventualities.
Excessive preoccupation with seeds and seed material has obscured other important issues involved in reviewing the research policy. We need to remind ourselves that improved varieties by themselves are not sufficient for sustained growth of yields. in our own experience, some of the early high yielding varieties (HYVs) of rice and wheat were found susceptible to widespread pest attacks; and some had problems of grain quality. Further research was necessary to solve these problems. This largely successful research was almost entirely done in public research institutions. Of course, it could in principle have been done by private companies, but whether they choose to do so depends crucially on the extent of the loss in market for their original introductions on account of the above factors and whether the companies are financially strong enough to absorb the ‘losses’, invest in research to correct the deficiencies and recover the lost market. Public research, which is not driven by profit, is better placed to take corrective action. Research for improving common pool resource management, maintaining ecological health and ensuring sustainability is both critical and also demanding in terms of technological challenge and resource requirements. As such research is crucial to the impact of new varieties, chemicals and equipment in the farmer’s field, private companies should be interested in such research. But their primary interest is in the sale of seed materials, chemicals, equipment and other inputs produced by them. Knowledge and techniques for resource management are not ‘marketable’ in the same way as those inputs. Their application to land, water and forests has a long gestation and their efficacy depends on resolving difficult problems such as designing institutions for proper and equitable management of common pool resources. Public or quasi-public research institutions informed by broader, long-term concerns can only do such work.
The public sector must therefore continue to play a major role in the national research system. It is both wrong and misleading to pose the problem in terms of public sector versus private sector or of privatisation of research. We need to address problems likely to arise on account of the public-private sector complementarity, and ensure that the public research system performs efficiently. Complementarity between various elements of research raises several issues in implementing an IPR regime. Private companies do not produce new varieties and inputs entirely as a result of their own research. Almost all technological improvement is based on knowledge and experience accumulated from the past, and the results of basic and applied research in public and quasi-public institutions (universities, research organisations). Moreover, as is increasingly recognised, accumulated stock of knowledge does not reside only in the scientific community and its academic publications, but is also widely diffused in traditions and folk knowledge of local communities all over.
The deciphering of the structure and functioning of DNA forms the basis of much of modern biotechnology. But this fundamental breakthrough is a ‘public good’ freely accessible in the public domain and usable free of any charge. Various techniques developed using that knowledge can however be, and are, patented for private profit. Similarly, private corporations draw extensively, and without any charge, on germplasm available in varieties of plants species (neem and turmeric are by now famous examples). Publicly funded gene banks as well as new varieties bred by public sector research stations can also be used freely by private enterprises for developing their own varieties and seek patent protection for them. Should private breeders be allowed free use of basic scientific discoveries? Should the repositories of traditional knowledge and germplasm be collected which are maintained and improved by publicly funded organisations? Or should users be made to pay for such use? If they are to pay, what should be the basis of compensation? Should the compensation be for individuals or (or communities/institutions to which they belong? Should individual institutions be given the right of patenting their innovations? These are some of the important issues that deserve more attention than they now get and need serious detailed study to evolve reasonably satisfactory, fair and workable solutions. Finally, the tendency to equate the public sector with the government is wrong. The public space is much wider than government departments and includes co- operatives, universities, public trusts and a variety of non-governmental organisations (NGOs). Giving greater autonomy to research organisations from government control and giving non- government public institutions the space and resources to play a larger, more effective role in research, is therefore an issue of direct relevance in restructuring the public research system.
Which one of the following statements describes an important issue, or important issues, not being raised in the context of the current debate on IPRs?
Solution
Refer to the lines of the para "The current debate on TRIPs in India-as indeed elsewhere-echoes wider concerns about ‘privatisation’ of research and allowing a free field for MNCs in the sphere of biotechnology and agriculture." Hence, a and d have been given as issues that have been raised. Also, in the first paragraph it is given that "The current debate on intellectual property rights (IPRs) raises a number of important issues concerning the strategy and policies for building a more dynamic national agricultural research system, the relative roles of public and private sectors". Hence, option C has also been given in the passage.
The author says that important issues regarding some the IPR regime have not been discussed - like the complimentarity between various elements of research between the private and public sector, the use of knowledge developed by publicly-funded research organisations to develop patented products etc. Hence, the author believes that important issues regarding the strategy and policies for implementation of IPR regime in Indian agriculture have not been discussed. Hence, option B.
The fundamental breakthrough in. deciphering the structure and functioning of DNA has become a public good. This means that:
Solution
Refer to the gven lines "The deciphering of the structure and functioning of DNA forms the basis of much of modern biotechnology. But this fundamental breakthrough is a ‘public good’ freely accessible in the public domain and usable free of any charge."
This makes option A correct.

In debating the respective roles of the public and private sectors in the national research system, it is important to recognise:
Solution
Refer to the fourth para,especially to the lines "We need to address problems likely to arise on account of the public-private sector or of privatisation of research and need to ensure that the public research systems perform efficiently. Complementarity between various elements of research raises several issues in implementing an IPR regime."
Which one of the following may provide incentives to address the problem of potential adverse consequences of biotechnology?
Solution
Refer to the last lines of the 2nd para "On the other hand, high-pressure advertising and aggressive sales campaigns by private companies can seduce farmers into accepting varieties without being aware of potential adverse effects and the possibility of disastrous consequences for their livelihood if these varieties happen to fail. There is no provision under the laws, as they now exist, for compensating users against such eventualities."
Which of the following statements is not a likely consequence of emerging technologies in agriculture?
Solution
Refer to the lines in the 2nd para "The larger, longer-term consequences of reduced biodiversity that may follow from the use of specially bred varieties are also another cause for concern." which is just the opposite of what is stated in A.

The TRIPs agreement emerged from the Uruguay Round to:
Solution
Refer to the lines of the paragraph "The argument was that incentives are necessary to stimulate innovations, and that this calls for a system of patents which gives innovators the sole right to use (or sell/lease the right to use) their innovations for a specific period and protect them against unauthorised copying or use."
This makes option C correct
Public or quasi-pubic research institutions are more likely than private companies to address the negative consequences of new technologies, because of which of the following reasons?
Solution
Refer to the given lines "Public research, which is not driven by profit, is better placed to take corrective action. Research for improving common pool resource management, maintaining ecological health and ensuring sustainability is both critical and also demanding in terms of technological challenge and resource requirements. As such research is crucial to the impact of new varieties, chemicals and equipment in the farmer’s field, private companies should be interested in such research. But their primary interest is in the sale of seed material, chemicals, equipment and other inputs produced by them. Knowledge and techniques for resources management are not ‘marketable’ in the same way as those inputs. Their application to land, water and forests has a long gestation and their efficacy depends on resolving difficult problems such as designing institutions for proper and equitable management of common pool resources. Public or quasi-public research institutions informed by broader, long-term concerns can only do such work"
This covers all the options given in the paragraph.
While developing a strategy and policies for building a more dynamic national agricultural research system, which one of the following statements needs to be considered?
Solution
Refer to the lines of the para "Public or quasi-public research institutions informed by broader, long-term concerns can only do such work."
This makes B correct.
A and C are out of context of this question while D is just a fact and not a reason.
One of the criteria by which we judge the vitality of a style of painting is its ability to renew itself- its responsiveness to the changing nature and quality of experience, the degree of conceptual and formal innovation that it exhibits. By this criterion, it would appear that the practice of abstractionism has failed to engage creatively with the radical change in human experience in recent decades. it has, seemingly, been unwilling to re-invent itself in relation to the systems of artistic expression and viewers’ expectations that have developed under the impact of the mass media.
The judgement that abstractionism has slipped into ‘inertia gear’ is gaining endorsement, not only among discerning viewers and practitioners of other art forms, but also among abstract painters themselves. Like their companions elsewhere in the world, abstraction lists in India are asking themselves an overwhelming question today: Does abstractionism have a future? The major- crisis that abstractionists face is that of revitalising their picture surface; few have improvised any solutions beyond the ones that were exhausted by the I 970s. Like all revolutions, whether in politics or in art, abstractionism must now confront its moment of truth: having begun life as a new and radical pictorial approach to experience, it has become an entrenched orthodoxy itself. Indeed, when viewed against a historical situation in which a variety of subversive, interactive and richly hybrid forms are available to the art practitioner, abstractionism assumes the remote and defiant air of an aristocracy that has outlived its age; trammelled by formulaic conventions yet buttressed by a rhetoric of sacred mystery, it seems condemned to being the last citadel of the self-regarding ‘fine art’ tradition, the last hurrah of painting for painting’s sake.
The situation is further complicated in India by the circumstances in which an indigenous abstractionism came into prominence here during the 1960s. From the beginning it was propelled by the dialectic between two motives, one revolutionary and the other conservative-it was inaugurated as an act of emancipation from the dogmas of the nascent Indian nation state, when an’ was officially viewed as an indulgence at worst, and at best, as an instrument for the celebration of the republic’s hopes and aspirations. Having rejected these dogmas, the pioneering abstractionists also went on to reject the various figurative styles associated with the Santiniketan circle and others. In such a situation, abstractionism was a revolutionary move, It led art towards the exploration of the s 3onsc)ous mind, the spiritual quest and the possible expansion of consciousness. Indian painting entered into a phase of self-inquiry, a meditative inner space where cosmic symbols and non-representational images ruled. Often, the transition from figurative idioms to abstractionist ones took place within the same artist.
At the same time, Indian abstractionists have rarely committed themselves wholeheartedly to a nonrepresentational idiom. They have been preoccupied with the fundamentally metaphysical project of aspiring to the mystical- holy without altogether renouncing the symbolic) This has been sustained by a hereditary reluctance to give up the murti, the inviolable iconic form, which explains why abstractionism is marked by the conservative tendency to operate with images from the sacred repertoire of the past. Abstractionism thus entered India as a double-edged device in a complex cultural transaction. ideologically, it served as an internationalist legitimisation the emerging revolutionary local trends. However, on entry; it was conscripted to serve local artistic preoccupations a survey of indigenous abstractionism will show that its most obvious points of affinity with European and American abstract art were with the more mystically oriented of the major sources of abstractionist philosophy and practice, for instance the Kandinsky-Klee school. There have been no takers for Malevich’s Suprematism, which militantly rejected both the artistic forms of the past and the world of appearances, privileging the new- minted geometric symbol as an autonomous sign of the desire for infinity.
Against this backdrop, we can identify three major abstractionist idioms in Indian art. The first develops from a love of the earth, and assumes the form of a celebration of the self’s dissolution in the cosmic panorama; the landscape is no longer a realistic, transcription of the scene, but is transformed into a visionary occasion for contemplating the cycles of decay and regeneration. The second idiom phrases its departures from symbolic and archetypal devices as invitations to heightened planes of awareness. Abstractionism begins with the establishment or dissolution of the motif, which can be drawn from diverse sources, including the hieroglyphic tablet, the Sufi meditation dance or the Tantrie diagram. The third- idiom is based on the lyric play of forms guided by gesture or allied with formal improvisations like the assemblage. Here, sometimes, the line dividing abstract image from patterned design or quasi-random expressive marking may blur. The flux of forms can also be regimented through the poetics of pure colour arrangements, vector-diagrammatic spaces anti gestural design.
In this genealogy, some pure lines of descent follow their logic to the inevitable point of extinction, others engage in cross-fertilisation and yet others undergo mutation to maintain their energy. However, this genealogical survey demonstrates the wave at its crests, those points where the metaphysical and the painterly have been fused in images of abiding potency, ideas sensuously ordained rather than fabricated programmatically to a concept. It is equally possible to enumerate the troughs where the two principles do not come together, thus arriving at a very different account. Uncharitable as it may sound, the history of Indian abstractionism records a series of attempts to avoid the risks of abstraction by resorting to an overt and near-generic symbolism which many Indian abstractionists embrace when they find themselves bereft of the imaginative energy to negotiate the union of metaphysics and painterliness.
Such symbolism falls into a dual trap: it succumbs to the pompous vacuity of pure metaphysics when the burden of intention is passed off as justification; or then it is desiccated by the arid formalism of pure painterliness, with delight in the measure of chance or pattern guiding the execution of a painting. The ensuing conflict of purpose stalls the progress of abstractionism in an impasse. The remarkable Indian abstractionists are precisely those who have overcome this and addressed themselves to the basic elements of their art with a decisive sense of independence from prior models. In their recent work, we see the logic of Indian abstractionism pushed almost to the furthest it can be taken. Beyond such artists stands a lost generation of abstractionists whose work invokes a wistful, delicate beauty but stops there. Abstractionism is not a universal language; it is an art that points up the loss of a shared language of signs in society. And yet, it affirms the possibility of its recovery through the effort of awareness. While its rhetoric has always emphasised a call for new forms of attention, abstractionist practice has tended to fall into a complacent pride in its own incomprehensibility; a complacency fatal in an ethos where vibrant new idioms compete for the viewers’ attention. Indian abstractionists ought to really return to basics, to reformulate and replenish their understanding of the nature of the relationship between the painted image and the world around it. But will they abandon their favourite conceptual habits and formal conventions, if this becomes necessary?
Which one of the following is not stated by the author as a reason for abstractionism losing its vitality?
Solution
Refer to the last line of the 1st para where it is written "By this criterion, it would appear that the practice of abstractionism has failed to engage creatively with the radical change in human experience in recent decades. It has seemingly been unwilling to re-invent itself in relation to the systems of artistic expression and viewers expectations that have developed under the impact of the mass media."
This covers the option A,B and D while the option C is nowhere mentioned.
Which one of the following, according to the author, is the role that abstractionism plays in a society?
Solution
Refer to the lines of the last para " Abstractionism is not a universal language; it is an art that points up the loss of a shared language of signs in society. And yet, it affirms the possibility of its recover through the effort of awareness. "
It clearly implies B.
According to the author, which one of the following characterises the crisis faced by abstractionism?
Solution
The 2nd para clearly mentions all the reasons. So the 4th option is correct.
According to the author, the introduction of abstractionism was revolutionary because it:
Solution
Refer to the lines of the 3rd para "In such a situation, abstractionism was a revolutionary move. It led art towards the exploration of the subconscious mind, the spiritual quest and the possible expansion of consciousness. Indian painting entered into a phase of self-inquiry, meditative inner space where cosmic symbols and non-representational images ruled. Often, the transition from figurative idioms to abstractionist ones took place within the same artist."
This makes option B correct.
Which one of the following is not part of the author’s characterisation of the conservative trend in India abstractionism?
Solution
Refer to the 4th para "At the same time, Indian abstractionists have rarely committed themselves wholeheartedly to non-representational idiom. They have been preoccupied with the fundamentally metaphysical project of aspiring to the mystical holy without altogether renouncing the symbolic. This has been sustained by a hereditary reluctance to give up the murti, the inviolable iconic form, which explains why abstractionism thus entered India as a double-edged device in a complex cultural transaction."
This makes option A correct.Further option A is mentioned as a revolutionary idea in the last lines of the third para.
Given the author’s delineation of the three abstractionist idioms in Indian art, the third idiom can be best distinguished from the other two idioms through its:
Solution
Refer to the lines " The third idiom is based on the lyric play of forms guided by gesture or allied with formal improvisations like the assemblage. Here, sometimes, the line dividing abstract image from patterned design or quasi-random expressive marking may blur. The flux of forms can also be regimented through the policies of pure colour arrangements, vector-diagrammatic spaces and gestural design."
This makes option C correct
According to the author, the attraction of the Kandinsky-Klee school for Indian abtractionist can be explained by which one of the following?
Solution
Refer to the part of 2nd para "At the same time, Indian abstractionists have rarely committed themselves wholeheartedly to non-representational idiom. They have been preoccupied with the fundamentally metaphysical project of aspiring to the mystical holy without altogether renouncing the symbolic. This has been sustained by a hereditary reluctance to give up the murti, the inviolable iconic form, which explains why abstractionism thus entered India as a double-edged device in a complex cultural transaction. Ideologically it served as an internationalist legitimisation of the emerging revolutionary local trends. However, on entry, it was conscripted to serve local artistic preoccupations- a survey of indigenous abstractionism will show that its most obvious points of affinity with European and American abstract art were with the more mystically oriented of the major sources of abstractionist philosophy and practice, for instance, the Kandinsky Klee School. "
Which one of the following, according to the author, is the most important reason for the stalling of abstractionism’s progress in an impasse?
Solution
Refer to the last para "Such symbolism falls into a dual trap: it succumbs to the pompous vacuity of pure metaphysics when the burden of intention is passed off as justification; or then it is desiccated by the arid formalism of pure painterliness with delight in the measure of chance or pattern guiding the execution of a painting. The ensuing conflict of purpose stalls the progress of abstractionism in an impasse."
In a modern computer, electronic and magnetic storage technologies play complementary roles. Electronic memory chips are fast but volatile (their contents are lost when the computer is unplugged). Magnetic tapes and hard disks are slower, but have the advantage that they are non-volatile, so that they can be used to store software and documents even when the power is off.
In laboratories around the world, however, researchers are hoping to achieve the best of both worlds. They are trying to build magnetic memory chips that could be used in place of today’s electronics. These magnetic memories would be nonvolatile; but they would also he faster, would consume less power, and would be able to stand up to hazardous environments more easily. Such chips would have obvious applications in storage cards for digital cameras and music- players; they would enable handheld and laptop computers to boot up more quickly and to operate for longer; they would allow desktop computers to run faster; they would doubtless have military and space-faring advantages too. But although the theory behind them looks solid, there are tricky practical problems and need to be overcome.
Two different approaches, based on different magnetic phenomena, are being pursued. The first, being investigated by Gary Prinz and his colleagues at the Naval Research Laboratory (NRL) in Washington, D.c), exploits the fact that the electrical resistance of some materials changes in the presence of magnetic field— a phenomenon known as magneto- resistance. For some multi-layered materials this effect is particularly powerful and is, accordingly, called “giant” magneto-resistance (GMR). Since 1997, the exploitation of GMR has made cheap multi-gigabyte hard disks commonplace. The magnetic orientations of the magnetised spots on the surface of a spinning disk are detected by measuring the changes they induce in the resistance of a tiny sensor. This technique is so sensitive that it means the spots can be made smaller and packed closer together than was previously possible, thus increasing the capacity and reducing the size and cost of a disk drive. Dr. Prinz and his colleagues are now exploiting the same phenomenon on the surface of memory chips, rather spinning disks. In a conventional memory chip, each binary digit (bit) of data is represented using a capacitor-reservoir of electrical charge that is either empty or fill -to represent a zero or a one. In the NRL’s magnetic design, by contrast, each bit is stored in a magnetic element in the form of a vertical pillar of magnetisable material. A matrix of wires passing above and below the elements allows each to be magnetised, either clockwise or anti-clockwise, to represent zero or one. Another set of wires allows current to pass through any particular element. By measuring an element’s resistance you can determine its magnetic orientation, and hence whether it is storing a zero or a one. Since the elements retain their magnetic orientation even when the power is off, the result is non-volatile memory. Unlike the elements of an electronic memory, a magnetic memory’s elements are not easily disrupted by radiation. And compared with electronic memories, whose capacitors need constant topping up, magnetic memories are simpler and consume less power. The NRL researchers plan to commercialise their device through a company called Non-V olatile Electronics, which recently began work on the necessary processing and fabrication techniques. But it will be some years before the first chips roll off the production line.
Most attention in the field in focused on an alternative approach based on magnetic tunnel-junctions (MTJs), which are being investigated by researchers at chipmakers such as IBM, Motorola, Siemens and Hewlett-Packard. IBM’s research team, led by Stuart Parkin, has already created a 500-element working prototype that operates at 20 times the speed of conventional memory chips and consumes 1% of the power. Each element consists of a sandwich of two layers of magnetisable material separated by a barrier of aluminium oxide just four or five atoms thick. The polarisation of lower magnetisable layer is fixed in one direction, but that of the upper layer can be set (again, by passing a current through a matrix of control wires) either to the left or to the right, to store a zero or a one. The polarisations of the two layers are then either the same or opposite directions.
Although the aluminum-oxide barrier is an electrical insulator, it is so thin that electrons are able to jump across it via a quantum-mechanical effect called tunnelling. It turns out that such tunnelling is easier when the two magnetic layers are polarised in the same direction than when they are polarised in opposite directions. So, by measuring the current that flows through the sandwich, it is possible to determine the alignment of the topmost layer, and hence whether it is storing a zero or a one.
To build a full-scale memory chip based on MTJs is, however, no easy matter. According to Paulo Freitas, an expert on chip manufacturing at the Technical University of Lisbon, magnetic memory elements will have to become far smaller and more reliable than current prototypes if they are to compete with electronic memory. At the same time, they will have to be sensitive enough to respond when the appropriate wires in the control matrix are switched on, but not so sensitive that they respond when a neighbouring elements is changed. Despite these difficulties, the general consensus is that MTJs are the more promising ideas. Dr. Parkin says his group evaluated the GMR approach and decided not to pursue it, despite the fact that IBM pioneered GMR in hard disks. Dr. Prinz, however, contends that his plan will eventually offer higher storage densities and lower production costs.
Not content with shaking up the multi-billion-dollar market for computer memory, some researchers have even more ambitious plans for magnetic computing. In a paper published last month in Science, Russell Cowburn and Mark Well and of Cambridge University outlined research that could form the basis of a magnetic microprocessor — a chip capable of manipulating (rather than merely storing) information magnetically. In place of conducting wires, a magnetic processor would have rows of magnetic dots, each of which could be polarised in one of two directions. Individual bits of information would travel down the rows as magnetic pulses, changing the orientation of the dots as they went. Dr. Cowbum and Dr. Welland have demonstrated how a logic gate (the basic element of a microprocessor) could work in such a scheme. In their experiment, they fed a signal in at one end of the chain of dots and used a second signal to control whether it propagated along the chain.
It is, admittedly, a long way from a single logic gate to a full microprocessor, but this was true also when the transistor was first invented. Dr. Cowburn, who is now searching for backers to help commercialise the technology, says he believes it will be at least ten years before the first magnetic microprocessor is constructed. But other researchers in the field agree that such a chip, is the next logical step. Dr. Prinz says that once magnetic memory is sorted out “the target is to go after the logic circuits.” Whether all-magnetic computers will ever be able to compete with other contenders that are jostling to knock electronics off its perch — such as optical, biological and quantum computing — remains to be seen. Dr. Cowburn suggests that the future lies with hybrid machines that use different technologies. But computing with magnetism evidently has an attraction all its own.
In developing magnetic memory chips to replace the electronic ones, two alternative research paths are being pursued. These are approaches based on:
Solution
Refer to the lines "The first being investigated by Gary Prinz and his colleagues at the Naval Research Laboratory (NRL) in Washington D.C. exploits the fact that the electrical resistance of some materials changes in the presence of a magnetic field- a phenomenon known as magneto-resistance." "Most attention in the field is focused on an alternative approach based on magnetic tunnel-junction (MTJs), which are being investigated by researchers at chip makers, "
This makes B correct.
A binary digit or bit is represented in the magneto-resistance based magnetic chip using:
Solution
Refer to the lines "In the NRL’s magnetic design, by contrast, each bit is stored in a magnetic element in the form of a vertical pillar of magnetisable material."
In magnetic tunnel-junctions (MTJs) tunnelling is easier when:
Solution
Refer to the lines " It turns out that such tunneling is easier when the two magnetic layers are polarized in the same direction than when they are polarized in opposite directions."
A major barrier on the way to build a full-scale memory chip based on MTJs is:
Solution
Refer these lines "According to Paulo Freitas, an expert on chip manufacturing at the Technical University of Lisbon, magnetic memory elements will have to become far smaller and more reliable than current prototypes if they are to compete with electronic memory."
In the MTJs approach, it is possible to identify whether the topmost layer of the magnetised memory element is storing a zero or one by:
Solution
Refer to the lines "So by measuring the current that flows through the sandwich, it is possible to determine the alignment of the topmost layer, and hence whether it is storing a zero or a one."
A magnetic chip that can both store and manipulate information, is being pursued by:
Solution
Refer the lines "Not content with shaking up the multi-billion-dollar market for computer memory, some researchers have even more ambitious plans for magnetic computing. In a paper published last month is Science, Russell Cowburn and Mark Welland of Cambridge University outlined research that could from the basis of a magnetic microprocessor chip capable of manipulating (rather than merely storing) information magnetically"
So the mentioned resarch is being pursued by Russell Cowburn and Mark Welland, hence the correct answer is D.
Experimental research currently underway, using rows of magnetic dots, each of which could be polarised in one of the two directions, has led to the demonstration of:
Solution
Refer these lines "Individual bits of information would travel down the rows as magnetic pulses, changing the orientation of the dots as they went. Dr. Cowburn and Dr Welland have demonstrated how a logic gate (the basic element of a microprocessor could work in such a scheme."
This makes B correct.
From the passage, which of the following cannot be inferred?
Solution
Refer to the starting paragraph " Electronic memory chips are fast but volatile (their contents are lost when the computer is unplugged."
The story begins as the European pioneers crossed the Alleghenies and started to settle in the Midwest. The land they found was covered with forests. With incredible efforts they felled the trees, pulled the stumps and planted their crops in the rich, loamy soil. When they finally reached the western edge of the place we now call Indiana, the forest stopped and ahead lay a thousand miles of the great grass prairie. The Europeans were puzzled by this new environment. Some even called it the “Great Desert”. It seemed untillable. The earth was often very wet and it was covered with centuries of tangled and matted grasses. With their cast iron plows, the settlers found that the prairie sod could not be cut and the wet earth stuck to their plowshares. Even a team of the best oxen bogged down after a few years of tugging. The iron plow was a useless tool to farm the prairie soil. The pioneers were stymied for nearly two decades. Their western march was hefted and they filled in the eastern regions of the Midwest.
In 1837, a blacksmith in the town of Grand Detour, Illinois, invented a new tool. His name was John Deere and the tool was a plow made of steel. It was sharp enough to cut through matted grasses and smooth enough to cast off the mud. It was a simple too, the “sod buster” that opened the great prairies to agricultural development.
Sauk Country, Wisconsin is the part of that prairie where I have a home. It is named after the Sauk Indians. In 1673 Father Marquette was the first European to lay his eyes upon their land. He found a village laid out in regular patterns on a plain beside the Wisconsin River. He called the place Prairie du Sac) The village was surrounded by fields that had provided maize, beans and squash for the Sauk people for generations reaching back into the unrecorded time.
When the European settlers arrived at the Sauk prairie in 1837, the government forced the native Sank people west of the Mississippi River. The settlers came with John Deere’s new invention and used the tool to open the area to a new kind of agriculture. They ignored the traditional ways of the Sank Indians and used their sod-busting tool for planting wheat. Initially, the soil was generous and the nurturing thrived. However each year the soil lost more of its nurturing power. It was only thirty years after the Europeans arrived with their new technology that the land was depleted, Wheat farming became uneconomic and tens of thousands of farmers left Wisconsin seeking new land with sod to bust.
It took the Europeans and their new technology just one generation to make their homeland into a desert. The Sank Indians who knew how to sustain themselves on the Sauk prairie land were banished to another kind of desert called a reservation. And they even forgot about the techniques and tools that had sustained them on the prairie for generations unrecorded. And that is how it was that three deserts were created — Wisconsin, the reservation and the memories of a people. A century later, the land of the Sauks is now populated by the children of a second wave of European tanners who learned to replenish the soil through the regenerative powers of dairying, ground cover crops and animal manures. These third and fourth generation farmers and townspeople do not realise, however, that a new settler is coming soon with an invention as powerful as John Deere’s plow.
The new technology is called ‘bereavement counselling’. It is a tool forged at the great state university, an innovative technique to meet the needs of those experiencing the death of a loved one, tool that an “process” the grief of the people who now live on the Prairie of the Sauk. As one can imagine the final days of the village of the Sauk Indians before the arrival of the settlers with John Deere’s plow, one can also imagine these final days before the arrival of the first bereavement counsellor at Prairie du Sac) In these final days, the farmers arid the townspeople mourn at the death of a mother, brother, son or friend. The bereaved is joined by neighbours and kin. They meet grief together in lamentation, prayer and song. They call upon the words of the clergy and surround themselves in community.
It is in these ways that they grieve and then go on with life. Through their mourning they are assured of the bonds between them and renewed in the knowledge that this death is a part of the Prairie of the Sauk. Their grief is common property, an anguish from which the community draws strength and gives the bereaved the courage to move ahead.
It is into this prairie community that the bereavement counsellor arrives with the new grief technology. The counsellor calls the invention a service and assures the prairie folk of its effectiveness and superiority by invoking the name of the great university while displaying a diploma and certificate. At first, we can imagine that the local people will be puzzled by the bereavement counsellor’s claim, However, the counsellor will tell a few of them that the new technique is merely o assist the bereaved’s community at the time of death. To some other prairie folk who are isolated or forgotten, the counsellor will approach the Country Board and advocate the right to treatment for these unfortunate souls. This right will be guaranteed by the Board’s decision to reimburse those too poor tc pay for counselling services. There will be others, schooled to believe in the innovative new tools certified by universities and medical centres, who will seek out the bereavement counsellor by force of habit. And one of these people will tell a bereaved neighbour who is unschooled that unless his grief is processed by a counsellor, he will probably have major psychological problems in later life. Several people will begin to use the bereavement counsellor because, since the Country Board now taxes them to insure access to the technology, they will feel that to fail to be counselled is to waste their money, and to be denied a benefit, or even a right.
Finally, one day, the aged father of a Sauk woman will die. And the next door neighbour will not drop by because he doesn’t want to interrupt the bereavement counsellor. The woman’s kin will stay home because they will have learned that only the bereavement counsellor knows how to process grief the proper way. The local clergy will seek technical assistance from the bereavement counsellor to learn the connect form of service to deal with guilt and grief. And the grieving daughter will know that it is the bereavement counsellor who really cares for her because only the bereavement counsellor comes when death visits this family on the Prairie of the Sauk.
It will be only one generation between the bereavement counsellor arrives and the community of mourners disappears. The counsellor’s new tool will cut through the social fabric, throwing aside kinship, care, neighbourly obligations and communality ways cc coming together and going on. Like John Deere’s plow, the tools of bereavement counselling will create a desert we a community once flourished, And finally, even the bereavement counsellor will see the impossibility of restoring hope in clients once they are genuinely alone with nothing but a service for consolation. In the inevitable failure of the service, the bereavement counsellor will find the deserts even in herself.
Which one of the following best describes the approach of the author?
Solution
The author didnt illustrate the failure of both the inventions. Also option D is clearly not the answer. Option C perfectly captures the approach of author
According to the passage, bereavement handling traditionally involves:
Solution
As is it clearly stated in the passage that traditionally ' ... farmers arid the townspeople mourn at the death of a mother, brother, son or friend. The bereaved is joined by neighbours and kin. They meet grief together in lamentation, prayer and song... ' . Hence option B
Due to which of the following reasons, according to the author, will the bereavement counsellor find the deserts even in herself?
Solution
Among options only C perfectly explains the reason behind the question. Its not mentioned in that, Over a period of time, working with Sauk Indians the bereavement counsellor becomes one of them. SO option A is out also option B is never mentioned .
According to the author, the bereavement counsellor is:
Solution
It is clearly stated in the passage '..schooled to believe in the innovative new tools certified by universities and medical centres ... ' which makes option D as answer
The Prairie. was a great puzzlement for the European pioneers because:
Solution
In the forth line itself , term 'great grass prairie ' is used . The first paragraph conveys the reasons of puzzlement of Europeans. Refer to the lines:"When they finally reached the western edge of the place we now call Indiana, the forest stopped and ahead lay a thousand miles of the great grass prairie. The Europeans were puzzled by this new environment. Some even called it the “Great Desert”. It seemed untillable."This substantiates the point made in A.
Which of the following does the ‘desert’ in the passage refer to?
Solution
Refer to the lines "When they finally reached the western edge of the place, we now call Indiana, the forest stopped and ahead lay a thousand miles of the great grass prairie. The Europeans were puzzled by this new environment. Some even called it the ‘Great Desert’."
This makes B correct
"Like John Deere’s plow, the tools of bereavement counselling will create a desert where a community once flourished" This makes A and C correct
According to the author, people will begin to utilise the service of the bereavement counsellor because:
Solution
Option C and D are incorrect as these options are nowhere mentioned as the cause for the utilisation of the said services.
Refer to these lines "Several people will begin to use the bereavement counsellor because, since the Country Board now taxes them to insure access to the technology, they will feel that to fail to be counselled is to waste their money, and to be denied a benefit, or even a right." This makes option A more suitable than B
Which of the following parallels between the plow and bereavement counselling is not claimed by the author?
Solution
Refer these line "The new technology is called ‘bereavement counselling’. It is a tool forged at the great state university, an innovative technique to meet the needs"
This makes A correct.
Refer the line "Like John Deere’s plow, the tools of bereavement counselling will create a desert where a community once flourished."
This makes C correct
Refer the line "A century later, the land of the Sauks is now populated by the children of a second wave of European farmers who learned to replenish the soil through the regenerative powers of dairying, ground cover crops and animal manures."
This makes D correct.
The teaching and transmission of North Indian classical music is, and long has been, achieved by largely oral means. The raga and its structure, the often breathtaking intricacies of talc, or rhythm, and the incarnation of raga and tala as bandish or composition, are passed thus, between guru and shishya by word of mouth and direct demonstration, with no printed sheet of notated music, as it were, acting as a go-between. Saussure’s conception of language as a communication between addresser and addressee is given, in this model, a further instance, and a new, exotic complexity and glamour.
These days, especially with the middle class having entered the domain of classical music and playing not a small part ensuring the continuation of this ancient tradition, the tape recorder serves as a handy technological slave and preserves, from oblivion, the vanishing, elusive moment of oral transmission. Hoary gurus, too, have seen the advantage of this device, and increasingly use it as an aid to instructing their pupils; in place of the shawls and other traditional objects that used to pass from shishya to guru in the past, as a token of the regard of the former for the latter, it is not unusual, today, to see cassettes changing hands.
Part of my education in North Indian classical music was conducted via this rather ugly but beneficial rectangle of plastic, which I carried with me to England when I was a undergraduate. Once cassette had stored in it various talas played upon the tabla, at various tempos, by my music teacher’s brother-in law, Hazarilalii, who was a teacher of Kathak dance, as well as a singer and a tabla player. This was a work of great patience and prescience, a one-and-a-half hour performance without my immediate point or purpose, but intended for some delayed future moment who I’d practise the talas solitarily.
This repeated playing our of the rhythmic cycles on the tabla was inflected by the noises-an hate auto driver blowing a horn; the sound bf overbearing pigeons that were such a nuisance on the banister; even the cry of a kulfi seller in summer —entering from the balcony of the third foot flat we occupied in those days, in a lane in a Bombay suburb, before we left the city for good. These sounds, in turn, would invade, hesitantly, the ebb and flow of silence inside the artificially heated room, in a borough of West London, in which I used to live as an undergraduate. There, in the trapped dust, silence and heat, the theka of the tabla, qualified by the imminent but intermittent presence of the Bombay subrub, would come to life again. A few years later, the tabla and, in the background, the pigeons and the itinerant kulfi seller, would inhabit a small graduate room in Oxford.
cThe tape recorder, though, remains an extension of the oral transmission of music, rather than a replacement of it. And the oral transmission of North Indian classical music remains, almost uniquely, testament to the fact that the human brain can absorb, remember and reproduces structures of great complexity and sophistication without the help of the hieroglyph or written mark or a system of notation. I remember my surprise on discovering the Hazarilalji- who had mastered Kathak dance, tala and North Indian classical music, and who used to narrate to me, occasionally, compositions meant for dance that were grant and intricate in their verbal prosody, architecture and rhythmic complexity- was near illustrate and had barely learnt to write his name in large and clumsy letters.
Of course, attempts have been made, throughout the 20th century, to formally codify and even notate this music, and institutions set up and degrees created, specifically to educate students in this “scientific” and codified manner. Paradoxically, however, this style of teaching has produced no noteworthy student or performer; the most creative musicians still emerge from the guru-shishya relationship, their understanding of music developed by oral communication.
The fact that North Indian classical music emanates from, and has evolved through, oral culture, means that this music has a significantly different aesthetic, aw that this aesthetic has a different politics, from that of Western classical music) A piece of music in the Western tradition, at least in its most characteristic and popular conception, originates in its composer, and the connection between the two, between composer and the piece of music, is relatively unambiguous precisely because the composer writes down, in notation, his composition, as a poet might write down and publish his poem. However far the printed sheet of notated music might travel thus from the composer, it still remains his property; and the notion of property remains at the heart of the Western conception of “genius”, which derives from the Latin gignere or ‘to beget’.
The genius in Western classical music is, then, the originator, begetter and owner of his work the printed, notated sheet testifying to his authority over his product and his power, not only of expression or imagination, but of origination. The conductor is a custodian and guardian of this property. IS it an accident that Mandelstam, in his notebooks, compares — celebratorily—the conductor’s baton to a policeman’s, saying all the music of the orchestra lies mute within it, waiting for its first movement to release it into the auditorium?
The raga — transmitted through oral means — is, in a sense, no one’s property; it is not easy to pin down its source, or to know exactly where its provenance or origin lies. Unlike the Western classical tradition, where the composer begets his piece, notates it and stamps it with his ownership and remains, in effect, larger than, or the father of, his work, in the North India classical tradition, the raga — unconfined to a single incarnation, composer or performer — remains necessarily greater than the artiste who invokes it.
This leads to a very different politics of interpretation and valuation, to an aesthetic that privileges the evanescent moment of performance and invocation over the controlling authority of genius and the permanent record. It is a tradition, thus, that would appear to value the performer, as medium, more highly than the composer who presumes to originate what, effectively, cannot be originated in a single person — because the raga is the inheritance of a culture.
The author’s contention that the notion of property lies at the heart of the Western conception of genius is best indicated by which one of the following?
Solution
Refer to the lines of the paragraph "However far the printed sheet of notated music might travel thus from the composer, it still remains his property; and the notion of property remains at the heart of the Western conception of ‘genius’, which derives from the Latin gignere or ‘to beget’." The word "beget" means: to bring into this world. In the next line the author states that in Western music, the genius is the person who is the originator and owner of his work. This clearly explains the answer to be option C.
Saussure’s conception of language as a communication between addresser and addressee, according to the author, is exemplified by the:
Solution
Refer to the following lines "The teaching and transmission of North Indian classical music is, and long has been achieved by largely oral means. The raga and its structure, the often breathtaking intricacies of tala or rhythm, and the incarnation of rage and tala as bandish or composition, are passed thus, between, guru and shishya by word of mouth and direct demonstration, with no printed sheet of notated music, as it were acting as a go-between. Saussure’s conception of language as a communication between addresser and addressee is given, in this model, a further instance, and a new, exotic complexity and glamour"
This clearly indicates that the composition is passed to one another vocally,hence the correct option is 1.
The author holds that the “rather ugly but beneficial rectangle of plastic” has proved to be a “hand technological slave” in:
Solution
Refer to the lines of the para where it is written that "These days, especially with the middle-class having entered the domain of classical music and playing not a small part in ensuring the continuation of this ancient tradition, the tape recorder serves as a handy technological slave and preserves, from oblivion, the vanishing, elusive moment of oral transmission"
These vanishing,elusive moments are clearly transient which are recorded in cassetes, hence the correct answer is option D.
The oral transmission of North Indian classical music is an almost unique testament of the:
Solution
Refer to the lines where it is written "And the oral transmission of North Indian classical music remains, almost uniquely, a testament to the fact that the human brain can absorb, remember and reproduce structures of great complexity and sophistication without the help of the hieroglyph or written mark or a system of notation."
This implies that brain can produce complex structure without any external help.
According to the passage, in the North Indian classical tradition, the raga remains greater than the artiste who invokes it. This implies an aesthetic which:
Solution
Refer to the lines"This leads to a very different politics of interpretation and valuation to an aesthetic that privileges the evanescent moment of performance and invocation over the controlling authority of genius and the permanent record. "
B and D are incorrect as it has not been implied by this sentence.
C is incorrect as it is opposite to the implied meaning of the author.
From the author’s explanation of the notion that in the Western tradition, music originates in its composer, which one of the following cannot be inferred?
Solution
Refer to the following line "A piece of music in the Western tradition, at least in its most characteristic and popular conception, originates in its composer, and the connection between the two, between composer and the piece of music, is relatively unambiguous precisely because the composer writes down, in notation his composition, as a poet might write down and publish poem."
This makes option C correct.
"To genius in Western classical music is, then, the originator, begetter and owner of his work-the printed, notated sheet testifying to his authority over his product and his power, not only for expression or imagination. But of origination."
This makes D correct
"However far the printed sheet of notated music might travel thus from the composer, it still remains his property; and the notion of property remains at the heart of the Western conception of ‘genius’, which derives from the Latin gignere or ‘to beget’."
This makes A correct.
According to the author, the inadequacy of teaching North Indian classical music through a codified, notation based system is best illustrated by:
Solution
Refer to the lines " Paradoxically, however, this style of teaching has produced no noteworthy students or performer, the most creative musicians still emerge from the guru-shishya relationship, their understanding of music developed by oral communication."
This indicates that the tradition has not produced any noteworthy student.
Which of the following statements best conveys the overall idea of the passage?
Solution
Option A and C are rejected outrightly as they do not convey the central idea of the passage.
Option D is correct as per the passage but it is not the main idea which tha passage wants to convey.
Option B correctly summarises the paragraph as the author wants to convey that unlike western classical, North Indian classical is transmitted through culture.
For the following questions answer them individually
Sentence given in each question, when properly sequenced, from a coherent paragraph. The first and last sentences are 1 and 6, and the four in between are labelled A, B, C and D. Choose the most logical order of these four sentences for among the four given choices to construct a coherent paragraph from sentences 1 to 6.
1) Security inks exploit the same principle that causes the vivid and constantly changing colours of a film of oil on water.
A. When two rays of light meet each other after being reflected from these different surfaces, they have each travelled slightly different distances.
B. The key is that the light is bouncing off two surfaces, that of the oil and that of the water layer below it.
C. The distance the two rays travel determines which wavelengths, and hence colours, interfere constructively and look bright.
D. Because light is an electromagnetic wave, the peaks and troughs of each ray then interfere either constructively, to appear bright, or destructively, to appear dim.
6) Since the distance the rays travel changes with the angle as you look at the surface, different colours look bright from different viewing angles.
Solution
The statement in sentence 1 talks about how security inks use the same concept as that of oil on water. The idea is continued in sentence B and then in A, by talking about how the light is coming from two different surfaces and travelling two different distances. The light coming from the two different surfaces then interferes because it is an electromagnetic wave and produces the effect - bright colours. So, the correct order of sentences is 1-B-A-D-C-2.
Sentence given in each question, when properly sequenced, from a coherent paragraph. The first and last sentences are 1 and 6, and the four in between are labelled A, B, C and D. Choose the most logical order of these four sentences for among the four given choices to construct a coherent paragraph from sentences 1 to 6.
1) Commercially reared chicken can be unusually aggressive, and are often kept in darkened sheds to prevent them pecking at each other.
A. The birds spent far more of their time—up to a third — pecking at the inanimate objects in the pens, in contrast to birds in other pens which spend a lot of time attacking others.
B. In low light conditions, they behave less belligerently, but are more prone to ophthalmic disorders and respiratory problem.
C. In an experiment, aggressive head-pecking was all but eliminated among birds in the enriched environment
D. Altering the birds’ environment, by adding bales of wood-shavings to their pens, can work wonders.
6) Bales could diminish aggressiveness and reduce injuries; they might even improve productivity, since a happy chicken is a productive chicken.
Solution
The first sentence talks about how commercially reared chicken are usually aggressive and hence are kept in darkened sheds to prevent them from pecking at each other. This is because, in low-light conditions, they behave less aggressively - this idea is mentioned in sentence B. However, altering the environment in which the birds live, like adding bales of wood-shavings can work wonders and prevent the birds from pecking each other. This is proved with the help of an experiment in which birds in the enriched environment spent far less time pecking each other, instead preferring to peck inanimate objects in their pens. So, the correct order of sentences is 1-B-D-C-A-2.
Sentence given in each question, when properly sequenced, from a coherent paragraph. The first and last sentences are 1 and 6, and the four in between are labelled A, B, C and D. Choose the most logical order of these four sentences for among the four given choices to construct a coherent paragraph from sentences 1 to.6.
1) The concept of a ‘nation-state’ assumes a complete correspondence between the boundaries of the nation and the boundaries of those who live in a specific state.
A. Then there are members of national collectivities who live in other countries, making a mockery of the concept.
B. There are always people living in particular states who are not considered to be (and often do not consider themselves to be) members of the hegemonic nation.
C. Even worse, there are nations which never had a state for which are divided across several states.
D. This, of course, has been subject to severe criticism and is virtually everywhere a fiction.
6) However, the fiction has been, and continues to be, at the basis of nationalist ideologies.
Solution
The opening sentence talks about the concept of "nation-state" assuming a complete correspondence between the boundaries of nation and the boundaries of those who live in a specific state. This has been the subject of severe criticism and a fiction everywhere. So, D follows 1. A-C is a link because, C continues the idea being talked about in A by stating an even worse case. B precedes A because it starts talking about people who live in particular states but are not considered to be members of the hegemonic nation and A continues this idea. The correct order of sentences is 1-D-B-A-C-2.
Sentence given in each question, when properly sequenced, from a coherent paragraph. The first and last sentences are 1 and 6, and the four in between are labelled A, B, C and D. Choose the most logical order of these four sentences for among the four given choices to construct a coherent paragraph from sentences 1 to.6.
1) In the sciences, even questionable examples of research fraud are harshly punished.
A. But no such mechanism exists in the humanities — much of what humanities researchers call research does not lead to results that are replicable by other scholars.
B. Given the importance of interpretation in historical and literary scholarship, humanities researchers are in a position where they can explain away deliberate and even systematic distortion.
C. Mere suspicion is enough for funding to be cut off; publicity guarantees that careers can be effectively ended.
D. Forgeries which take the form of pastiches in which the forger intersperses fake and real parts can be defended as mere mistakes or aberrant misreading.
6) Scientists fudging data have no such defences.
Solution
The sentence following 1 should be C as it continues the idea started in 1. A follows C and describes that lack of punishment in Humanities. B follows A as it describes how humanities researchers can get away with distortions. This is followed by sentence D.
Sentence given in each question, when properly sequenced, from a coherent paragraph. The first and last sentences are 1 and 6, and the four in between are labelled A, B, C and D. Choose the most logical order of these four sentences for among the four given choices to construct a coherent paragraph from sentences 1 to.6.
1) Horses and communism were, on the whole, a poor match.
A. Fine horses bespoke the nobility the party was supposed to despise.
B. Communist leaders, when they visited villages, preferred to see cows and pigs.
C. Although a working horse was just about tolerable, the communists were right to be wary.
D. Peasants from Poland to the Hungarian Pustza preferred their horses to party dogma.
6) “A farmer’s pride is his horse; his cow may be thin but his horse must be fat,” went a Slovak saying.
Solution
The first sentence compares horses and communism - and says it's a poor match. This is because fine horses bespoke of the nobility the party was supposed to despise. So, the communist leaders, when they visited villages preferred to see cows and pigs to horses. There is good reason for the leaders to be wary of a horse, even though it was a tolerable animal. The peasants, on the other hand, cared not much for the party dogma and preferred their horses. They went by the adage, "A farmer's pride is in his horse, his cow may be thin but his horse must be fat". The correct order of sentences is, therefore, 1-A-B-C-D-2.
In each of the following sentences, parts of the sentence are left blank. Beneath each sentence, four different ways of completing the sentence are indicated. Choose the best alternative from among the four.
Though one eye is kept firmly on the _______, the company now also promotes _______ contemporary art.
[CAT 2000]
Solution
The use of the word 'though' at the beginning of the sentence suggests that the two words should be of contrasting nature. This rules out present in the first blank. The words 'market' and 'popular' in the first and second blanks do not make sense. The correct choice of words is 'future' and 'popular'. Hence, option b).
In each of the following sentences, parts of the sentence are left blank. Beneath each sentence, four different ways of completing the sentence are indicated. Choose the best alternative from among the four.
The law prohibits a person from felling a sandalwood tree, even if it grows on one’s own land, without prior permission from the government. As poor people cannot deal with the government, this legal provision leads to a rip-roaring business for _______ , who care neither for the ________, nor for the trees.
[CAT 2000]
Solution
'Touts' means persons who buy something to resell it at a profit. This is apt in the first blank. The word 'rich' doesn't make sense in the second blank. The correct choice of words is, therefore, 'touts' and 'poor'. Hence, option d).
In each of the following sentences, parts of the sentence are left blank. Beneath each sentence, four different ways of completing the sentence are indicated. Choose the best alternative from among the four.
It will take some time for many South Koreans to _______ the conflicting images of North Korea, let alone to _____ what to make of their northern cousins.
[CAT 2000]
Solution
'Reconcile' is to make one thing consistent with the other. This is apt in the first blank. After reconciliation, they then have to decide what to make of their northern cousins. Hence, the correct choice of words is 'reconcile' and 'decide'. Option a)
In each of the following sentences, parts of the sentence are left blank. Beneath each sentence, four different ways of completing the sentence are indicated. Choose the best alternative from among the four.
In these bleak and depressing times of _______ prices, non-performing governments and ________ crime rates, Sourav Ganguly has given us, Indians, a lot to cheer about.
[CAT 2000]
Solution
Ascending prices and booming crime rates is incorrect usage. This rules out options b) and d). Between a) and c), the words in c), 'spiralling' and 'soaring' convey the intensity of the situation more aptly than 'escalating' and 'increasing'. Hence, option c).
In each of the following sentences, parts of the sentence are left blank. Beneath each sentence, four different ways of completing the sentence are indicated. Choose the best alternative from among the four.
The manners and _______ of the nouveau riche is a recurrent ______ in literature.
[CAT 2000]
Solution
Neither 'style' nor 'wealth' is appropriate in the first blank. The word 'morals' is apt. Between 'story' and 'theme', 'theme' is more appropriate in the second blank. Hence, option d).
The, sentences given in each question, when properly sequenced, form a coherent paragraph. Each sentence is labelled with a letter. Choose the most logical order of sentences from among the four given choices to construct a coherent paragraph.
A.If caught in the act, they were punished, not for the crime, but for allowing themselves to be caught.
B.The bellicose Spartans sacrificed all the finer things in life for military expertise.
C.Those fortunate enough to survive babyhood were taken away from their mothers at the age of seven to undergo rigorous military training.
D.This consisted mainly of beatings and deprivations of all kinds like going around barefoot in winter, and worse, starvation so that they would be forced to steal food to survive.
E.Male children were examined at birth by the city council and those deemed too weak to become soldiers were left to die of exposure.
Solution
The paragraph starts with sentence B. E and C continue the idea started in B. D follows C and A is the best concluding statement. So, the correct order of sentences is BECDA.
The, sentences given in each question, when properly sequenced, form a coherent paragraph. Each sentence is labelled with a letter. Choose the most logical order of sentences from among the four given choices to construct a coherent paragraph.
A. This very insatiability of the photographing eye changes the terms of confinement in the cave, our world.
B. Humankind lingers unregenerately in Plato’s cave, still revelling, its age-old habit, in mere images of truth.
C. But being educated by photographs is not like being educated by older images drawn by hand; for one thing, there are a great many more images around, claiming our attention.
D. The inventory started in 1839 and since then just about everything has been photographed, or so it seems.
E. In teaching us a new visual code, photographs alter and enlarge our notions of what is worth looking at and what we have a right to observe.
Solution
B opens the paragraph by introducing the motion of ‘human being drawing images in cave’. C introduces the new means of image making, i.e. photography. The inventory in D refers to the images in C. ‘everything has been photographed’ in D should be followed by ‘insatiability’ in A. ‘confinement’ in A is then followed by ‘enlarge our notions’ in E.
The, sentences given in each question, when properly sequenced, form a coherent paragraph. Each sentence is labelled with a letter. Choose the most logical order of sentences from among the four given choices to construct a coherent paragraph.
A. To be culturally literate is to possess the basic information needed to thrive in the modern world.
B. Nor is it confined to one social class; quite the contrary.
C. It is by no means confined to “culture” narrowly understood as an acquaintance with the arts.
D. Cultural literacy constitutes the only sure avenue of opportunity for disadvantaged children, the only reliable way of combating the social determinism that now condemns them.
E. The breadth of that information is great, extending over the major domains of human activity from sports to science.
Solution
The best opening sentence is A as it starts the idea that is being discussed in the paragraph. This is followed by E which continues the idea started in A. This is followed by C and then by B. The best concluding sentence is D.
The, sentences given in each question, when properly sequenced, form a coherent paragraph. Each sentence is labelled with a letter. Choose the most logical order of sentences from among the four given choices to construct a coherent paragraph.
A. Both parties use capital and labour in the struggle to secure property rights.
B. The thief spends time and money in his attempt to steal (he buys wire cutters) and the legitimate property owner expends resources to prevent the theft (he buys locks).
C. A social cost of theft is that both the thief and the potential victim use resources to gain or maintain control over property.
D. These costs may escalate as a type of technological arms race unfolds.
E. A bank may purchase more and more complicated and sophisticated safes, forcing safecrackers to invest further in safecracking equipment.
Solution
The best opening sentence is C. A continues the idea and hence follows C. B then describes the way in which both the thief and the owner spend money. So, B should follow A. This is followed by D, which talks about the escalating costs. The best concluding sentence is E.
The, sentences given in each question, when properly sequenced, form a coherent paragraph. Each sentence is labelled with a letter. Choose the most logical order of sentences from among the four given choices to construct a coherent paragraph.
A. The likelihood of an accident is determined by how carefully the motorist drives and how carefully the pedestrian crosses the street.
B. An accident involving a motorist and a pedestrian is such a case.
C. Each must decide how much care to exercise without knowing how careful the other is.
D. The simplest strategic problem arises when two individuals interact with each other, and each must decide what to do without knowing what the other is doing.
Solution
D is the best opening sentence because it introduces the topic that is being discussed in the para. B goes on to give an example of the kind of situations being talked about. A further describes the example in B and C continues the idea of A. So, DBAC is the correct order of sentences.
Directions for the next 2 questions:
A, B, C are three numbers.
Let @(A, B) = average of A and B,
/(A, B) = product of A and B, and
X(A, B) = the result of dividing A by B
The sum of A and B is given by:
Solution
Considering 1st option /(@ (A, B),2) First operation is average of A and B so we get (a+b)/2 and then we in next operation we multiply it by 2 . So we get addition of A and B. So option A
Average of A, B and C is given by:
Solution
Considering option,
In 1st we get product of a and b which is not required In 2nd we get fraction 1.5 which doesnt help in finding average In 3rd we get (a+b)/4 after 2 operations which doesn't give average in further operations. only in 4th option we get overall and exact average of A , B and C .
/(X(@ (/(@(B, A), 2), C), 3), 2) = /(X(@ (/(A+B)/2), 2), C), 3), 2)
= /(X(@ (A+B), C), 3), 2) = /(X((A+B, C)/2, 3), 2)
= /[(A+B+C)/6,2]
= (A+B+C)/3
Directions for the next 2 questions:
For real numbers x, y, let
f(x, y) = Positive square-root of (x + y), if $$(x + y)^{0.5}$$ is real
f(x, y) = $$(x + y)^2$$; otherwise
g(x, y) = $$(x + y)^2$$, if $$\sqrt{(x + y)}$$ is real
g(x, y) = $$- (x + y)$$ otherwise
Which of the following expressions yields a positive value for every pair of non-zero real numbers (x, y)?
Solution
f(x,y) is always non-negative because $$(x+y)^2$$ is always positive
g(x, y) = $$(x + y)^2$$, if $$\sqrt{(x + y)}$$ is real = Always positive
g(x, y) = $$- (x + y)$$ otherwise = Always positive because this happen when (x+y)<0 and -(x+y) is always greater than zero.
f(x,y)+g(x,y) = Always positive
Under which of the following conditions is f(x, y) necessarily greater than g(x, y)?
Solution
When both x and y are less than -1, g(x,y) > 2 and f(x,y) > 4 and $$f(x,y) = g(x,y)^2$$
So, f(x,y) > g(x,y)
Directions for the next 3 questions: For three distinct real positive numbers x, y and z, let
f(x, y, z) = min (max(x, y), max (y, z), max (z, x))
g(x, y, z) = max (min(x, y), min (y, z), min (z, x))
h(x, y, z) = max (max(x, y), max(y, z), max (z, x))
j(x, y, z) = min (min (x, y), min(y, z), min (z, x))
m(x, y, z) = max (x, y, z)
n(x, y, z) = min (x, y, z)
Which of the following is necessarily greater than 1?
Solution
From the given functions we can make out that function h and m give max value , function n and j give min value , function f and g give middle value. From this equation (f(x, y, z) + h(x, y, z)-g(x, y, z))/j(x, y, z) , numerator is always max value and denominator is min value . So this will always be greater than 1 .
Suppose x>y>z
f(x,y,z) = y
g(x,y,z) = y
h(x,y,z) = x
j(x,y,z) = z
Option d = x/z >1
Which of the following expressions is necessarily equal to 1?
Solution
From the given functions we can make out that function h and m give max value , function n and j give min value , function f and g give middle value. So according to equation (f(x, y, z)- m(x, y, z))/(g(x, y, z)-h(x,y, z)) , value of numerator and denominator is equal and hence ratio is equal to 1.
Suppose x>y>z
f(x,y,z) = y
g(x,y,z) = y
h(x,y,z) = x
j(x,y,z) = z
Option a = (y-x)/(y-x) = 1
Which of the following expressions is indeterminate?
Solution
From the given functions we can make out that function h and m give max value , function n and j give min value , function f and g give middle value.So in option B , j cancels out n and h cancels out m . So the denominator becomes 0 and value is indeterminable.
Suppose x>y>z
f(x,y,z) = y
g(x,y,z) = y
h(x,y,z) = x
j(x,y,z) = z
m(x,y,z) = x
n(x,y,z) = z
The denominator of the second option becomes 0, hence making it indeterminate.
Directions for the next 2 questions: There are five machines A, B, C, D, and E situated on a straight line at distances of 10 metres, 20 metres, 30 metres, 40 metres and 50 meters respectively from the origin of the line. A robot is stationed at the origin of the line. The robot serves the machines with raw material whenever a machine becomes idle. All the raw material is located at the origin. The robot is in an idle state at the origin at the beginning of a day. As soon as one or more machines become idle, they send messages to the robot- station and the robot starts and serves all the machines from which it received messages. If a message is received at the station while the robot is away from it, the robot takes notice of the message only when it returns to the station. While moving, it serves the machines in the sequence in which they are encountered, and then returns to the origin. If any messages are pending at the station when it returns, it repeats the process again. Otherwise, it remains idle at the origin till the next message (s) is received.
Suppose on a certain day, machines A and D have sent the first two messages to the origin at the beginning of the first second, and C has sent a message at the beginning of the 5th second and B at the beginning of the 6th second, and E at the beginning of the 10th second. How much distance in metres has the robot travelled since the beginning of the day, when it notices the message of E? Assume that the speed of movement of the robot is 10 metres per second.
Solution
At the beginning, the robot gets the message from both A and D. So it will cated A and D in the same trip.
Distance travelled= 40*2=80m
Time taken=8 sec
At the beginning of 9th second,it recieves message from both B and C and hence caters to them in the same trip.
Distance travelled=30*2=60m
Total distance travelled= (60+80)= 140m
Suppose there is a second station with raw material for the robot at the other extreme of the line which is 60 metres from the origin, that. is, 10 meters from E. After finishing the services in a trip, the robot returns to the nearest station. If both stations are equidistant, it chooses the origin as the station to return to. Assuming that both stations receive the messages sent by the machines and that all the other data remains the same, what would be the answer to the above question?
Solution
Since the machine recieves the message from A and D, it will cater to them in the same trip.In return journey,it will go to the point which is 10 m away from E.
Distance travelled=40+20=60m
Now it recieves the message from B and C and caters them in the single journey.In return journey,it will go to origin.
Distance travelled=40+20=60m
Total distance travelled=60m+60m=120m
Directions for the next 3 questions:
Given below are three graphs made up of straight-line segments shown as thick lines. In each case choose the answer as:
a) if f(x)=3f(-x)
b) if f(x)= -f(-x)
c) if f(x) = f(-x)
d) if 3f(x) = 6f(-x), for x >= 0
Solution
In the given graph, the value of y is constant irrespective of the value of x. Hence value of y would be same for a particular x and -x.
Hence f(x) = f(-x)
Solution
In this graph, f(-1) = 1 and f(1) = 2 and since the two lines pass origin, their values increase linearly.
3f(x) = 6f(-x)
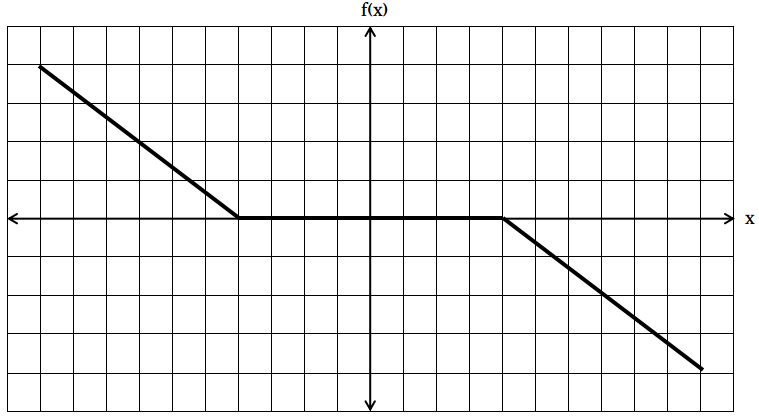
Solution
In this graph, we can see that the graph on LHS of y axis is symmetrical to the graph on RHS of y axis about origin.
Hence f(x) = -f(-x)
Directions for the next 2 questions: There are three bottles of water, A, B, C, whose capacities are 5 litres, 3 litres, and 2 litres respectively. For transferring water from one bottle to another and to drain out the bottles, there exists a piping system. The flow through these pipes is computer controlled. The computer that controls the flow through these pipes can be fed with three types of instructions, as explained below:
Initially, A is full with water, and B and C are empty.
After executing a sequence of three instructions, bottle A contains one litre of water. The first and the third of these instructions are shown below:
First instruction: FILL (C, A)
Third instruction: FILL (C, A)
Then which of the following statements about the instruction is true?
Solution
After first instruction: A = 5-2 = 3L. C = 2L. In the third instruction, A yields 2L to C. It means the capacity of A before third operation was 3L. It means that C's water was either drained or transferred to B. Option B is correct.
Consider the same sequence of three instructions ‘and the same initial state mentioned above. Three more instructions are added at the end of the above sequence to have A contain 4 litres of water. In this total sequence of six instructions, the fourth one is DRAIN (A). This is the only DRAIN instruction in the entire sequence. At the end of the execution of the above sequence, how much water (in litres) is contained in C?
Solution
We know that after 3 operations A contain 1 ltr and 4 th operation is Drain(a) , so 1 ltr is drained and only 4 ltrs remain in all there cylinders. Also after 6 operations A should have all the 4 ltrs in it. hence the other 2 vessels must contain 0 ltrs because there is only one drain operation in the entire sequence.
Directions for the next 2 questions:
For a real number x, let
$$f(x) = 1/(1+x),$$ if $$x$$ is non-negative
$$f(x) = 1+x,$$ if $$x$$ is negative
$$f^n(x) = f(f^{n-1}(x)), n = 2, 3.....$$
What is the value of the product, $$f(2) f^2(2)f^3(2) f^4(2)f^5(2)$$?
Solution
f(2) = 1/3
$$f^2(2)$$ = f(1/3) = 3/4
$$f^3(2)$$ = f(3/4) = 4/7
$$f^4(2)$$ = f(4/7) = 7/11
$$f^5(2)$$ = f(7/11) = 11/18
So, product = 1/18
r is an integer 2. Then, what is the value of $$f^{r-1}(-r) + f^r(-r) + f^{r+1}(-r)$$?
Solution
f(-2) = -1
$$f^2(-2)$$ = f(f(-2)) = f(-1) = 0
$$f^3(-2)$$ = f(f(-2)) = f(0) = 1
So, sum = 0
For the following questions answer them individually
Let D be recurring decimal of the form, $$D = 0.a_1a_2a_1a_2a_1a_2...$$, where digits $$a_1$$ and $$a_2$$ lie between 0 and 9. Further, at most one of them is zero. Then which of the following numbers necessarily produces an integer, when multiplied by D?
Solution
Case 1: $$a_1=0$$
So, D equals $$0.0a_20a_20a_2...$$
So, 100D equals $$a_2.0a_20a_2...$$
So, 99D equals $$a_2$$
Case 2: $$a_2=0$$
So, D equals $$0.a_10a_10a_1...$$
So, 100D equals $$a_10.a_10a_1....$$
So, 99D equals $$a_10$$
So, in both the cases, 99D is an integer. From the given options, only option C satisfies this condition (198=2*99) and hence the correct answer is C.
 In the above table, for suitably chosen constants a, b and c, which one of the following best describes the relation between y and x?
Solution
y=a+bx is a linear function and clearly the function shown in the table is not linear.
Lets take option B:
Suppose $$y=f(x)=a+bx+cx^2$$
f(1)=4 => a+b+c=4 -- (1)
f(2)=8 => a+2b+4c=8 -- (2)
f(3)=14 => a+3b+9c=14 -- (3)
Let us solve the equations and see if $$f(4), f(5),f(6)$$ also satisfy the given equation.
(2)-(1) => b+3c=4
(3)-(2) => b+5c=6
This gives c=1 and b=1 ==> a=2
So, $$f(x)=2+x+x^2$$
$$f(4)=2+4+4^2 = 22$$
$$f(5)=2+5+5^2 = 32$$
$$f(6)=2+6+6^2 = 44$$
As all the three also satisfy the numbers given in the table, it can be inferred that the relationship between x and y is quadratic and the correct option is option (b)
If $$a_1 = 1$$ and $$a_{n+1} = 2a_n +5$$, n=1,2,....,then $$a_{100}$$ is equal to:
Solution
$$a_2 = 2*1 + 5$$
$$a_3 = 2*(2 + 5) + 5 = 2^2 + 5*2 + 5$$
$$a_4 = 2^3 + 5*2^2 + 5*2 + 5$$
...
$$a_{100} = 2^{99} + 5*(2^{98} + 2^{97} + ... + 1)$$
$$= 2^{99} + 5*1*\dfrac{(2^{99} - 1)}{(2-1)} = 2^{99} + 5*2^{99} - 5 = 6*2^{99} - 5$$
What is the value of the following expression?
$$\dfrac{1}{(2^2-1)}+\dfrac{1}{(4^2-1)}+\dfrac{1}{(6^2-1)}+...+\dfrac{1}{(20^2-1)}$$
Solution
$$\dfrac{1}{(2^2-1)}+\dfrac{1}{(4^2-1)}+\dfrac{1}{(6^2-1)}+...+\dfrac{1}{(20^2-1)}$$
= $$\dfrac{1}{(2+1)(2-1)}+\dfrac{1}{(4+1)(4-1)}+..+\dfrac{1}{(20+1)(20-1)}$$
= 1/(1*3) + 1/(3*5) + 1/(5*7) + ... + 1/(19*21)
=1/2 * ( 1/1 - 1/3 + 1/3 - 1/5 + 1/5 - 1/7 + ... +1/19 - 1/21)
=1/2 * (1 - 1/21) = 10/21
A truck travelling at 70 kilometres per hour uses 30% more diesel to travel a certain distance than it does when it travels at the speed of 50 kilometres per hour. If the truck can travel 19.5 kilometres on a litre of diesel at 50 kilometres per hour, how far can the truck travel on 10 litres of diesel at a speed of 70 kilometres per hour?
Solution
If the truck is being driven at 70 kmph, it takes 1.3 liters of diesel to travel 19.5 km.
Therefore, with 10 liters of diesel, the truck can travel 10/1.3 * 19.5 km = 150 km.
Consider a sequence of seven consecutive integers. The average of the first five integers is n. The average of all the seven integers is:
Solution
The first five numbers could be n-2, n-1, n, n+1, n+2. The next two number would then be, n+3 and n+4, in which case, the average of all the 7 numbers would be $$\frac{(5n+2n+7)}{7}$$ = n+1
If x>2 and y>-1,then which of the following statements is necessarily true?
Solution
This kind of questions must be solved using the counter example method.
x = 100 and y = -1/2 rules out option a)
x = 3 and y = 0 rules out options c) and d)
Option b) is correct.
One red flag, three white flags and two blue flags are arranged in a line such that,
A. no two adjacent flags are of the same colour
B. the flags at the two ends of the line are of different colours.
In how many different ways can the flags be arranged?
Solution
The three white flags can be arranged in the following two ways:
__ W __ W __ W or W __ W __ W __
In the blanks, the 2 blue and one red flag can be arranged in 3 ways.
So, the total number of arrangements is 2*3 = 6
Let S be the set of integers x such that:
1) 100 <= x <= 200
2) x is odd
3) x is divisible by 3 but not by 7.
How many elements does S contain?
Solution
Number of multiples of 3 between 100 and 200 = 66 - 33 = 33
Number of odd multiples = 16
Number of odd multiples of 21 = 3 (105, 147, 189)
So, the required number = 13
Let S be the set of prime numbers greater than or equal to 2 and less than 100. Multiply all the elements of S. With how many consecutive zeroes will the product end?
Solution
For number of zeroes we must count number of 2 and 5 in prime numbers below 100.
We have just 1 such pair of 2 and 5.
Hence we have only 1 zero.
Let x, y and z be distinct integers, that are odd and positive. Which one of the following statements cannot be true?
Solution
In option d), x-y is even. So, the product of the three terms is even. So, d) cannot be true.
What is the number of distinct triangles with integral valued sides and perimeter 14?
Solution
Let the sides be x, y and 14-(x+y)
x+y > 14-(x+y) => x+y > 7
x+14-x-y > y => y < 7
Similarly, x < 7
If x = 1, y = 7 (not possible)
So, if x = 2, y = 6
if x = 3, y = 5
if x = 4, y = 4, 5
The cases for x = 5 and 6 are already taken care of by y.
Number of possible cases = 4
Alternate solution::
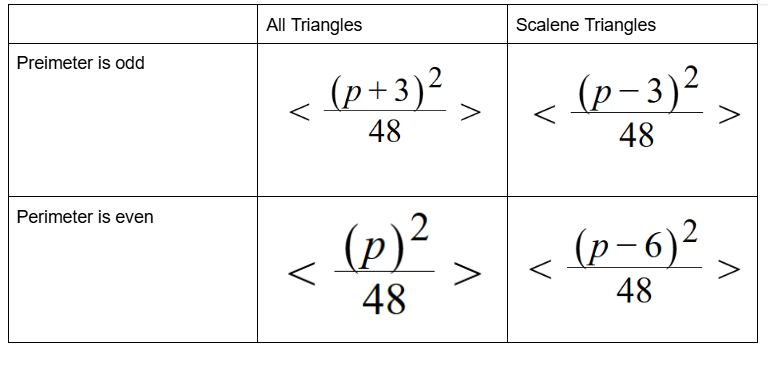
Here, the perimeter is even. So, the number of possible triangles is $$<\dfrac{p^2}{48}>$$ = $$<\dfrac{196}{48}>$$ = 4
Let N = 1421 * 1423 * 1425. What is the remainder when N is divided by 12?
Solution
The numbers 1421, 1423 and 1425 when divided by 12 give remainder 5, 7 and 9 respectively.
5*7*9 mod 12 = 11 * 9 mod 12 = 99 mod 12 = 3
The integers 34041 and 32506 when divided by a three-digit integer n leave the same remainder. What is n?
Solution
The difference of the numbers = 34041 - 32506 = 1535
The number that divides both these numbers must be a factor of 1535.
307 is the only 3 digit integer that divides 1535.
Each of the numbers $$x_1, x_2, ... ,x_n$$ $$(n > 4)$$, is equal to 1 or -1.
Suppose, $$x_1x_2x_3x_4 + x_2x_3x_4x_5 + x_3x_4x_5x_6 + ....... + x_{n-3}x_{n-2} x_{n-1}x_n x_1 + x_{n-1} x_n x_1 x_2 + x_n x_1 x_2x_3$$ = 0, then:
Solution
Since each term is either 1 or -1 . To be 0 we should have even terms and with n=even , no. of terms is even .
The table below shows the age-wise distribution of the population of Reposia. The number of people aged below 35 years is 400 million.
If the ratio of females to males in the ‘below 15 years’ age group is 0.96, then what is the number of females (in millions) in that age group?
Solution
64.75% population is below 35 years age.
The number of people aged below 35 years is 400 million.
So total number of people are, suppose x = $$\frac{400*100}{64.75}$$
Now below 15 years of age we have f/m = 0.96 so f = (m+f)*0.96/1.96 and m+f = 30*400/64.75
Solving we get, f = 30*400*0.96/(64.75*1.96) = 90.8
Hence option B .
Sam has forgotten his friend’s seven-digit telephone number. He remembers the following:
a) the first three digits are either 635 or 674,
b) the number is odd, and
c) the number nine appears once.
If Sam were to use a trial and error process to reach his friend, what is the minimum number of trials he has to make before he can be certain to succeed?
Solution
Consider cases : 1) Last digit is 9: No. of ways in which the first 3 digits can be guessed is 2. No. of ways in which next 3 digits can be guessed is 9*9*9. So in total the number of ways of guessing = 2*9*9*9 = 1458.
2) Last digit is not 9: the number 9 can occupy any of the given position 4, 5, or 6, and there shall be an odd number at position 7.
So in total, the number of guesses = 2*3*(9*9*4) = 1944+1458 = 3402
Let N = $$55^3 + 17^3 - 72^3$$. N is divisible by:
Solution
$$55^3 + 17^3 - 72^3$$ = $$(55-72)k + 17^3$$. This is divisible by 17
Remainder when $$55^3$$ is divided by 3 = 1
Remainder when $$17^3$$ is divided by 3 = -1
Remainder when $$72^3$$ is divided by 3 = 0
So, $$55^3 + 17^3 - 72^3$$ is divisible by 3
So, the answer is d) 3 and 17
If $$x^2 + y^2 = 0.1$$ and |x-y|=0.2, then |x|+|y| is equal to:
Solution
$$(x - y)^2 = x^2 + y^2 - 2xy$$
$$0.04 = 0.1 - 2xy => xy = 0.03$$
So, |xy| = 0.03
$$(|x| + |y|)^2 = x^2 + y^2 + 2|xy| = 0.1 + 0.06 = 0.16$$
So, |x|+|y| = 0.4
ABCD is a rhombus with the diagonals AC and BD intersection at the origin on the x-y plane. The equation of the straight line AD is x + y = 1. What is the equation of BC?
Solution
The line should be parallel to AD and should be of equal distance from the origin in the third quadrant. The equation x+y = -1 satisfies all these conditions.
Consider a circle with unit radius. There are 7 adjacent sectors, S1, S2, S3,....., S7 in the circle such that their total area is (1/8)th of the area of the circle. Further, the area of the $$j^{th}$$ sector is twice that of the $$(j-1)^{th}$$ sector, for j=2, ...... 7. What is the angle, in radians, subtended by the arc of S1 at the centre of the circle?
Solution
Now area of 1st sector = $$\pi * r^2 * \frac{x}{360}$$ where x - angle subtended at center
Now the next sector will have 2x as the angle, and similarly angles will be in GP with ratio = 2.
Sum of areas of all 7 sectors = $$\frac{127*x* \pi * r^2}{360}$$ which is equal to $$\frac{\pi * r^2}{8}$$
We get x = $$\frac{360}{8*127}$$
Now if converted in radians we get x = $$\pi/508$$.
There is a vertical stack of books marked 1, 2 and 3 on Table-A, with 1 at the bottom and 3 on top. These are to be placed vertically on Table-B with 1 at the bottom and 2 on the top, by making a series of moves from one table to the other. During a move, the topmost book, or the topmost two books, or all the three, can be moved from one of the tables to the other. If there are any books on the other table, the stack being transferred should be placed, on top of the existing books, without changing the order of books in the stack that is being moved in that move. If there are no books on the other table, the stack is simply placed on the other table without disturbing the order of books in it. What is the minimum number of moves in which the above task can be accomplished?
Solution
For min steps 1st move would be to place book 3 from A to B
2nd move would be to place book 2 from A to B,
3rd move would be to place book 2 and 3 from B to A.
Last move would be to place books 2,3,1 from table A to Table B.
So 4 moves are atleast needed.
The area bounded by the three curves |x+y| = 1, |x| = 1, and |y| = 1, is equal to:
Solution
|x| = 1 and |y| = 1 form a square of area = 2*2 = 4 sq units
|x+y| = 1 forms a set of parallel lines cutting the axes at (1,0), (0,1), (-1,0) and (0,-1). The graph is as shown:
The area bounded by the three curves is 2*2 - 1/2*1*1*2 = 4 - 1 = 3 sq units
If the equation $$x^3 - ax^2 + bx - a = 0$$ has three real roots, then it must be the case that,
Solution
It can be clearly seen that if b=1 then $$x^2(x - a) + (x - a) = 0$$ an the equation gives only 1 real value of x
If a,b,c are the sides of a triangle, and $$a^2 + b^2 +c^2 = bc + ca + ab$$, then the triangle is:
Solution
$$(a+b+c)^2 = a^2 + b^2 + c^2 + 2(ab + bc + ca) => 3(a^2 + b^2 + c^2)$$
This is possible only if a = b = c.
So, the triangle is an equilateral triangle.
In the figure AB=BC=CD=DE=EF=FG=GA, then $$\angle{DAE}$$ is approximately
Solution
Let angle EAD be x.
So according to given conditions we get , ACB = x.
As an external angle CBD = 2x.
Also we know that total angle on an line is 180 we get EFD = 3x because of which EDF = 3x.
Similarly on opposite side we get AED = 3x.
So in total x+3x+3x = 180.
We get x = 25 (approx).
A shipping clerk has five boxes of different but unknown weights each weighing less than 100 kgs. The clerk weighs the boxes in pairs. The weights obtained are 110, 112, 113, 114, 115, 116, 117, 118, 120 and 121 kgs. What is the weight, in kgs, of the heaviest box?
Solution
Let the individual weights be a,b,c,d,e in increasing order such that e is max and a is min. Adding all the addition of weight together we get 4*(a+b+c+d+e) = 1156 so a+b+c+d+e = 289 . Out of these a+b will be lowest sum and d+e will be the max . so a+b=110 and d+e=121 so we get value of c as 58 . now c have the 3rd highest weight so addition of c and e must give the second largest total i.e 120 . hence e = 120-58 = 62
There are three cities A, B and C. Each of these cities is connected with the other two cities by at least one direct road. If a traveller wants to go from one city (origin) to another city (destination), she can do so either by traversing a road connecting the two cities directly, or by traversing two roads, the, first connecting the origin to the third city and the second connecting the third city to the destination. In all there are 33 routes from A to B (including those via C). Similarly there are 23 routes from B to C (including those via A). How many roads are there from A to C directly?
Solution
The possible roads are:
A -> B Let this be x
A -> C Let this be y
B -> C Let this be z
From the information given, x + yz = 33 -> (1)
z + xy = 23 -> (2)
From the options, if y = 10, x =2 and z = 3 from (2), but it doesn't satisfy (1)
If y = 5, x = 4 and z = 3 from (2) but they don't satisfy (1)
A possible set of numbers for (x,y,z) are (3,6,5)
Number of roads from A -> C = 6
The set of all positive integers is the union of two disjoint subsets:
{f(1), f(2),.....f(n), ...} and {g(1),g(2).... ,g(n).....}, where f(1) < f(2) <.....< f(n)..., and g(1) < g(2) < ..... < g(n) ...,and
g(n) = f(f(n))+1 for all n >= 1. What is the value of g(1)?
Solution
The union of the two sets is the set of positive integers. Also, given the increasing nature of elements, either f(1) or g(1) must be equal to 1. If g(1) = 1, then f(f(1)) =0 which cannot be under the given conditions.
Hence, f(1) = 1
g(1) = f(f(1))+1 = 2
ABCDEFGH is a regular octagon. A and E are opposite vertices of the octagon. A frog starts jumping from vertex to vertex, beginning from A. From any vertex of the octagon except E, it may jump to either of the two adjacent vertices. When it reaches E, the frog stops and says there. Let $$a_n$$ be the number of distinct paths of exactly n jumps ending in E. Then, what is the value of $$a_{2n-1}$$?
Solution
The number of vertices between A and E is 3. So, a minimum of 4 steps is needed for the frog to jump from A to E. Also, the frog can go to E from A along any path in only an even number of steps. (2n - 1) is odd. So, the frog can never reach E from A in (2n-1) number of steps. So, the answer is 0
For all non-negative integers x and y, f(x, y) is defined as below:
f(0, y) = y + 1
f(x + 1, 0) = f(x, 1)
f(x+ 1, y+ 1)= f(x, f(x+ 1, y))
Then, what is the value of f(1,2)?
Solution
For f(1,2). First consider x=0 and y=1 and use 3rd given equation, we get f(0,f(1,1)) now for f(1,1) take x=0 and y=0 we get f(0,f(1,0)), for f(1,0) which we use 2nd equation we get f(0,1) whose value is 2. So we have f(0,f(1,0))= f(0,2) whose value is 3 then put this in f(0,f(1,1)) we get f(0,3) we get as 4
Convert the number 1982 from base 10 to base 12. The result is:
Solution
Quotient of 1982/12 = 165, remainder = 2
Quotient of 165/12 = 13, remainder = 9
Quotient of 13/12 = 1, remainder = 1
Remainder of 1/12 = 1
So, the required number in base 12 = 1192
Two full tanks, one shaped like a cylinder and the other like a cone, contain jet fuel. The cylindrical tank holds 500 litres more than the conical tank. After 200 litres of fuel has been pumped out from each tank the cylindrical tank contains twice the amount of fuel in the conical tank. How many litres of fuel did the cylindrical tank have when it was full?
Solution
Let the current capacity of conical flask be C. So, cylinder = C+500.
After pumping out 200 liters, C+300 = 2(C-200) => C = 700
So, full capacity of cylinder = 700+500 = 1200
A farmer has decided to build a wire fence along one straight side of this property. For this, he planned to place several fence-posts at six metre intervals, with posts fixed at both ends of the side. After he bought the posts and wire, he found that the number of posts he had bought was five less than required. However, he discovered that the number of posts he had bought would be just sufficient if he spaced them eight metres apart. What is the length of the side of his property and how many posts did he buy?
Solution
Let the number of posts the farmer bought = x
Length of the side = (x+5-1)*6 = 6*(x+4)
Length of the side is also equal to (x-1)*8
=> 8x - 8 = 6x + 24 => x = 16
Length of side = 6*20 = 120 m
Triangle PQR has angle PRQ equal to 90 degrees. What is the value of PR + RQ?
A. Diameter of the inscribed circle of the triangle PQR is equal to 10 cm.
B. Diameter of the circumscribed circle of the triangle PQR is equal to 18 cm
Solution
Let a,b and c be length of PR, QR and PQ.
By 2nd statement we know that c=18 and also area = (a*b*c)/9 and by using statement A we have area = inradius*(a+b+c)/c.
Using both the equations we can find out value of PR + RQ . Hence option C.
Harshad bought shares of a company on a certain day, and sold them the next day. While buying and selling he had to pay to the broker one percent of the transaction value of the shares as brokerage. What was the profit earned by him per rupee spent on buying the shares?
A.The sales price per share was 1.05 times that of its purchase price.
B. The number of shares purchased was 100.
Solution
Let the purchase price be P and sale price be S. So total brokerage = 0.01P + 0.01S.
If we consider statement A we have S = 1.05*P.
Hence we can find brokerage value in terms of P.
then total profit = S - brokerage = Constant * P.
Then profit per rupee would be dividing last equation by P
Hence statement A is sufficient.
Using statement B we cant make out the profit percentage.
Hence , option A.
For any two real numbers:
a + b = 1 if both a and b are positive or both a and b are negative.
a + b = -1 if one of the two numbers a and b is positive and the other negative.
What is (2 + 0) + (-5 + -6)?
A. a + b is zero if a is zero
B. a + b = b + a
Solution
We have (2 + 0) + (-5 + -6)
Now using statement B it can be written as (0 + 2) + (-5 + -6).
Using trhe statement A we can get the answer to the required question.
Hence,the question can be answered by using both the statements together, but cannot be answered by using either statement alone.
There are two straight lines in the x-y plane with equations:
ax + by = c
dx + ey = f
Do the two straight lines intersect?
A. a, b, c, d, e and f are distinct real numbers.
B. c and f are non-zero.
Solution
Using option B we know that since the constant terms are non-zero and unique , the lines do not intersect at the origin. Also since other coefficients are not equal , the lines can be parallel or intersecting . Hence, the question cannot be answered even by using both statements together.
O is the centre of two concentric circles. AE is a chord of the outer circle and it intersects the inner circle at points B and D. C is a point on the chord in between B and D. What is the value of AC/CE?
A. BC/CD=1
B. A third circle intersects the inner circle at B and D and the point C is on the line joining the centres of the third circle and the inner circle.
Solution
Using statement A we know that C is midpoint of both BD and AE . Also using statement B we know that C is midpoint of BD and AE. Hence , the question can be answered by using either statement alone.


