What was the maximum percentage of apples supplied by any state in any of the months?
Sign in
Please select an account to continue using cracku.in
↓ →
The following table gives the quantities of apples (in tonnes) arriving at New Delhi market from various states in a particular year. The month in which demand was more than supply, the additional demand was met by the stock from cold storage.
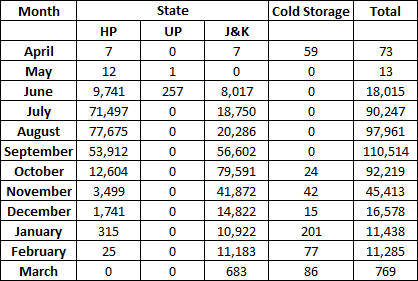
What was the maximum percentage of apples supplied by any state in any of the months?
This percentage is maximum in February in J&K; where the percentage is $$\frac{11183}{11285}=99.09$$%
Which state supplied the maximum number of apples?
From the table it is clear that the state which supplied the most number of apples is either HP or J&K.; UP and Cold Storage supplied less than a thousand apples in total.
The total number of apples supplied by HP is 231,028
The total number of apples supplied by J&K; is 262,735
Hence, the correct answer is J&K;
Which state supplied the highest percentage of apples from the total apples supplied?
The answer to this question is the same as the state which supplied the maximum number of apples.
We can rule out UP and Cold Storage as they supplied significantly less than the other two.
Among the other two states,
The total number of apples supplied by HP is 231,028
The total number of apples supplied by J&K; is 262,735
Hence, the correct answer is J&K;

In which of the following periods was the supply greater than or equal to the demand?
The supply is greater than or equal to demand if the cold storage number is zero.
This is the case between the months May-September.
Hence, the correct option is option (c)
If the yield per tree was 40 kg, then from how many trees were the apples supplied to New Delhi (in millions) during the year?
To calculate the number of trees required, let us calculate the total number of tonnes supplied.
The total number of tonnes supplied equals 494,525.
One tree supplies 40 kilograms.
Hence, the number of trees required is $$\frac{494525*1000}{40} \approx 12.5$$ million trees
Using the data in the earlier question, if there were 250 trees per hectare, then how many hectares of land was used?
In the earlier question, we determined that we needed 12.36 million trees per year.
Each hectare has 250 trees.
So, number of hectares of land used is $$\frac{12.36*1000000}{250} \approx 49450$$

Answer the questions based on the following information. The following bar chart gives the growth percentage in the number of households in the middle, upper-middle and high-income categories in the four regions for the period between 1987-88 and 1994-95.
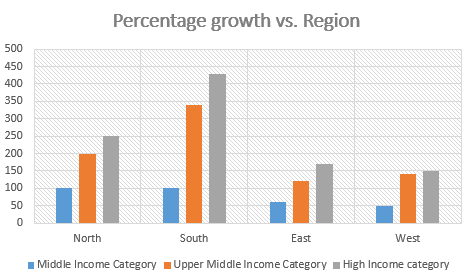
(Number of households in thousands)
Which region showed the highest percentage growth in number of households in all the income categories for the period?
Percentage growth of all households South region showed the maximum increase in all households in the given period. (100% + 340%+ 425% = 865%)
What was the total household income in northern region for upper-middle class?
We don't know the number of households in the upper-middle income class for Northern region and hence can't calculate the total household income for the same.
What is the percentage increase in total number of households for the northern region (upper-middle class) over the given period?
The answer is provided by the bar chart.
Look at the graph named North and the bar colored Orange.
This shows the percentage increase in the upper middle class households from the year 1987-88 to 1994-95 and it equals 200%

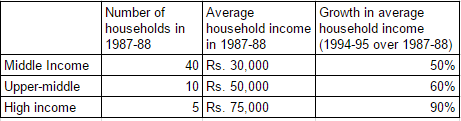
What was the average income of the high-income group in 1987-88?
The answer to this question is provided in the table.
The average income of middle income category is 30,000
The average income of upper-middle income category is 50,000 and
The average income of high income category is 75,000
Hence, the correct answer is 75,000
The ratio of total income for the high-income category to the upper-middle class increased by how much percentage in the given period (approximately) ?
Since we do not know the region-wise population of 1987-1988, we cannot find the increase in the number of households.
Hence, we cannot find the total income for the year 1995-96.
So the ratio cannot be determined.
The average income for the northern region in 1987-88 was
Since we do not know the distribution of households in each region, we cannot determine the average income.

Answer the questions based on the following information.
Krishna distributed 10-acre land to Gopal and Ram who paid him the total amount in the ratio 2 : 3. Gopal invested a further Rs. 2 lakh in the land and planted coconut and lemon trees in the ratio 5 : 1 on equal areas of land. There were a total of 100 lemon trees. The cost of one coconut was Rs. 5. The crop took 7 years to mature and when the crop was reaped in 1997, the total revenue generated was 25% of the total amount put in by Gopal and Ram together. The revenue generated from the coconut and lemon trees was in the ratio 3 : 2 and it was shared equally by Gopal and Ram as the initial amount spent by them were equal.
What was the total output of coconuts?
Let the amounts paid by Gopal and Ram to Krishna be 2X and 3X.
Gopal invested 2 lakhs additionally.
So, the total amount spent by him is 2X+2.
As the total amounts spent by the two of them are equal, it implies that 2X+2 = 3X or X = 2
Hence, the cost of the land is 2X+3X = 5X = 10 lakhs.
Total investment by the two of them is 10+2 = 12 lakhs
Hence, the total revenue generated is 12*25% = 3 lakhs.
The revenue generated by coconuts is $$3*\frac{3}{3+2} = 3*\frac{3}{5} = 1.8$$ lakhs
Cost of a coconut is Rs. 5
Hence, the total output of coconuts is $$\frac{180000}{5} = 36,000$$
What was the value of output per acre of lemon trees planted?
Let the amounts paid by Gopal and Ram to Krishna be 2X and 3X.
Gopal invested 2 lakhs additionally.
So, the total amount spent by him is 2X+2.
As the total amounts spent by the two of them are equal, it implies that 2X+2 = 3X or X = 2
Hence, the cost of the land is 2X+3X = 5X = 10 lakhs.
Total investment by the two of them is 10+2 = 12 lakhs
Hence, the total revenue generated is 12*25% = 3 lakhs.
The revenue generated by lemons is $$3*\frac{2}{3+2} = 3*\frac{2}{5} = 1.2$$ lakhs
Total land used to cultivate lemons is 5 acres.
So, revenue generated by the lemons per acre is $$\frac{1.2}{5} = 0.24$$ lakhs per acre
What was the amount received by Gopal in 1997?
Let the amounts paid by Gopal and Ram to Krishna be 2X and 3X.
Gopal invested 2 lakhs additionally.
So, the total amount spent by him is 2X+2.
As the total amounts spent by the two of them are equal, it implies that 2X+2 = 3X or X = 2
Hence, the cost of the land is 2X+3X = 5X = 10 lakhs.
Total investment by the two of them is 10+2 = 12 lakhs
Hence, the total revenue generated is 12*25% = 3 lakhs.
As the revenue is split equally, Gopal's share in the revenue is $$3*\frac{1}{2} = 1.5$$ lakhs

What was the value of output per tree for coconuts?
Let the amounts paid by Gopal and Ram to Krishna be 2X and 3X.
Gopal invested 2 lakhs additionally.
So, the total amount spent by him is 2X+2.
As the total amounts spent by the two of them are equal, it implies that 2X+2 = 3X or X = 2
Hence, the cost of the land is 2X+3X = 5X = 10 lakhs.
Total investment by the two of them is 10+2 = 12 lakhs
Hence, the total revenue generated is 12*25% = 3 lakhs.
The revenue generated by coconuts is $$3*\frac{3}{3+2} = 3*\frac{3}{5} = 1.8$$ lakhs
The number of coconut trees is 5 times the number of lemon trees = 100*5 = 500
So, the value of output per trees for coconuts is $$\frac{180000}{500} = 360$$
What was the ratio of yields per acre of land for coconuts and lemons (in terms of number of lemons and coconuts)?
We know the total revenue generated by coconuts and lemons respectively.
We also know the price of a coconut and can thus calculate the total number of coconuts produced per acre.
We don't know the price of a lemon and thus can't calculate the total number of lemons produced per acre.
So, the answer can't be determined.
Answer the questions based on the following information.
Ghosh Babu has a manufacturing unit. The following graph gives the cost for the various number of units. Given: Profit = Revenue - Variable cost - Fixed cost. The fixed cost remains constant up to 34 units after which additional investment is to be done in fixed assets. In any case, production cannot exceed 50 units.

Note: The fixed cost for upto 34 units is 50 and the the fixed cost for more is 100.
The revenue from 50 units is 1000 and the variable cost from 50 units is 700
What is the minimum number of units that need to be produced to make sure that there was no loss?
The revenue of 50 units is 1000. So, the revenue per unit is 20.
The variable cost of 50 units is 700. So, the variable cost per unit is 14.
Let the minimum number of units that are needed to be produced to ensure that there is no loss be X.
So, 20X > 14X + 50
Or X > 8
So, the least possible number of units to be produced is 9.

What is the least number of units that should be manufactured such that the profit was at least Rs. 50?
The revenue of 50 units is 1000. So, the revenue per unit is 20.
The variable cost of 50 units is 700. So, the variable cost per unit is 14.
Let the minimum number of units that are needed to be produced to ensure that there is a profit of at least 50.
So, total revenue is 20X and total cost is 14X+50.
So, Profit is 20X - (14X+50) = 6X-50 > 50
Hence, 6X > 100
Or X > 16
So, the least possible number of units to be produced is 17.
If at the most 40 units can be manufactured, then what is the number of units that can be manufactured to maximise profit per unit?
Till 34 units, the fixed cost is constant and the revenue increasing per every unit made.
So, to calculate the number of units that need to be produced to maximize the profit, we have to check only at two points: 34 units and 40 units.
The revenue of 50 units is 1000. So, the revenue per unit is 20.
The variable cost of 50 units is 700. So, the variable cost per unit is 14.
If number of units produced is 34,
Fixed cost is 50
Variable cost is 14*34 = 476
Revenue is 20*34 = 680.
So, profit is 680-476-50 = 154
If number of units produced is 40,
Fixed cost is 100
Variable cost is 14*40 = 560
Revenue is 20*40 = 800.
So, profit is 800-560-100 = 140
So, the profit is maximized when the number of units produced is 34
If the production cannot exceed 45 units, then what is the number of units that can maximise profit per unit?
Till 34 units, the fixed cost is constant and the revenue increasing per every unit made.
So, to calculate the number of units that need to be produced to maximize the profit, we have to check only at two points: 34 units and 45 units.
The revenue of 50 units is 1000. So, the revenue per unit is 20.
The variable cost of 50 units is 700. So, the variable cost per unit is 14.
If number of units produced is 34,
Fixed cost is 50
Variable cost is 14*34 = 476
Revenue is 20*34 = 680.
So, profit is 680-476-50 = 154
If number of units produced is 45,
Fixed cost is 100
Variable cost is 14*45 = 630
Revenue is 20*45 = 900.
So, profit is 900-630-100 = 170
So, the profit per unit is maximized when the number of units produced is 34

If the fixed cost of production goes up by Rs. 40, then what is the minimum number of units that need to be manufactured to make sure that there is no loss?
The revenue of 50 units is 1000. So, the revenue per unit is 20.
The variable cost of 50 units is 700. So, the variable cost per unit is 14.
As fixed cost went up by 40 units, the total fixed cost (when number of units is less than 34) is 50+40 = 90
Let the minimum number of units that are needed to be produced to ensure that there is no loss be X.
So, 20X $$\leq$$ 14X + 90
Or X $$\leq$$ 15
So, the least possible number of units to be produced to ensure no loss is 15.
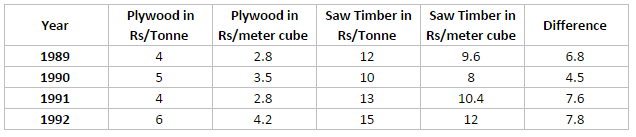
Answer the questions based on the following information. In the following chart, the price of logs shown is per cubic metre that of plywood and saw timber is per tonne.
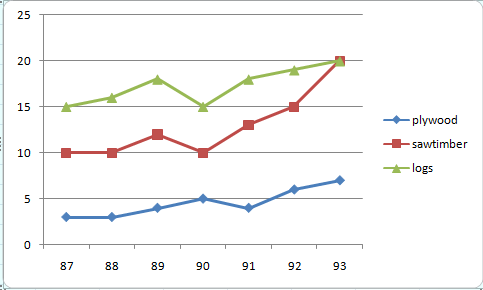
What is the maximum percentage increase in price per cubic metre or per tonne over the previous year?
The maximum percentage increase in price of logs happened in the year 1991 (compared to 1990) and equaled 18/15 - 1 = 20%
The maximum percentage increase in price of plywood happened in the year 1992 (compared to 1991) and equaled 6/4 - 1 = 50%
The maximum percentage increase in price of sawtimber happened in the year 1993 (compared to 1992) and equaled 20/15 - 1 = 33.33%
Hence, the correct answer is 50%
Which product shows the maximum percentage increase in price over the period?
The percentage increase in price of logs over the period of time equals 20/15-1 = 33.33%
The percentage increase in price of plywood over the period of time equals 7/3 - 1 = 133.33%
The percentage increase in price of sawtimber over the period of time equals 200/100 - 1 = 100%
Hence, the maximum percentage increase in price over the period of time happened with plywood.

If the prices of sawtimber increased by 33.33%, in which year was the difference in prices of one tonne of saw timber and one cubic metre of logs the least?
After an increase by 33%, the difference in the prices of one tonne of saw timber and one cubic metre of logs is given below according to the respective years.
The difference in 1987 is 15 - 10*133.33% = 1.67
The difference in 1988 is 16 - 10*133.33% = 2.67
The difference in 1989 is 17.5 - 12*133.33% = 1.5
The difference in 1990 is 15 - 10*133.33% = 1.67
The difference in 1991 is 17.5 - 12.5*133.33% = 0.833
The difference in 1992 is 18 - 15*133.33% = -2
The difference in 1993 is 20 - 20*133.33% = -6.67
Hence, the difference is least in the year 1991.
If one cubic metre = 700 kg for plywood and 800 kg for saw timber, find in which year was the difference in the prices of plywood and saw timber (per cubic metre) the maximum?
From the above diagram, we can say that difference is highest in 1992.
If the volume sales of plywood, saw timber and logs were 40%, 30% and 30% respectively, then what was the average realisation in 1993 per cubic metre of sales? (Weight of one cubic metre of saw dust and plywood both = 800 kg)
In 1993, price of logs = Rs. 20 per cubic metre.
volume sales of plywood, saw timber and logs were 40%, 30% and 30%
In 1993, price of plywood = Rs. 7 per tonne
In 1993, price of plywood = Rs. 20 per tonne
Weight of one cubic metre of saw dust and plywood both = 800 kg
1 tonne=1000kg
Price of 1000kg of plywood= Rs 7
Price of 800kg( 1 m$$^3$$)= 7 x 0.8 = Rs 5.6 per cubic metre.
Price of saw timber = 20 x 0.8 = Rs 16 per cubic metre.
We know that the sales volume of plywood, saw timber and logs are in the ratio 4 : 3 : 3.
Thus, the average realization must be the weighted avg of these three-
$$\frac{(4\times 5.6)+(3 \times 16)+(3 \times 20)}{4+3+3}$$
=13.1
= Rs. 13 (Approximately)

In the previous question, if in 1994, prices increased by 5%, 1% and 10% while the volume sales break-up was 40%, 30% and 30% for plywood, saw timber and logs respectively, then what was the average realisation?
In this case the average realization will be-
$$\frac{(4\times 5.26 \times 1.05)+(3 \times 14.28 \times 1.01)+(3 \times 20 \times 1.1)}{4+3+3} \approx 13.15$$
Find the length of AB if $$\angle YBC = \angle CAX = \angle YOX = 90$$.
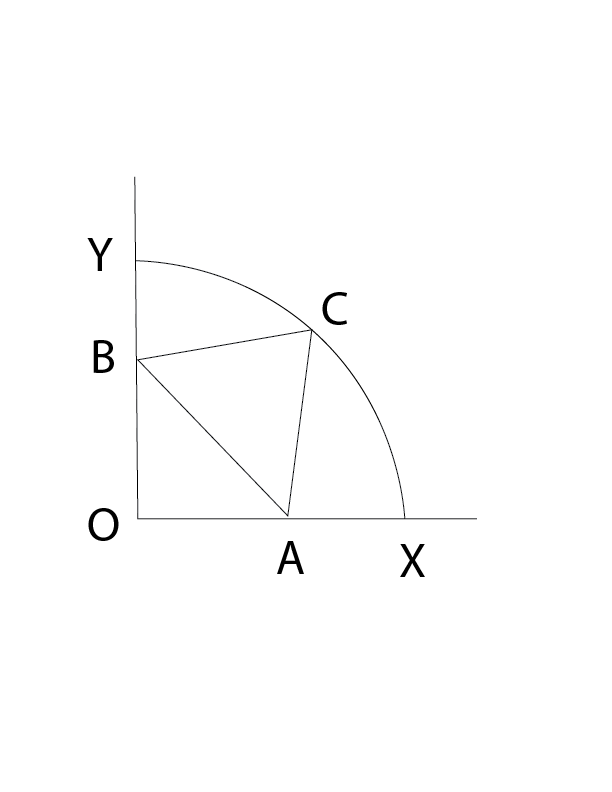
I. Radius of the arc is given.
II. OA = 5
Only statement A: Angles OAC, ACB, CBO are right angles => OACB is a rectangle. OC = AB and OC is radius => AB is equal to radius. Hence, we can find the answer using statement A only.
Only statement B: The point B can change even though the point A s fixed at a distance of 5 units on x-axis from origin. Hence, length of AB changes => We cannot find the answer using statement B only.
Is n odd?
I. n is divisible by 3, 5, 7 and 9.
II. 0 < n < 400
Let's consider the statements one by one.
Statement 1: n is a multiple of HCF(3,5,7,9) = 315. Hence, n can be 315, 630, 945 .... Hence we cannot say if n is odd or even.
Statement 2: 0<n<400, we cannot say if n is odd or even.
Taking both statements together, n=315. Hence, it is odd.
Thus the question can be answered using both statements together.

Find $$2 \circledast 3$$, where $$2\circledast 3$$ need not be equal to $$3\circledast2$$
I. $$1 \circledast 2$$=3
II. $$a \circledast b=\frac{a+b}{a}$$, where a and b are positive.
The definition of the given function is expressed in statement 2, where $$a \circledast b=\frac{a+b}{a}$$
Hence $$2\circledast3=\frac{2+3}{2}$$.
Hence the answer can be determined by b alone. A does not give any releant information.
Radha and Rani appeared in an examination. What was the total number of questions?
I. Radha and Rani together solved 20% of the paper.
II. Radha alone solved 5/3 rd of the paper solved by Rani.
Let the total questions be x and the questions solved by Radha and Rani be y and z respectively.
According to the first statement, y+z = 20% of x
Accoding to the second statement, y = 5/3rd of z
There are 2 equations and three variables. Hence the solution cannot be determined.
What is the price of tea?
I. Price of coffee is Rs. 5 more than that of tea.
II. Price of coffee was Rs. 5 less than the price of a cold drink which cost three times the price of tea.
Let price of tea be t, coffee be c and cold drink be d.
Statement 1: c=t+5, we cannot infer value of t from this information
Statement 2: c=d-5 and d=3t, we cannot infer the value of t from this information
Using the statements together, c=t+5 and c=3t-5.
=>t+5=3t-5
=>2t=10
=> t=5
Hence, we can answer the questions using both statements together.

What is the value of ‘a’?
I. Ratio of a and b is 3 : 5, where b is positive.
II. Ratio of 2a and b is 10 12 , where a is positive.
We cannot uniquely determine a value for a using either statement alone.
Using both statements together, we get an inconsistent set of equations. Hence, there is no solution using both statements together.
Thus, the question cannot be answered using both statements together.
In a group of 150 students, find the number of girls.
I. Each girl was given 50 paise, while each boy was given 25 paise to purchase goods totaling Rs. 49.
II. Girls and boys were given 30 paise each to buy goods totalling Rs. 45.
Let the number of girls be g and boys be b. Hence, b+g=150
Statement 1: 50g+25b=4900 => 2g+b=196. Solving the two equations, g=46. Hence, answer can be obtained using statement 1 alone.
Statement 2: 30b+30g=4500 => b+g=150. As both the equations are equal, we cannot find a unique solution.
Thus, the question can be answered using one of the statements alone and not the other.
There are four envelopes — E1, E2, E3 and E4 — in which one was supposed to put letters L1, L2, L3 and L4 meant for persons C1, C2, C3 and C4 respectively, but by mistake the letters got jumbled up and went in wrong envelopes. Now if C2 is allowed to open an envelope at random, then how will he identify the envelope containing the letter for him?
I. L2 has been put in E1.
II. The letter belonging to C3 has gone in the correct envelope.
From the statements we need to infer which envelope contains L2.
From statement 1, we know that C2 should open E1.
From statement 2, we cannot tell which envelope contains L2.
Hence, the question can be answered using one of the statements alone and not the other.

There are four racks numbered 1, 2, 3, 4 and four books numbered 1, 2, 3, 4. If an even rack has to contain an odd-numbered book and an odd rack contains an even-numbered book, then what is the position of book 4?
I. Second book has been put in third rack.
II. Third book has been put in second rack.
Let's take the two statements individually:
Statement 1: If the second book is in Rack 3, then the fourth book must be in the only remaining odd numbered rack i.e. rack 1. Hence, we can infer the position of book 4 using the first statement.
Statement 2: If the third book is in Rack 2, then the first book must be in Rack 4. However, we don't know anything about the position of Book 4. Hence, we cannot infer the position of book 4 using the second statement.
Hence, the question can be answered using one of the statements but not the other.
Find the value of X in terms of ‘a’.
I. Arithmetic mean of X and Y is ’a’ while the geometric mean is also ‘a’.
II. Y X = R; X - Y = D.
Statement 1: a = (X+Y)/2 and $$a^2 = XY$$. Hence, $$a=(X+a^2/X)/2$$. Hence, we can re-arrange the equation to represent X in terms of a
Statement 2: There is no relation given between X and a. Hence, we cannot find value of X in terms of a.
Hence, the question can be answered by one statement alone and not the other.
There are two concentric circles C1 and C2 with radii r1 and r2. The circles are such that C1 fully encloses C2. Then what is the radius of C1?
I. The difference of their circumference is k cm.
II. The difference of their areas is m sq. cm.
We know that r1>r2.
Statement 1: $$2\pi(r1-r2) $$ = k. We cannot determine r1 from this information
Statement 2: $$\pi(r1^2-r2^2)$$ = m. We cannot determine r1 from this information.
Using both statements together, (r1+r2)/2 = m/k. We now have two linear equations with two variables. Hence, we can determine the value of r1 in terms of m and k.
Hence, the answer can be found using both statements together.

A circle circumscribes a square. What is the area of the square?
I. Radius of the circle is given.
II. Length of the tangent from a point 5 cm away from the centre of the circle is given.
As the circle circumscribes the square, diameter of the circle= diagonal of the square. Let the side of the circle be s. If we can determine the value of s, then we can find the area of the square $$s^2$$.
Statement 1: Let the radius be r. 2r = $$s \sqrt{2}$$. Hence, s = $$r\sqrt{2}$$. Thus, we can find the area of the circle using this information.
Statement 2: This scenario can be drawn as shown below:
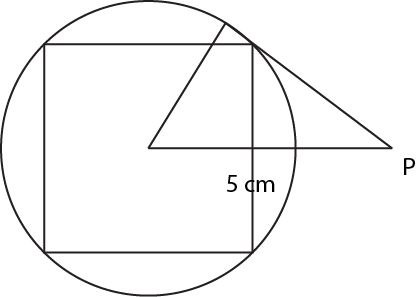
A line drawn from the center of the circle intersects the tangent at an angle of 90°. Hence, the triangle formed is a right-angled triangle with the hypotenuse of 5 cm, one side equal to the radius of the circle and second side equal to the length of the tangent. If the length of the tangent is known then we can calculate the radius using Pythogoras theorem. If the radius is known, the area of the square can be calculated as shown above.
A company has a job to prepare certain number cans and there are three machines A, B and C for this job. A can complete the job in 3 days, B can complete the job in 4 days, and C can complete the job in 6 days. How many days will the company take to complete the job if all the machines are used simultaneously?
If they work together, then total work done in single day = $$\frac{1}{3} + \frac{1}{4} + \frac{1}{6} = \frac{9}{12}$$
So $$\frac{9}{12}$$ work is done in 1 day
Hence unit work will be done in $$\frac{12}{9}$$ or $$\frac{4}{3}$$ days.
$$n^3$$ is odd. Which of the following statement(s) is/are true?
I. $$n$$ is odd.
II.$$n^2$$ is odd.
III.$$n^2$$ is even.
if $$n^3$$ is odd then $$n$$ will be odd. let's say it is $$2k+1$$
then $$n^2$$ will be = $$(4k^2 + 4k + 1)$$ which will be odd
Hence answer will be C.

Answer the questions based on the following information. Production pattern for number of units (in cubic feet) per day.

The finished goods are to be transported to the market by a truck having a capacity of 2000 cubic feet. Any finished goods (ready at the end of the day) retained overnight at the factory will incur a storage cost of Rs 5 per cubic foot for each night of storage. The hiring cost for the truck is Rs 1000 per day.
If all the units should be sent to the market, then on which days should the trucks be hired to minimize the cost?
The truck should be sent on a day on which maximum number of units can be sent. It happens on 2nd, 4th, 5th and 7th day. Hence the answer is b.
If the storage cost is reduced to Re 0.80 per cubic feet per day, then on which day(s), should the truck be hired?
If the truck is hired only for the 7th day, the cost will be (150*6 + 180*5 + 120*4 + 250*3 + 160*2 + 120)*0.8 = 2776
So, total cost incurred = 2776 + 1000 = 3776
If a truck is hired on 4th day and 7th day, the cost incurred will be (150*3 + 180*2 + 120)*0.8 + 1000 + (160*2 + 120)*0.8 + 1000 = 3096
So, a truck should be hired on the 4th and 7th day.
One bacterium splits into eight bacteria of the next generation. But due to environmental condition only 50% survives and remaining 50% dies. If the seventh generation number is 4,096 million, what is the number in first generation?
let's say x is the initial number of bacterias :
So in 2nd generation no. of bacterias = $$\frac{8x}{2} = 4x$$
In 3rd generation, it will be = 16x
4th gen. = 64x
5th gen. = 256x
6th gen. = 1024x
7th gen. = 4096x
Hence x = 1 million

Three circles, each of radius 20, have centres at P, Q and R. Further, AB = 5, CD = 10 and EF = 12. What is the perimeter of ΔPQR ?
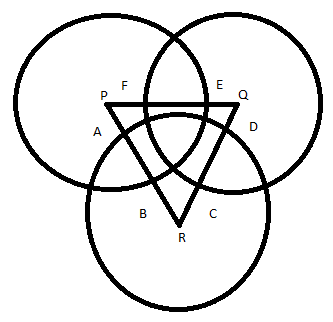
As radius of circle is 20, lengths of PR, QR and PQ will be (15+5+15) , (10+10+10) , (8+12+8) respectively.
So perimeter will be = 28 + 30 + 35 = 93
Answer the questions based on the following information. The following operations are defined for real numbers.
a # b=a + b, if a and b both are positive else a # b=1
a $$\triangledown$$ b=$$(a \times b)^{a+b}$$ if $$a\times\ b$$ is positive else a $$\triangledown$$b=1.
$$\frac{(2\#1)}{(1 \triangledown 2)}$$ =
$$2\#1 = 2+1 = 3$$
$$1 \triangledown 2 = (1 \times 2)^(1+2) = 2^3$$
So answer will be $$\frac{3}{8}$$
$$\frac{((1\#1) \# 2) - (10^{1.3} \triangledown \log_{10}{0.1})}{1 \triangledown 2}$$
$$((1\#1) \# 2) = 2 \# 2 = 4$$
$$\log_{10} 0.1$$ = $$\log_{10} 10^{-1}$$ = -1
As $$(10^{1.3} \times -1)$$ is not positive, $$(10^{1.3} \triangledown \log_{10}{0.1})$$ = 1
$$1 \triangledown 2$$ = $$(1x2)^{(1+2)}$$ = $$2^3$$ = 8
Hence, the fraction is (4-1)/8 = 3/8
$$(BE)^2 = MPB$$, where B, E, M and P are distinct integers. Then M =
A digit number when squared produces a 3 digit number. This means that the number ranges from [10, 31].
First digit of $$BE^2$$ should be unit digit of $$E^2$$. But unit digit of $$E^2$$ is B. Look at the numbers and the unit digit of their square.
0-0, 1-1, 2-4, 3-9, 4-6, 5-5, 6-6, 7-9, 8-4, 9-1. Only 2-4, 3-9, 4-6, 7-9, 8-4 and 9-1 are kind of pairs we are looking after.But all the pairs except 9-1 produce a number greater than 31. Now, the number we can form from 9-1 is 19 whose square is 361 which satisfies all the condition we are looking for. This is the only such number.
Five-digit numbers are formed using only 0, 1, 2, 3, 4 exactly once. What is the difference between the maximum and minimum number that can be formed?
Maximum five digit number which can be formed by using numbers is 43210
And minimum five digit number = 10234
Difference = 43210 - 10234 = 32976
How many five digit numbers can be formed from 1, 2, 3, 4, 5, without repetition, when the digit at the unit’s place must be greater than that in the ten’s place?
Possible numbers with unit's place as 5 = $$4 \times 3 \times 2 \times 1 = 24$$
Possible numbers with unit's place as 4 and ten's place 3,2,1 = $$3 \times 3 \times 2 \times 1 = 18$$
Possible numbers with unit's place as 3 and ten's place 2,1 = $$2 \times 3 \times 2 \times 1 = 12$$
Possible numbers with unit's place as 3 and ten's place 1 = $$1 \times 3 \times 2 \times 1 = 6$$
Total possible values = 24+18+12+6 = 60

Distance between A and B is 72 km. Two men started walking from A and B at the same time towards each other. The person who started from A travelled uniformly with average speed of 4 km/hr. While the other man travelled with varying speed as follows: in the first hour his speed was 2 km/hr, in the second hour it was 2.5 km/hr, in the third hour it was 3 km/hr, and so on. When will they meet each other?
In the first hour, they cover 6km. In the second hour they cover 6.5km. In the third hour, they cover 7km and so on.
Finally, they cover 72km in 9 hours.
Distance covered by A in 9 hours = 4*9 = 36km
=> They meet mid-way between A and B.
P, Q, R and S are four statements. Relation between these statements is as follows.
I. If P is true, then Q must be true.
II. If Q is true, then R must be true.
III. If S is true, then either Q is false or R is false.
Which of the following must be true?
Options B,C and D are given vice-versa to given statements which is not necessarily true.
But according to option A, P is true, then Q and R will be true too but S will be false as for S, either Q or R should be false.
So answer will be A.
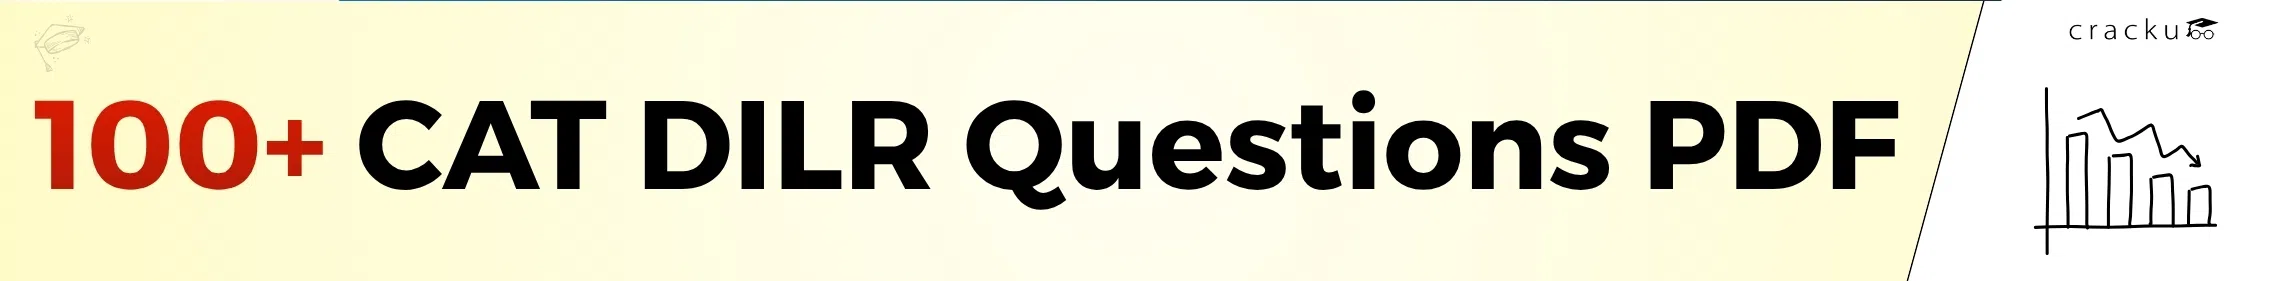
Answer the questions based on the following information. A cow is tethered at point A by a rope. Neither the rope nor the cow is allowed to enter ΔABC.
∠BAC = 30°
I(AB) = I(AC) = 10 m
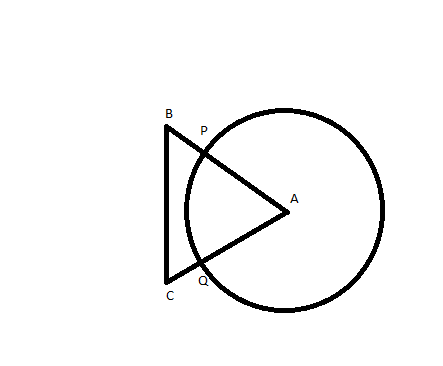
What is the area that can be grazed by the cow if the length of the rope is 8 m?

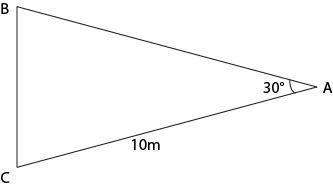
What is the area that can be grazed by the cow if the length of the rope is 12 m?
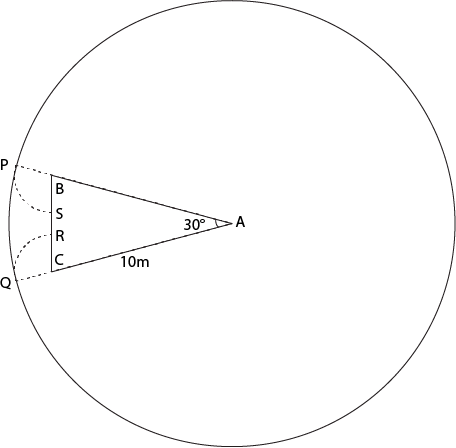
Area grazed by cow will be = Area of the larger circle - Sector APQ + Sector PBS + Sector CQR
Area of larger circle - Sector APQ = $$\pi r^2 - \frac{\pi r^2}{12}$$ = $$132 \pi$$
Sectors PBS and CQR are symmetrical and hence will have equal area.
In triangle ABC, AB = AC => ABC is isosceles triangle.
As A = 30° => B = C =75°
Hence, angle PBS = 180-75 = 105°
Hence, Area of sector PBS = 105/360 * $$\pi * 2^2$$ = $$ 7 \pi / 6$$
Thus area that can be grazed by the cow = $$132 \pi + 2*7 \pi /6$$ = $$403\pi /3$$
Which of the following must be false?
Among all positions for A, if it has first position then either B will be at the 3rd position or C and D will be together which is not possible Hence answer will be A) .
If A is not at the third place, then which of the following options does C have?
If A is not at the third place, then it has only two choices either 2nd or 4th position
So if A is at 2nd position, then B has only fourth position as choice and C can have either first or third position.
And if A is at 4th position, then B has only 2nd position and again C can have either first or third position.
Hence answer will be C.

If A and B are together, then which of the following must be necessarily true?
If A and B are together, then it can't be at first and second place as C and D will be together which is not possible.
Now if A can be at third place and B is at second place then C and D can be placed accordingly.
Answer will be B).
A yearly payment to the servant is Rs. 90 plus one turban. The servant leaves the job after 9 months and receives Rs. 65 and a turban. Then find the price of the turban.
Let's say price of turban is x.
So total price for 12 months will be = $$90+x$$
total price for 9 months = $$\frac{(90+x) \times 9}{12} = (65+x) $$
By solving above equation, we will get value of x= 10.
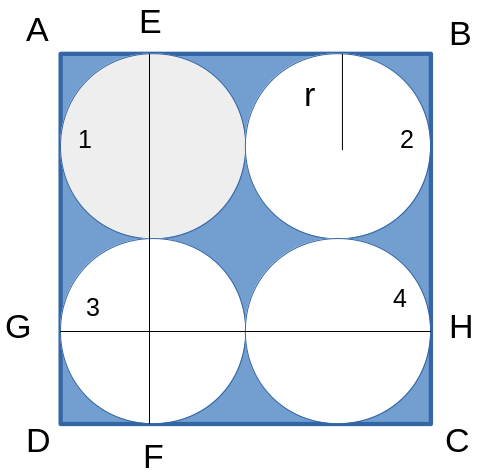
Four identical coins are placed in a square. For each coin the ratio of area to circumference is same as the ratio of circumference to area. Then find the area of the square that is not covered by the coins.
$$\frac{(\pi r^2)}{2 \pi r}$$ = $$\frac{2 \pi r}{ \pi r^2}$$
So r = 2
Hence required area = (Area of square) - (Area of 4 circles)
= $$(8^2) - (4 \pi (2^2))$$ (As side of square will be 4*2 = 8)
= $$16 (4- \pi)$$
The intended diagram can be drawn as follows:
ABCD is the square and the coins are placed (numbered 1,2,3,4)

Three wheels can complete 60, 36 and 24 revolutions per minute. There is a red spot on each wheel that touches the ground at time zero. After how much time, all these spots will simultaneously touch the ground again?
The first wheel completes a revolution in $$\frac{60}{60}=1$$ second
The second wheel completes a revolution in $$\frac{60}{36}=1\frac{2}{3}$$ second
The third wheel completes a revolution in $$\frac{60}{24}=2\frac{1}{2}$$ second
The three wheels touch the ground simultaneously at time which are multiples of the above three times.
Hence, the required number is $$LCM(1,\frac{5}{3},\frac{5}{2}) = 5$$ seconds.
So, the correct option is option (c)
A certain number, when divided by 899, leaves a remainder 63. Find the remainder when the same number is divided by 29.
Let's say N is our number
N = (899K + 63) or N = ($$29 \times 31$$K) + 63
So when it is divided by 29, remainder will be $$\frac{63}{29}$$ = 5
A is the set of positive integers such that when divided by 2, 3, 4, 5, 6 leaves the remainders 1, 2, 3, 4, 5 respectively. How many integers between 0 and 100 belong to set A?
Let the number 'n' belong to the set A.
Hence, the remainder when n is divided by 2 is 1
The remainder when n is divided by 3 is 2
The remainder when n is divided by 4 is 3
The remainder when n is divided by 5 is 4 and
The remainder when n is divided by 6 is 5
So, when (n+1) is divisible by 2,3,4,5 and 6.
Hence, (n+1) is of the form 60k for some natural number k.
And n is of the form 60k-1
Between numbers 0 and 100, only 59 is of the form above and hence the correct answer is 1
The maximum number of coins collected by any one of them cannot exceed
As least number of coin, one can have is 10
And no two of them possess same number of coins, hence for having maximum number of coins to one person, the distribution of coins will be = 10,12,14,64
maximum no. of coins = 64
If A collected 54 coins, then the difference in the number of coins between the one who collected maximum number of coins and the one who collected the second highest number of coins must be at least
If A collected 54 coins, remaining will be 46.
Now B,C,D must have atleast 10,12,14 coins
So remaining coins will be 10
So difference between maximum and second maximum should be least when second highest will be as maximum as possible.
I.e. difference = 54- (14+10) = 30
If A collected 54 coins and B collected two more coins than twice the number of coins collected by C, then the number of coins collected by B could be
Number of coins with A = 54
Number of coins with B = 2x+2
Number of coins with C = x
Number of coins with D = y
54+3x+2+y = 100
3x+y = 44
If 2x+2 = 28, then x = 13 and y = 5 which is not possible.
If 2x+2 = 20, then x = 9 which is not possible.
If 2x+2 = 26, then x = 12 and y = 8 which is not possible
If 2x+2 = 22, then x = 10 and y = 14 which is feasible
If Akbar and Anthony wear the same colour of shirts, then which of the following is not true?
Akbar can wear either red or blue.
Anthony can wear either red or green.
So when both of them wear same colour that has to be red.
And Amar can wear either blue or green.
Hence our answer will be A.
If two of them wear the same colour, then how many of the following must be false?
I. Amar wears blue and Akbar does not wear green
II. Amar does not wear blue and Akbar wears blue
III. Amar does not wear blue and Akbar does not wear blue
IV. Amar wears green, Akbar does not wear red, Anthony does not wear green
The different possible cases are:

From the table we can see among all of the statements, only fourth statement is false, as if amar wears green, anthony has to wear green.
Number of students who have opted for subjects A, B and C are 60, 84 and 108 respectively. The examination is to be conducted for these students such that only the students of the same subject are allowed in one room. Also the number of students in each room must be same. What is the minimum number of rooms that should be arranged to meet all these conditions?
As we can see here that total number of students are = 60+84+108 = 252
Now given condition is that in one room only the students of the same subject can be there and the number of rooms should be minimum that means the number of students in a particular room will be maximum.
This Maximum number of students will be HCF (Highest common factor) of 60, 84 and 108 and that will be 12
Hence, number of rooms will be = 252/12 = 21
How many five-digit numbers can be formed using the digits 2, 3, 8, 7, 5 exactly once such that the number is divisible by 125?
As we know for a number to be divisible by 125, its last three digits should be divisible by 125
So for a five digit number, with digits 2,3,8,7,5 its last three digits should be 875 and 375
Hence only 4 numbers are possible with its three digits as 875 and 375
I.e. 23875, 32875, 28375, 82375
You can collect as many rubies and emeralds as you can. Each ruby is worth Rs. 4 crore and each emerald is worth Rs. 5 crore. Each ruby weighs 0.3 kg. And each emerald weighs 0.4 kg. Your bag can carry at the most 12 kg. What should you collect to get the maximum wealth?
Let's say number of rubbies are x and emeralds are y.
So 0.3x + 0.4y = 12
And total wealth = 4x+5y
Now putting value of x from eq.1 to eq.2
i.e. total wealth = 4(12-0.4y)/0.3 + 5y
Now for maximizing total wealth y should be equal to zero.
Hence x = 40
I have one-rupee coins, 50-paisa coins and 25-paisa coins. The number of coins are in the ratio 2.5 : 3 : 4. If the total amount with me is Rs. 210, find the number of one-rupee coins.
Let's say number of coins are 2.5x , 3x and 4x
So total amount will be = 2.5x + 3x(0.5) + 4x(0.25) = 210
So x = 42
And number of 1 rs. coins = 2.5x = 105
My son adores chocolates. He likes biscuits. But he hates apples. I told him that he can buy as many chocolates he wishes. But then he must have biscuits twice the number of chocolates and should have apples more than biscuits and chocolates together. Each chocolate cost Re 1. The cost of apple is twice the chocolate and four biscuits are worth one apple. Then which of the following can be the amount that I spent on that evening on my son if number of chocolates, biscuits and apples brought were all integers?
When numbers of chocolates, biscuits and apples are integers.
Now let's say number of chocolates taken 1 , then biscuits will be 2 and apples can be 4,5,6,7
Hence minimum money that should be spent = 1+1+8 = 10 (Hence option C is cancelled)
Now when number of chocolates are 4
Biscuits will be 8
And apples can be 13,14,15....
Now total money spent can be 4+4+26 = 34 and more of it.
Hence answer will be A
Answer the following questions based on the following information.
A company purchases components A and B from Germany and USA respectively. A and B form 30% and 50% of the total production cost. Current gain is 20%. Due to change in the international scenario, cost of the German mark increased by 30% and that of USA dollar increased by 22%. Due to market conditions, the selling price cannot be increased by more than 10%.
What is the maximum current gain possible?
Let the total production cost be 100.
Hence, selling price is 120.
Price of German component A is 30 and the price of the US component B is 50
After change in exchange rate, price of German component is 30*1.3 = 39
and price of US component is 50*1.22=61
Total increase equals 39+61-30-50 = 20
Hence, the minimum production cost is 100+20=120
The maximum possible selling price is 120*110% = 132.
So, maximum possible gain is (132-120)/120 = 10%
If the USA dollar becomes cheap by 12% over its original cost and the cost of German mark increased by 20%, what will be the gain? (The selling price is not altered.)
Let the total production cost be 100.
Hence, selling price is 120.
Price of German component A is 30 and the price of the US component B is 50
After change in exchange rate, price of German component is 30*1.2 = 36
and price of US component is 50*0.88=44
Total increase equals (36+44)-(30+50) = 0
Hence, the total production cost did not change.
As the selling price also did not change, the gain percentage equals 20%
Who wore the red saree?
Since the people wearing yellow saree and the white saree were at the ends, Ms West Bengal was not sitting at one of the ends and was not a runner up, the arrangement is as shown below:

Ms. West Bengal was sitting adjacent to
Since the people wearing yellow saree and the white saree were at the ends, Ms West Bengal was not sitting at one of the ends and was not a runner up, the arrangement is as shown below:

Which saree was worn by Ms Andhra Pradesh?
Since the people wearing yellow saree and the white saree were at the ends, Ms West Bengal was not sitting at one of the ends and was not a runner up, the arrangement is as shown below:

Who was the runner-up?
Since the people wearing yellow saree and the white saree were at the ends, Ms West Bengal was not sitting at one of the ends and was not a runner up, the arrangement is as shown below:

I started climbing up the hill at 6 a.m. and reached the top of the temple at 6 p.m. Next day I started coming down at 6 a.m. and reached the foothill at 6 p.m. I walked on the same road. The road is so short that only one person can walk on it. Although I varied my pace on my way, I never stopped on my way. Then which of the following must be true?
The total time taken for both the journeys is the same. So, a) is incorrect. If he goes with the same speed both ways, he would've been at the same point at noon on both days. So, d) is incorrect. If he does not travel with the same speed in both the directions, he need not be at the same spot at noon. So, option b) is incorrect. Option c) is the correct answer.
What is the digit in the unit’s place of $$2^{51}$$?
The last digit of powers of 2 follow a pattern as given below.
The last digit of $$2^1$$ is 2
The last digit of $$2^2$$ is 4
The last digit of $$2^3$$ is 8
The last digit of $$2^4$$ is 6
The last digit of $$2^5$$ is 2
The last digit of $$2^6$$ is 4
The last digit of $$2^7$$ is 8
The last digit of $$2^8$$ is 6
Hence, the last digit of $$2^{51}$$ is 8
There are two containers: the first contains 500 ml of alcohol, while the second contains 500 ml of water. Three cups of alcohol from the first container is taken out and is mixed well in the second container. Then three cups of this mixture is taken out and is mixed in the first container. Let A denote the proportion of water in the first container and B denote the proportion of alcohol in the second container. Then,
Let the volume of the cup be V.
Hence, after removing three cups of alcohol from the first container,
Volume of alcohol in the first container is 500-3V
Volume of water in the second container is 500 and volume of alcohol in the second container is 3V.
So, in each cup, the amount of water contained is $$\frac{500}{500+3V}*V$$
Hence, after adding back 3 cups of the mixture, amount of water in the first container is $$0+\frac{1500V}{500+3V} $$
Amount of alcohol contained in the second container is $$3V - \frac{9V^2}{500+3V} = \frac{1500V}{500+3V}$$
So, the required proportion of water in the first container and alcohol in the second container are equal.
A number is formed by writing first 54 natural numbers next to each other as 12345678910111213 ... Find the remainder when this number is divided by 8.
For a number to be divisible by 8, last 3 digits must be divisible by 8.
Last 3 digits of this number are 354.
354 mod 8 = 2
Hence, 2 is the remainder.
A, B, C, D, ..., X, Y, Z are the players who participated in a tournament. Everyone played with every other player exactly once. A win scores 2 points, a draw scores 1 point and a loss scores 0 point. None of the matches ended in a draw. No two players scored the same score. At the end of the tournament, by ranking list is published which is in accordance with the alphabetical order. Then
The ranking list would be in the order A, B, C, D......., X, Y, Z. Now the A wins all his 25 matches, B wins 24 matches and lost to A. C wins 23 matches and lost to A and B. In this way N 12 matches and looses 13 matches to A,B,C,D....,M
Select the option that best replaces the phrase in quotes. British Airspace has been 'focusing on building European links'.
The best word to use for "links" is "forging".
Hence, "focusing on forging European links" is the correct phrase.
Select the option that best replaces the phrase in quotes. The appetite of banks for funds was lost under the onslaught of the slowdown, corporates refused to borrow even as 'bank deposits flourished'.
Bank deposits are countable. So they swell. They don't flourish. "To flourish" means to develop. The correct answer is option b.
Select the option that best replaces the phrase in quotes. The 8th-century revival of Byzantine learning is 'an inexplicable phenomenon', and its economic and military precursors have yet to be discovered.
There is no error in the given sentence. "An inexplicable phenomenon" means a phenomenon which cannot be explained. So the usage is contextually as well as grammatically correct.
Select the option that best replaces the phrase in quotes. The management can still hire freely but 'cannot scold freely'.
"cannot scold freely" means "cannot scold whenever the management want". This can be replaced by "cannot scold at will."
Select the option that best replaces the phrase in quotes.
Many people mistake familiarity for a vulgar style, and suppose that to write without affectation 'is to write at random speed'.
Option C and Option D are incorrect as the author talks about writing without affectation i.e. writing without any pretension. Hence, it can be mistaken for writing without consideration or care and not writing fast.
Between options A and B, A contains the correct phrase 'at random'. The phrase means without a care and in a disorderly manner. "Writing randomly" does not carry the same implication. Also, here the modifier 'random' is a misplaced modifier. It is modifying the way of writing instead of modifying what is written.
Fill in the blanks: Football evokes a ___ response in India compared to cricket, that almost ___ the nation.
Lukewarm is the correct usage in the first blank as it means not entusiastic. "Electifies" correctly matches the second blank. Hence the correct option is B.
Fill in the blanks: Social studies, science matters of health and safety, the very atmosphere of the classroom —these areas are few of the ___ for the ___ of proper emotional reactions.
Option A is incorrect as in the usage of "these areas", things cannot be used. Similarly option C is incorrect. Option B is incorrect because"basis of proper emotional reaction" is an incorrect usage.
Fill in the blanks: When children become more experienced with words as visual symbols, they find that they can gain meaning without making ___ sounds.
Audible means which can be heard. Audible sounds means the sounds which can be heard..
Fill in the blanks: Learning is more efficient when it is ___. It is less efficient when it is ___.
The two set of words must be opposite to each other. Option A and D are correct in this case. But option A is contextually incorrec as learning cannot be fun if its is fast. The correct answer is D.
Fill in the blanks: To a greater or lesser degree all the civilized countries of the world are made up of a small class of rulers ___ and of a large class of subjects ___.
Option D is incorrect as it contradicts the statements as "rulers do not get ruled." Option A is contextually incorrect as it does not make any sense. Option B is incorrect as powerfully corrupt is grammatically incorrect. Option C is the best match.
Fill in the blanks: Simple arithmetic tells us that there is more ___ than ___.
Option C is incorrect as impracticality and knowledge cannot be related because they are totally different.
Option B is incorrect as improvisation means to perform spontaneously and improving means to get better which are not related.
Option D is contextually incorrect. Option A is correct as it talks about imitation and invention which are related terms.
Fill in the blanks: As a step towards protesting against the spiralling prices, the farmers have decided to stage a picket in an effort to ___.
Farmers face problems due to the spiralling prices. So they protest in order to make their pleas head. "Virility" means manliness which has no context in this passage. The protest need not curb the prices. It will make their pleas heard. "Topple the government" is an extreme form which does not demand merit in this passage. Option B is the correct answer.
Fill in the blanks: Science is a sort of news agency comparable ___ to other news agencies.
Option A is incorrect as principally is an incorrect usage. Principal means a chief which does not go in this context. Hencee C is incorrect. Among B and D, B is more suitable as in principle means in primary rule which goes with the tone of the passage.
Fill in the blanks:
Most political leaders acquire their position by causing a large number of people to believe that these leaders are ___ by altruistic desires.
Options B and C are incorrect as desires cannot convince or categorise people. Between options A and D, "actuated" which means motivated is a better fit as "led" is generally used for other people and not inanimate objects like "desires".
Fill in the blanks: Everyone will admit that swindling one's fellow beings is a necessary practice; upon it is based the really sound commercial success formula — ___.
Swindle means to use deception to deprive someone's possession. It means that you have an unequal exchange where you didn't give much of your possession and you robbed the other person of his/her possession. Option C summarises it correctly.
Arrange sentences A, B, C and D between sentences 1 and 6 to form a logical sequence of six sentences.
1. Buddhism is a way to salvation.
A. But Buddhism is more severely analytical.
B. In the Christian tradition there is also a concern for the fate of human society conceived as a whole, rather than merely as a sum or network of individuals.
C. Salvation is a property, or achievement of individuals.
D. Not only does it dissolve society into individuals, the individual in turn is dissolved into component parts and instants, a stream of events.
6. In modern terminology, Buddhist doctrine is reductionist.
Sentence C is the starting sentence as it talks about the as salvation. Sentence B is the next sentence as it mentions the traditions of christanity. A and D differentiates the Buddhism from Christanity. The correct order is CBAD.
Arrange sentences A, B, C and D between sentences 1 and 6 to form a logical sequence of six sentences.
1. The problem of improving Indian agriculture is both a sociological and an administrative one.
A. It also appears that there is a direct relationship between the size of a state and development.
B. The issues of Indian development, and the problem of India's agricultural sector, will remain with us long into the next century.
C. Without improving Indian agriculture, no liberalisation and delicensing will be able to help India.
D. At the end of the day, there has to be a ferment and movement of life and action in the vast segment of rural India.
6. When it starts marching, India will fly.
Statement A highlights the additional issue. Statement B substantiates A. Option C highlights the issues facing indian agriculture as mentioned in B. Option D is the last sentence as in 6, "it" refers to rural class.
Arrange sentences A, B, C and D between sentences 1 and 6 to form a logical sequence of six sentences.
1. Good literary magazines have always been good because of their editors.
A. Furthermore, to edit by committee, as it were, would prevent any magazine from finding its own identity.
B. The more quirky and idiosyncratic they have been, the better the magazine is, at least as a general rule.
C. But the number of editors one can have for a magazine should also be determined by the number of contributions to it.
D. To have four editors for an issue that contains only seven contributions, it is a bit silly to start with.
6. However, in spite of this anomaly, the magazine does acquire merit in its attempt to give a comprehensive view of the Indian literary scene as it is today.
The first sentence talks about magazines. The same idea is continued in sentence B. Hence, B follows the first sentence.
CD is a pair because the "number of editors" concept is introduced in C and then an example is taken in D.
Hence, BCDA is the answer.
Arrange sentences A, B, C and D between sentences 1 and 6 to form a logical sequence of six sentences.
1. It is the success story of the Indian expatriate in the US which today hogs much of the media coverage in India.
A. East and West, the twain have met quite comfortably in their person, thank you.
B. Especially in its more recent romancing — the-NRI phase.
C. Seldom does the price of getting there — more like not getting there — or what's going on behind those sunny smiles get so much media hype.
D. Well groomed, with their perfect Colgate smiles, and hair in place, they appear the picture of confidence which comes from having arrived.
6. The festival of feature films and documentaries made by Americans of Indian descent being screened this fortnight, goes a long way in filling those gaps.
The pronoun "it" in statement B refers to the media attention mentioned in statement 1. Hence, 1-B are a pair. Statements A and D describe the NRIs introduced in B and hence should come after B. As A concludes from the outward characteristics mentioned in D, it should follow D. C mentions the gap in information provided about NRIs and 6 mentions how the film festival is filling those gaps. Hence, C-6 are a pair. Hence, the order is 1BDAC6.
Arrange sentences A, B, C and D between sentences 1 and 6 to form a logical sequence of six sentences.
1. A market for Indian art has existed ever since the international art scene sprang to life.
A. But interest in architectural conceits is an unanticipated fallout of the Festivals of India of the '80s, which were designed to increase exports of Indian crafts.
B. Simultaneously, the Indian elite discarded their synthetic sarees and kitsch plastic furniture and a market came into being.
C. Western dealers, unhappy in a market afflicted by violent price fluctuations and unpredictable profit margins, began to look East, and found cheap antiques with irresistible appeal.
D. The fortunes of the Delhi supremos, the Jew Town dealers in Cochin and myriad others around the country were made.
6. A chain of command was established, from the local contacts to the provincial dealers and up to the big boys, who entertain the Italians and the French, cutting deals worth lakhs in warehouses worth crores.
C and B forms a pair as they illustrate simultaneous happenings- one where Western dealers began to look and East and their Indian counterpart discarded synthetic sarees and plastic furniture. Only C has both these sentences together. Thus, C is the correct answer.
Arrange the following sentences to form a coherent paragraph
A. He was carrying his jacket and walked with his head thrown back.
B. As Annette neared the lamp she saw a figure walking slowly.
C. For a while Michael walked on and she followed 20 paces behind.
D. With a mixture of terror and triumph of recognition she slackened her pace.
The opening sentence is B - it introduces the character the rest of the paragraph is talking about. This is followed by A, which describes the person. The next sentence is D, which talks about the reaction of Annette. The last sentence is C. So, the correct order of sentences is BADC. Option b) is the correct answer.
Arrange the following sentences to form a coherent paragraph
A. However, the real challenge today is in unlearning, which is much harder.
B. But the new world of business behaves differently from the world in which we grew up.
C. Learning is important for both people and organisations.
D. Each of us has a 'mental model' that we've used over the years to make sense.
Sentences A and B start with conjunctions. So, they cannot be used to open a paragraph. The best opening sentence is C. This is immediately followed by A, which gives a contradictory opinion to the one in C. A is followed by D which further explores the idea in A. The last sentence is B. So, option a) is the correct answer.
Arrange the following sentences to form a coherent paragraph
A. There was nothing quite like a heavy downpour of rain to make life worthwhile.
B. We reached the field, soaked to the skin, and surrounded it.
C. The wet, as far as he was concerned, was ideal.
D. There, sure enough, stood Claudius, looking like a debauched Roman emperor under a shower.
B is the best opening sentence - it talks about the setting of the scene. This is followed by D, which talks about what happened when they reached the field. This is then followed by C, which talks more about the person introduced in sentence D. The closing sentence is A. So, the correct order of sentences is BDCA. Option b) is the correct answer.
Arrange the following sentences to form a coherent paragraph
A. Alex had never been happy with his Indian origins.
B. He set about rectifying this grave injustice by making his house in his own image of a country manor.
C. Fate had been unfair to him; if he had had his wish, he would have been a count or an Earl on some English estate, or a medieval monarch in a chateau in France.
D. This illusion of misplaced grandeur, his wife felt, would be Alex's undoing.
The first sentence is A - it introduces the main character in the paragraph. This is followed by C, which gives a background about that person. B and D is a pair. 'This illusion' in D refers to Alex not being happy about his Indian origins - sentence B. So, the correct order of sentences is ACBD. Option c) is the correct answer.
Arrange the following sentences to form a coherent paragraph
A. The influence is reflected the most in beaded evening wear.
B. Increasingly, the influence of India's colours and cuts can be seen on western styles.
C. And even as Nehru jackets and Jodhpurs remain staples of the fashion world, designers such as Armani and McFadden have turned to the sleek silhouette of the churidar this year.
D. Indian hot pink, paprika and saffron continue to be popular colours, year in and year out.
B is the first sentence of the paragraph. It introduces the subject of the paragraph - the influence of Indian wear on the west. This is then followed by A, which talks about where the maximum influence is. D, which further elaborates the idea, follows A. The concluding sentence is C. Option a) is the correct answer.
Arrange the following sentences to form a coherent paragraph
A. Such a national policy will surely divide and never unite the people.
B. In fact, it suits the purpose of the politicians; they can drag the people into submission by appealing to them in the name of religion.
C. In order to inculcate the unquestioning belief they condemn the other states, which do not follow their religion.
D. The emergence of the theocratic states, where all types of crimes are committed in the name of religion, has revived the religion of the Middle Ages.
CA is a pair. The 'policy' in A refers to the condemnation of the states that do not follow a particular religion. The opening sentence of the paragraph is D and this is immediately followed by B. So, the order of sentences is DBCA. Option b) is the correct answer.
Arrange the following sentences to form a coherent paragraph
A. His left-hand concealed a blackjack, his right-hand groped for the torch in his pocket.
B. The meeting was scheduled for 9 o'clock, and his watch showed the time to be a quarter to nine.
C. The man lurked in the corner, away from the glare of light.
D. His heart thumped in his chest, sweat beads formed themselves on his forehead, his mouth was dry.
C is thee starting of the sentencee where the author talks about the situation of man and his appearence. Option A continues the tone of the appearence. Option B mentions the time due to which his heart thumped as mentioned in option D. Hence the sequence is CABD.
Arrange the following sentences to form a coherent paragraph
A. The director walked into the room and took a look around the class.
B. Mitch wanted to scream — the illogicality of the entire scene struck him dumb.
C. The managers stared at him with the look of fear that no democratic country should tolerate in its people.
D. He walked out of the room — it was his irrevocable protest against an insensible and insensitive situation.
AC is a pair. 'Him' in C refers to 'the director' in A. BD is also a pair. 'He' in D refers to 'Mitch' in B. Also, A is the best opening sentence. So, the correct order of sentences is ACBD. Option a) is the correct answer.
Arrange the following sentences to form a coherent paragraph
A. The establishment of the Third Reich influenced events in American history by starting a chain of events which culminated in war between Germany and the United States.
B. The Neutrality Acts of 1935 and 1936 prohibited trade with any belligerents or loans to them.
C. While speaking out against Hitler's atrocities, the American people generally favoured isolationist policies and neutrality.
D. The complete destruction of democracy, the persecution of Jews, the war on religion, the cruelty and barbarism of the allies, caused great indignation in this country and brought on fear of another World War.
Option A is the starting sentence where the author focuses on the start f hostility between Germany and USA. Option D continues the tone by stating the consequences. CB are mandatory pair if we look at the word "Neutrality". ADCB is the correct sequence.
Arrange the following sentences to form a coherent paragraph
A. An essay which appeals chiefly to the intellect is Francis Bacon's Of Studies.
B. His careful tripartite division of studies expressed succinctly in aphoristic prose demands the complete attention of the mind of the reader.
C. He considers studies as they should be; for pleasure, for self-improvement, for business.
D. He considers the evils of excess study: laziness, affectation, and preciosity.
A is the opening sentence. This is followed by B, which describes why the essay talked about in A appeals to the intellect. D should follow C. C talks about studies and D talks about 'excess' study. So, the correct order of sentences is ABCD. Option b) is the correct answer.
Arrange the following sentences to form a coherent paragraph
A. By reasoning we mean the mental process of drawing an inference from two or more statements or going from the inference to the statements, which yield that inference.
B. So logical reasoning covers those types of questions, which imply drawing an inference from the problems.
C. Logic means, if we take its original meaning, the science of valid reasoning.
D. Clearly, for understanding arguments and for drawing the inference correctly, it is necessary that we should understand the statements first.
C is the best opening sentence. It introduces the topic of the paragraph - logic. This is followed by A, which goes on to explain the meaning of reasoning. This is then followed by B, which explains 'logical reasoning'. The concluding sentence is D. The correct order of sentences is CABD. Option b) is the correct answer.
Select the pair of sentences that relates logically to the given statement. Either Sita is sick or she is careless.
A. Sita is not sick.
B. Sita is not careless.
C. Sita is sick.
D. Sita is careless.
Either Sita is sick or she is careless => Sita is sick or she is careless.
Consider the pair AD. A says "Sita is not sick". So, it implies that she is careless, which is what is mentioned in statement D. So, AD relate to the original sentence.
Select the pair of sentences that relates logically to the given statement. Ram gets a swollen nose whenever he eats hamburgers.
A. Ram gets a swollen nose.
B. Ram does not eat hamburgers.
C. Ram does not get a swollen nose.
D. Ram eats hamburgers.
The statement can be written as follows:
Ram eats a hamburger => Ram get a swollen nose
Ram did not get a swollen nose => Ram did not eat a hamburger
Option d) is the correct answer.
Select the pair of sentences that relates logically to the given statement. Either the employees have no confidence in the management or they are hostile by nature.
A. They are not hostile by nature.
B. They are hostile by nature.
C. They have confidence in the management.
D. They have no confidence in the management.
The members are either hostile or have no confidence.
Consider the pair of sentences CB.
C says the members have confidence in the management. So, they do not have 'no confidence' => The members should be hostile in nature, which is what statement B says. So, option b) is the correct answer.
Select the pair of sentences that relates logically to the given statement. Whenever Ram reads late into the night, his father beats him.
A. His father does not beat Ram.
B. Ram reads late into the night.
C. Ram reads early in the morning.
D. Ram's father beats him in the morning.
The sentence can be written as follows:
Ram reads late into the night => His father beats him
Ram's father did not beat him => Ram did not read late into the night
So, none of the pairs given in the options follow from the statement.
Select the pair of sentences that relates logically to the given statement. All irresponsible parents shout if their children do not cavort.
A. All irresponsible parents do not shout.
B. Children cavort.
C. Children do not cavort.
D. All irresponsible parents shout.
The statement can be written as follows:
Children do not cavort => Irresponsible parents shout
Irresponsible parents did not shout => Children cavorted
So, AB follows from the statement.
Choose the set in which the third statement is a logical conclusion of the first two.
A. Some Xs are Ps. Some Ps are Ys. Some Xs are Ys.
B. All Sonas are bright. Some bright are crazy. Some Sonas are crazy.
C. No faith is strong. Only strong have biceps. No faith has biceps.
D. All men are weak. Some weak are strong. Some strong are weak.
Statement A: There need not be an intersection between the sets Xs and Ys.
Statement B: There need not be an intersection between the sets Sonas and Crazy.
Statement D: Third statement follows only from the second statement.
The third statement in C follows from its first two statements.
Option b) is the correct answer.
Choose the set in which the third statement is a logical conclusion of the first two.
A. Some icicles are cycles. All cycles are men. Some icicles are men.
B. All girls are teeth. No teeth is yellow. No girls are yellow.
C. No hand is foot. Some foot are heads. Some hands are heads.
D. Every man has a wife. All wives are devoted. No devoted has a husband.
Statement A: Since all cycles are men and some iciles are cycles, it follows that some iciles are definitely men.
Statement B: Girls is a subset of Teeth. There is no intersection between the sets Teeth and Yellow. So, there is no intersection between the sets Girls and Yellow.
The third sentences in C and D need not necessarily follow from the respective first two statements. Option b) is the correct answer.
Choose the set in which the third statement is a logical conclusion of the first two.
A. No sun is not white. All moon is sun. All moon is white.
B. All windows are open. No open space is allocated. All window is closed space.
C. No German can fire. All Americans bombard. Both, Germans and Americans can fight.
D. No X is Z. No Z is Y. No X is Y.
Statement A: No sun is not white => All Sun is white. So, Sun is a subset of white. All moon is sun => Moon is a subset of Sun. So moon is a subset of white.
In none of the other three statements do the third sentences follow from the respective first two statements.
Option a) is the correct answer.
Choose the set in which the third statement is a logical conclusion of the first two.
A. All Ts are square. All squares are rectangular. All Ts are rectangular.
B. Some fat are elongated. Some elongated things are huge. Some fat are huge.
C. Idiots are bumblers. Bumblers fumble. Idiots fumble.
D. Water is good for health. Health foods are rare. Water is rare.
In both A and C the third statement is logically concuded. The reasoning is if A = B, B = C then A = C.
Similarly T's = Square, Square = Rectangle then T's = Rectangle.
Idiots = Bumblers, Bumblers = Fumble then Idiots = Fumble
Efficiency is all right in its place, in the shop, the factory, the store. The trouble with efficiency is that it wants to rule our play as well as our work; it won't be content to reign in the shop, it follows us home. It can be inferred from the above passage that
The author is of the opinion that one cannot limit efficiency to just work. It tends to affect a person's non-work life as well. In other words, efficiency can become all-pervading. Option a) is the correct answer.
In order to ease the traffic congestion, the transport planners decided to have a sophisticated system of elevated monorail travel in the city. However, it was pointed out by somebody that a metro rail system would be a more effective solution to the traffic problem. The plan was thus stalled. Moreover, since a budget had not been drawn up for the project, it was deemed fit to stall the work of the monorail for some time. In the meanwhile, the traffic planners of the city decided to build an efficient system of subways and flyovers in the city with the aim of easing the same problem. At the instant when the planners were preparing to award the contracts to the concerned parties, the transport planners came up with the contention that the subways interfered with the site of a pillar of the monorail system. The traffic planners had to give up the idea and think of other possible solutions.
Which of the following can we infer from the above passage?
Option A cannot be inferred as it is nowhere mentioned. Option B is not necessarily true. The two groups may not agree to each others plans even if they are friendly with each other. Thus, just from the fact that they opposed each others plans we cannot infer that there is contention between the two groups. From the paragraph, we can infer that neither of the two groups can proceed i.e. neither the traffic planners nor the transport planners can move ahead with any plan. Thus, both the parties are dead-locked. Hence, we can infer option C.
The company encourages its managers to interact regularly, without a pre-set agenda, to discuss issues concerning the company and society. This idea has been borrowed from the ancient Indian concept of religious congregation, called satsang. Designations are forgotten during these meetings; hence, it is not uncommon in these meetings to find a sales engineer questioning the CEO on some corporate policy or his knowledge of customers. Based on the information provided in the above passage, it can be inferred that
From the argument, we understand the following points: 1. The company is trying to instill the spirit of dialogue in its employees. 2. This dialogue is agnostic of position or title of the employee.
So, we can infer that the company believes in fostering the spirit of dialogue without degenerating it into a positioning based debate. Option B is the correct answer.
In option C, there is an assumption that the company had some inter-personal problems in the past. However, there is no such information in the passage from which we can infer the assumption. Also, we have to choose the answer according to the contents of the given paragraph. Therefore, option C is incorrect.
From Cochin to Shimla, the new culture vultures are tearing down acres of India's architectural treasures. Ancestral owners are often fobbed off with a few hundred rupees for an exquisitely carved door or window, which fetches fifty times that much from foreign dealers, and yet more from the drawing room sophisticates of Europe and the US. The reason for such shameless rape of the Indian architectural wealth can perhaps, not wrongly, be attributed to the unfortunate blend of activist disunity and the local indifference. It can be inferred from the above passage that
Option b) is incorrect because it says 'only' India is not proud of its culture, which is incorrect.
Option c) is incorrect because we cannot infer if 'most' Indian families have sold off their heirlooms.
Option d) is incorrect because the market is US and Europe and not India. India is the souce.
Option a) can be inferred.
Deepa Metha's Fire is under fire from the country's self-appointed moral police. Their contention is that the film is a violation of the Indian cultural mores and cannot be allowed to influence the Indian psyche. According to them, such films ruin the moral fabric of the nation, which must be protected and defended against such intrusions at all cost, even at the cost of cultural dictatorship.
Based on the information in the above passage, it can be inferred that
According to the paragraph, the moral police thinks that the movies are bound to affect the judgment of Indian audience and hence they need to censor the movie in order to preserve their already existing judgment and protect them from the influence of such a work.
Option B correctly summarizes the inference.
The dominant modern belief is that the soundest foundation of peace would be universal prosperity. One may look in vain for historical evidence that the rich have regularly been more peaceful than the poor, but then it can be argued that they have never felt secure against the poor; that their aggressiveness stemmed from fear; and that the situation would be quite different if everybody were rich. It can be inferred from the above passage that
The sentence is option b) is opposite to what the argument is conveying.
Option a) can be inferred. According to the argument, a lot of aggression has stemmed because the rich want to defend themselves against the poor. In other words, the aggression has stemmed from the desire of the haves to defend themselves against the have-nots.
The effect produced on the mind by travelling depends entirely on the mind of the traveller and on the way in which he conducts himself. The chief idea of one very common type of traveller is to see as many objects of interest as he possibly can. If he can only after his return home say that he has seen such and such temple, castle, picture gallery, or museum, he is perfectly satisfied. Far different is the effect of travels upon those who leave their country with a mind prepared by culture to feel intelligent admiration for all the beauties of nature and art to be found in foreign lands. When they visit a new place, instead of hurrying from temple to museum to picture gallery, they allow the spirit of the place to sink into their minds, and only visit such monuments as the time they have at their disposal allows them to contemplate without irreverent haste.
It can be inferred from the above passage that
According to the passage, the latter kind of travelers only visit such monuments as the time they have at their disposal allows them to contemplate without irreverent haste.
A is incorrect as the preference of the writer is not the main subject of focus.
B is way too harsh. This cannot be inferred from the passage.
C correctly describes the second kind of travelers.
Thus, C is the correct answer.
Whether we look at the intrinsic value of our literature, or at the particular situation of this country, we shall see the strongest reason to think that of all foreign tongues, the English tongue is that which would be the most useful to our native subjects. It can be inferred that
Option a) is incorrect because we cannot infer that the speaker is a colonist. The speaker could be a neutral observer. So, we cannot say that he has the good of the nation at heard. English is not an issue that is related only to the colonial empire. We cannot infer the statement in option c) also.
Option d) is the correct answer.
Where the film Bombay loses out is where every commercial film congenitally goes awry — becoming too simplistic to address serious issues and failing to translate real life to reel. Which of the following can be inferred from the above line?
Option a) is incorrect because 'translating from real life to reel' is the opinion of the author of the paragraph and not necessarily the opinion of the director. Similarly, option b) also cannot be inferred. There is nothing in the paragraph from which we can infer whether the movie was a success or a failure. Option d) is the correct answer.
Aspiration is nothing new. Neither is the debate over what the Indian middle class is, what it wants and what it buys. Since the mid-80s, that has been the focus of the economic policy papers so called pro- and anti-poor budgets and marketing strategies that have successfully broken the barrier of urban selling and reached deeper into rural India with increasing income levels and aspirations. Based on the above passage, it can be inferred that
There is nothing in the passage to suggest that the Indian middle class has been transformed to a 'pampered' middle class. Options b) and c) are incorrect. However, the paragraph strongly suggests that the Indian middle class has been the focus of the economic policies of the Government for a long time now. So, option a) can be inferred.
The narrator of Midnight's Children describes it as a kind of collective fantasy. I suppose what he, or I, through him was trying to say, was that there never had been a political entity called India until 1947. The thing that became independent had never previously existed, except that there had been an area, a zone called India. So it struck me that what was coming into being, this idea of a nation-state, was an invention. It was an invention of the nationalist movement. And a very successful invention.
One could argue that nation-states are a kind of collective fantasies. Very similar things happened with the unification of Italy, and also with the unification of Germany. The history of India is a history of independent nation-states. It is a history of Oudh or Bengal or Maratha kingdoms. All those independent histories agreed to collectivise themselves into the idea of the nation of India. In the case of Pakistan, it was less successful. Pakistan was under-imagined. It did not survive as a nation-state.
If you ask people in general, they would have absolutely no problem with the idea of India at all. I think, in a way the strength of the nationalist idea is shown by its ability to survive the extraordinary stresses that it was placed under. I think the stresses of things — communalism, the high degree of public corruption, of regional rivalries, of the tension between the centre and the state, the external pressures of bad relations with Pakistan — these are colossal pressures which any state could be forgiven for being damaged by. I think the thing to say about the success of the idea is that it remains an idea though people might not find it very easy to give a simple definition of it. But that it does exist and that it is something to which people feel they belong, I think is now the case. That it survives these stresses is an indication of its strength.
I'm not interested in an idealised, romantic vision of India, I know it is the great pitfall of the exile. So you know for me, always, the issue of writing about India has been not to write as an outsider. On the other hand, evidently something has changed in the last 10 years, which is that as a result of various circumstances, I've not been able to return. All I can say is that I have felt it as the most profound loss and I still do. There have been many losses in the last decade but the loss of the easy return to India has been for me an absolute anguish, an inescapable anguish. I feel as if I've lost a limb. I am very anxious to bring that period to an end.
I do not think that one of the most interesting phenomena for India as a country is the phenomenon of the Indian Diaspora. I often think Indian — Indian Indians — find that very hard to understand. In England, when people call themselves British Indian, they mean both halves of that. And yet, what it means to be a British Indian is very alien to an Indian Indian. The same is true in the Caribbean, in Africa, in Canada, in the United States, and so on. The thing that has interested me is that there are now many, many ways of being something which you can legitimately call Indian. Being an Indian in India is just one of those ways.
The forces of disintegration are always there. I think in every society there is the tension between the forces that bring it together and the forces that pull it apart. I'm worried, above all, of the communal issue because half a century is no time at all in the eye of history, and half a century ago something of colossally horrible proportion took place. The fact that it hasn't happened for 50 years on quite the same scale means nothing. It could still happen tomorrow. One of the things that I remember very vividly, being there 10 years ago at about the time of the killings that took place in Assam, is discussing this with good friends and fellow writers. And I remember somebody said to me, until we understand that we are capable of these things, we can't begin to move beyond them. Because it's a very easy response to atrocities, to say: oh those terrible people did that, and we are not like that. I think the difficult response is to accept we are also capable of that, the thing that happened there could also, in certain circumstances, be something that we were able to perpetrate. The civilising influence is what prevents most of us from giving vent to those terrible urges. Those urges are part of humanity as well as the more civilized urges.
Of course, I fear in India the recurrence of communal or regionalist inter-community violence. I fear the long-term damage to a democracy that can be done by mass corruption. I think corruption is in a way a subversion of democracy and the commonplace view in India is that corruption is everywhere. In a sense, you could say that is not a democratic society. If money, favour and privilege is what makes the place work, then that's not a democracy. At least it runs the danger of being no longer able to call itself a democracy.
What was happening, I thought, was that people were trying to seize control of that rhetoric. That is to say, special interest groups. You could say Hindus are a very large special interest group. If any group inside such a complex and many faceted country tries to define the nation exclusively in its own terms, then it begins to create terrible stresses. I do think that the kind of attempt to define India in Hindu terms is worrying for that reason. It creates backlashes, it creates polarisation, and it creates the risk of more upheaval. Partly, I am saying this as a kind of objective observer, but nobody is an objective observer.
I come from an Indian minority, I no doubt have a minority perspective. I can't ignore that and nor would I wish to. Partly, also I am speaking temperamentally. That is to say, the kind of religious language in politics is something I find temperamentally unpleasant. I don't like people who do that, whether they be sectarians in Northern Ireland or India. I believe in, if possible, separating one's personal spiritual needs and aspirations from the way in which a country is run. I think in those countries where that separation has not taken place, one can see all kinds of distortions of social and ordinary life which are unpleasant. Iran is an obvious example. The country in which that kind of separation has completely fragmented it.
Where Naipaul is right, although I don't share his conclusions about it, but I think where he is right, is in saying that this is a great historical moment. One reason why the 50th anniversary is interesting is that it does seem to represent the end of the first age and the beginning of second age. And to that extent that is true now, if someone was born today, they would be born into a very different set of cultural assumptions and hopes than somebody born 50 years ago. We were entirely sold on the Nehru-Gandhi kind of plan. We grew up and that was the portrait of the nation we had hung on our wall, and to the extent that you never entirely lose those formative ideas, that's still the picture of the country I've got on my wall. But it's clear that for somebody being born now, they are being born into a very different country.
I also think of taking the Naipaul point on what would happen if the BJP were to form a government. Well, what I would like to think is that in order for the BJP or anybody of that persuasion to form a government, they would have to change. There is even some kind of suggestion that it may even be happening a little bit because they are intelligent people. They understand their weaknesses as well as their strengths. Clearly, for a Hinduist party to form the government of the country is not at all unlikely. So I think one does have to engage with that in the same way as many people in the country who, like myself, were not remotely in tune with the Thatcherite revolution but have to engage with it because it was in fact happening, and kept winning elections, and the world was not going to go back. So, of course, both people inside the Hindu political enterprise and people outside it will have to shift. I am optimistic about India's ability to force those changes that are necessary because I do believe it is not fundamentally an intolerant country and will not fundamentally accept intolerant politics.
On the other hand, there has to be reckoning with the fact that these are ideas, which are gaining in popularity. I'll tell you where I would draw the line myself. I think there was a great historical mistake made in Europe about the Nazi Party. People attempted to see whether they could live with it and discovered very rapidly that was a mistake, that appeasement was a great historical mistake. So, it seems to me, the question is: What do we make of this political enterprise? Is it fundamentally democratic or fundamentally anti-democratic? If democratic, then we must all learn to make the best of it. If anti-democratic, then we must fight it very hard.
What happened in India happened before the book (Satanic Verses) had actually entered. It happened because of an article in India Today, which, I must say, I thought was an irresponsibly written article, because it was written by somebody, who, as a friend, asked me for an early copy of the book, and then presented that book in the most inflammatory sort of way.
This was one of the things that disappointed me, that after a lifetime of having written from a certain sensibility, and a certain point of view, I would have expected people in India to know about it since it was all entirely about India. It was written from a deep sense of connection and affection for India. I would have expected that I had some money in the bank. That is to say, if Salman Rushdie wrote any book, then we know who he is. He is not some idiot who just arrived from nowhere shouting abuse. This is somebody whose work, whose opinions, whose lectures and whose stories we know. I would have hoped that my work would have been judged in the context of what people already knew about me. Instead, it seemed as if everything I had been in my life up to that point suddenly vanished out of the window and this other Rushdie was invented who was this complete bastard who had done this terrible thing. There did not seem to be any attempt to correct that or to combat that. I was surprised and disappointed it did not. It didn't happen here either. It didn't happen anywhere in the world. It was as if the force of history, the force of a historical event was so huge that it erases all that goes before it.
The negative response to the Satanic Verses, let us remember that there was also a positive response, was such that it erased my personality and put in its place some other guy who they didn't recognize at all. Anybody who knows anything about these countries, and I do know something about these countries, knows that every cheap politician can put a demonstration in the street in five minutes. That doesn't represent in any sense the people's will. It represents a certain kind of political structure, political organization. It doesn't represent truth. But I always believed and I still believe that India would come back. I never believe that the loss of India is forever. Because India is not Iran, it’s not even Pakistan, and I thought good sense will prevail in India because that's my life experience of Indian people and of the place.
The idea of India that inspired the writer's generation was the one dominated or formed by
The answer to this question can be referred from the given lines:"And to that extent that is true now, if someone was born today, they would be born into a very different set of cultural assumptions and hopes than somebody born 50 years ago. We were entirely sold on the Nehru-Gandhi kind of plan." Here the author says that they were inspired from the idea of Nehru-Gandhi ideology.
The writer does not share
Refer to the following sentences: "Where Naipaul is right, although I don't share his conclusions about it, but I think where he is right, is in saying that this is a great historical moment". So, the writer does not share Naipaul's conclusion on the 50th anniversary being a historical moment. Option c) is the correct answer.
The writer shows faith in India's basic
Refer to the following lines:"If you ask people in general, they would have absolutely no problem with the idea of India at all. I think, in a way the strength of the nationalist idea is shown by its ability to survive the extraordinary stresses that it was placed under" This quality is resilience where we can endure more stress and still emerge victorious.
According to the writer,
Both the options can be inferred from the given lines:"Anybody who knows anything about these countries, and I do know something about these countries, knows that every cheap politician can put a demonstration in the street in five minutes. That doesn't represent in any sense the people's will."
The writer's view of India is determined mainly by
The given passage is based on the experience of the author. Here the author states the democratic credentials of India and highlights the resilience of Indians.In the last line of the passage, the author mentions about his life experience specifically. Hence the answer is a.
According to the writer's friend,
The answer can be interpreted from the following lines:"One of the things that I remember very vividly, being there 10 years ago at about the time of the killings that took place in Assam, is discussing this with good friends and fellow writers. And I remember somebody said to me, until we understand that we are capable of these things, we can't begin to move beyond them." Here the author's friend says that we can move beyond some things after we are capable to do those things.
What according to the passage prevents us from giving in to violent, terrible urges?
Refer to the following sentence: "The civilizing influence is what prevents most of us from giving vent to those terrible urges". This idea is mentioned in option d). Option d) is the correct answer.
According to the writer, what disqualifies India from being called a democracy?
Refer to the following sentences: "I think corruption ..... to call itself a democracy.". From these sentences, we can infer that the author fears the long-term damage to democracy which corruption can bring about. Hence, option b) is the correct answer.
The writer contradicts his assertion of being an 'objective observer' on the basis that
The answer can be deduced directly from the given lines:" It creates backlashes, it creates polarisation, and it creates the risk of more upheaval. Partly, I am saying this as a kind of objective observer, but nobody is an objective observer."
In the first paragraph of the passage, the writer questions
Refer to the following sentences: "The thing that became independent had never previously existed, except that there had been an area... was an invention". So, the writer is questioning the existence of a political entity called India prior to independence. Option a) is the correct answer.
According to the writer, the difference between India and Pakistan was that
Refer to the following lines in which the author clearly mentions that the creation of Pakistan was under-imagines:"The history of India is a history of independent nation-states. It is a history of Oudh or Bengal or Maratha kingdoms. All those independent histories agreed to collectivise themselves into the idea of the nation of India. In the case of Pakistan, it was less successful. Pakistan was under-imagined. It did not survive as a nation-state."
According to the passage, the secret of India's survival lies in
Refer to the following two sentences in the passage: "I think, in a way the strength of the nationalist idea is shown by its ability to survive", "But that it does exist and that it is something to which people feel they belong". The secret of India's survival, according to the author, lies in its ability to fight back stress and strains and a sense of belonging that people feel for it. Option d) is the correct answer.
If Western civilization is in a state of permanent crisis, it is not far-fetched to suggest that there may be something wrong with its education. No civilization, I am sure, has ever devoted more energy and resources to organised education, and if we believe in nothing else, we certainly believe that education is, or should be, the key to everything. In fact, the belief in education is so strong that we treat it as the residual legatee of all our problems. If the nuclear age brings new danger; if the advance of genetics engineering opens the doors of new abuses; if commercialism brings new temptations, the answer must be more and better education. The modern way of life is becoming more complex: this means that everybody must become more highly educated.
“By 1984,” it was said recently, “it will be desirable that the most ordinary of men is not embarrassed by the use of a logarithm table, the elementary concepts of the calculus, and by the definitions and uses of such words as electron, coulomb, and volt. He should further have become able not only to handle a pen, and ruler but also a magnetic tape, valve, and transistor.
The improvement of communications between individuals and groups depends on it.” Most of all, it appears, the international situation calls for prodigious educational efforts. The classical statement on this point was delivered by Sir Charles (now Lord Snow in his Rede Lecture some years ago:
To say that we must educate ourselves or perish, is a little more melodramatic than the facts warrant. To say we have to educate ourselves or watch a steep decline in our lifetime, is about right. According to Lord Snow, the Russians are apparently doing much better than anyone else and will 'have a clear edge', unless and until the Americans and we educate ourselves both sensibly and imaginatively'. Lord Snow, it will be recalled, talked about 'The Two Cultures and the Scientific Revolution' and expressed his concern that 'the intellectuals life of the whole of western society is increasingly being split into two polar groups . . . At one pole we have the literary intellectuals . . . at the other the scientists'. He deplores the 'gulf of mutual incomprehension' between these two groups and wants it bridged. It is quite clear how he thinks this 'bridging' operation is to be done; the aims of his educational policy would be, first, to get as many 'alpha-plus scientists as the country can throw up'; second, to train 'a much larger stratum of alpha professionals' to do the supporting research, high class design and development; third, to train 'thousands upon thousands' of other scientists and engineers; and finally, to train 'politicians, administrators, and entire community, who know enough science to have a sense of what the scientists are talking about'. If this fourth and last group can at least be educated enough to 'have sense' of what the real people, the scientists and engineers, are talking about, so Lord Snow seems to suggest, the gulf of mutual incomprehension between the 'Two Cultures' may be bridged.
These ideas on education, which are by no means unrepresentative of our times, leave one with the uncomfortable feeling that ordinary people, including politicians, administrators, and so forth, are really not much use, they have failed to make the grade: but, at least, they should be educated enough to have a sense of what is going on, and to know what the scientists mean when they talk to quote Lord Snow's example about the Second Law of Thermodynamics. It is an uncomfortable feeling, because the scientists never tire of telling us that the fruits of their labours are 'neutral': whether they enrich humanity or destroy it depends on how they are used.
And who is to decide how they are used? There is nothing in the training of scientists and engineers to enable them to take such decision, or else, what becomes of the neutrality of science? If so much reliance is today being placed in the power of education to enable ordinary people to cope with the problems thrown up by scientific and technological progress, then there must be something more to education than Lord Snow suggests. Can education help us to turn the potentiality into a reality to the benefit of man? To do so, the task of education would be, first and foremost the transmission of ideas of value, of what to do with our lives. There is no doubt also the need to transmit know-how but this must take second place, for it is obviously somewhat foolhardy to put great powers into the hands of people without making sure that they have a reasonable idea of what to do with them. At present, there can be little doubt that the whole of mankind is in mortal danger, not because we are short of scientific and technological know-how, but because we tend to use it destructively, without wisdom. More education can help us only if it produces more wisdom.
The essence of education, I suggested, is the transmission of values, but values do not help us to pick our way through life unless they have become our own, a part, so to say, of our mental make-up. This means that they are more than mere formulae or dogmatic assertions: that we think and feel with them, that they are the very instruments through which we like and interpret, and experience the world. When we think, we do not just think: we think with ideas. Our mind is not a blank, a tabula rasa. When we begin to think we can do so only because our mind is already filled with all sorts of ideas with which to think. All through our youth and adolescence, before the conscious and critical mind begins to act as a sort of censor and guardian at the threshold, ideas seep into our mind, multitudes of them. These years are, one might say, our Dark Ages during which we are nothing but inheritors; it is only in later years that we can gradually learn to sort out our inheritance. First of all, there is language. Each word is an idea. If the language which seeps into us during our Dark Ages is English, our mind is thereby furnished by a set of ideas which is significantly different from the set represented by Chinese, Russian, German, or even American. Apart from words there are the rules of putting them together: grammar, another bundle of ideas, the study of which has fascinated some modern philosophers to such an extent that they thought they could reduce the whole of philosophy to a study of grammar. All philosophers and others have always paid a great deal of attention to ideas seen as the result of thought and observation; but in modern times all too little attention has been paid to the study of the ideas which form the very instruments by which thought and observation proceed. On the basis of experience and conscious thought small ideas may easily be dislodged, but when it comes to bigger, more universal, or more subtle ideas, it may not be so easy to change them. Indeed, it is often difficult to become aware of them, as they are the instruments and not the result of our thinking just as you can see what is outside you, but cannot easily see that with which you see, the eye itself.
And even when one has become aware of them it is often impossible to judge them on the basis of ordinary experience. We often notice the existence of more or less fixed ideas in other people's minds — ideas with which they think without being aware of doing so. We then call them prejudices, which is logically quite correct because they have merely seeped into the mind and are in no way the result of judgement. But the word prejudice is generally applied to ideas that are patently erroneous and recognisable as such by anyone except the prejudiced man. Most of the ideas with which we think are not of that kind at all. To some of them, like those incorporated in words and grammar, the notions of truth or error cannot even be applied, others are quite definitely not prejudices but the result of a judgement; others again are tacit assumptions or presuppositions which may be very difficult to recognise. I say, therefore, that we think with or through ideas and that what we call thinking is generally the application of pre-existing ideas to a given situation or set of facts. When we think about, say the political situation.
we apply to that situation our political ideas, more or less systematically, and attempt to make that situation' ‘intelligible' to ourselves by means of these ideas. Similarly, everywhere else we evaluate the situation in the light of our value-ideas. The way in which we experience and interpret the world obviously depends very much indeed on the kind of ideas that fill our minds. If they are mainly small, weak, superficial, and incoherent, life will appear insipid, uninteresting, petty and chaotic. It is difficult to bear the resultant feeling of emptiness, and the vacuum of our minds may only too easily be filled by some big, fantastic notion-political or otherwise — which suddenly seem to illumine everything and to give meaning and purpose to our existence. We feel that education will help solve each new problem or complexity that arises. It needs no emphasis that herein lies one of the great dangers of our times. When people ask for education they normally mean something more than mere training, something more than mere knowledge of facts, and something more than a mere diversion.
Maybe they cannot themselves formulate precisely what they are looking for; but I think what they are really looking for is ideas that could make the world, and their own lives, intelligible to them. When a thing is intelligible you have a sense of participation; when a thing is unintelligible you have a sense of estrangement. 'Well, I don't know', you hear people say, as an impotent protest against the unintelligibility of the world as they meet it. If the mind cannot bring to the world a set — or, shall we say, a tool box — of powerful ideas, the world must appear to it as a chaos, a mass of unrelated phenomena, of meaningless events. Such a man is like a person in a strange world and without any signs of civilization, without maps or signposts or indicators of any kind. Nothing has any meaning to him; nothing can hold his vital interest; he has no means of making anything intelligible to himself.
The writer's contention in the passage is that the crisis in Western civilization can be explained by
Refer to the first sentence of the passage: "In Western civilization is in a state of permanent crisis, it is not far-fetched to suggest that there maybe something wrong with its education". So, the writer's contention is that the crisis in the Western civilization can be explained by the presence of some flaws in its education. Option a) is the correct answer.
According to the writer, Lord Snow sees the intellectual life of Western society as split between
Refer to the following sentences: "Lord Snow, it will be recalled, talked about 'The Two Cultures'...at the other the scientists". So, according to Lord Snow, the intellectual life of the Western society is split between the scientists and literary intellectuals". Option c) is the correct answer.
The writer seems to criticise the belief that
Refer to the first few lines of the paragraph:"If Western civilization is in a state of permanent crisis, it is not far-fetched to suggest that there may be something wrong with its education. No civilization, I am sure, has ever devoted more energy and resources to organised education, and if we believe in nothing else, we certainly believe that education is, or should be, the key to everything. In fact, the belief in education is so strong that we treat it as the residual legatee of all our problems." Here the author criticises our view when we consider the solutin of some problem as more education.
What, according to the author, would be the definition of 'prejudice'?
Consider the following sentences: "We often notice the existence of more or less fixed ideas in other people's minds - ideas with which they think without being aware of doing so. We then call them prejudices". So, a prejudice is a fixed idea with which people think without being aware of doing so. Option b) is the correct answer.
According to Lord Snow, which of the following groups needs to be educated enough to at least understand the works of scientists and engineers?
The author quotes Lord Snow in the passage: "and finally to train politicians, administrators, and entire community...". Option a) is the correct answer.
In the passage, the writer questions
From the passage, we can infer that the author feels that the neutrality of science would be under threat in the future. Hence, he does not question whether it is currently neutral or not. Similarly, we cannot infer that scientists question the neutrality of science. Hence, we can eliminate options A and B.
The author does question the scientists stand that their labours are neutral and the fruits depend on the actions of others. The author particularly worries about this given the fact that most people don't even understand the work of the scientists. Hence, the author questions the scientists stand on the neutrality of their labours. Hence, option C is the right answer.
The author's assertion in the passage is that education's main responsibility is to
Refer to the following sentence: "The essence of education, i suggested, is the transmission of values...". So, according to the author, the main responsibility of education is to transmit ideas of value. Option a) is the correct answer.
The author believes that
Refer to the following sentences: "These ideas on education, which are by no means unrepresentative of our times, ...Second Law of Thermodynamics". From these sentences, we can understand that the author is not of the opinion that the gulf between science and literature needs to be bridged. Also, there is nothing in the passage to suggest that the author believes that ideas should be maintained for a holistic view of society and its problems or that words are not ideas.
Option d) is the correct answer.
Which of the following sentences is not true according to the author?
Refer to the following sentences: "The essence of education, I suggested, ... more than mere formulae or dogmatic assertions..". From these sentences, we understand that according to the author, values are not merely dogmatic assertions". Option b) is the correct answer.
Thinking is
Refer to the following sentence: "I say, therefore, that we think with or through ideas and that what we call thinking is generally the application of pre-existing ideas to a given situation or set of facts". So, thinking is an application of pre-existing ideas to a situation. Option c) is the correct answer.
The highest priced words are ghost-written by gagmen who furnish the raw material for comedy over the air and on the screen. They have a word-lore all their own, which they practise for five to fifteen hundred dollars a week, or fifteen dollars a gag at piece rates. That's sizable rate for confounding acrimony with matrimony, or extracting attar of roses from the other.
Quite apart from the dollar sign on it, gagmen's word-lore is worth a close look, if you are given to the popular American pastime of playing with words — or if you're part of the 40 per cent who make their living in the word trade. Gag writers' tricks with words point up the fact that we have two distinct levels of language: familiar, ordinary words that everybody knows; and more elaborate words that don't turn up so often, but many of which we need to know if we are to feel at home in listening and reading today.
To be sure gagmen play hob with the big words, making not sense but fun of them. They keep on confusing bigotry with bigamy, illiterate with illegitimate, monotony with monogamy, osculation with oscillation. They trade on the fact that for many of their listeners, these fancy terms linger in a twilight zone of meaning. It’s their deliberate intent to make everybody feel cozy at hearing big words, jumbled up or smacked down. After all, such words loom up over-size in ordinary talk, so no wonder they get the bulldozer treatment from the gagmen.
Their wrecking technique incidentally reveals our language as full of tricky words, some with 19 different meanings, others which sound alike but differ in sense. To ring good punning changes, gag writers have to know their way around in the language. They don't get paid for ignorance, only for simulating it.
Their trade is a hard one, and they regard it as serious business. They never laugh at each other's jokes; rarely at their own. Like comediennes, they are usually melancholy men in private life.
Fertile invention and ingenious fancy are required to clean up ‘blue’ burlesque gags for radio use. These shady gags are theoretically taboo on the air. However, a gag writer who can leave a faint trace of bluing when he launders the joke is all the more admired — and more highly paid. A gag that keeps the blue tinge is called a ‘double intender’, gag-land jargon for double entendre. The double meaning makes the joke funny at two levels. Children and other innocents hearing the crack for the first time take it literally, laughing at the surface humour; listeners who remember the original as they heard it in vaudeville or burlesque, laugh at the artfulness with which the blue tinge is disguised.
Another name for a double meaning of this sort is ‘insinuendo’. This is a portmanteau word or ‘combo’, as the gagmen would label it, thus abbreviating combination. By telescoping insinuation and innuendo, they get insinuendo, on the principle of blend words brought into vogue by Lewis Caroll. ‘Shock logic’ is another favourite with gag writers. Supposedly a speciality of women comediennes, it is illogical logic more easily illustrated than defined. A high school girl has to turn down a boy's proposal, she writes:
Dear Jerry, I'm sorry, but I can't get engaged to you. My mother thinks I am too young to be engaged and besides, I'm already engaged to another boy. Yours regretfully. Guess who.
Gag writers' lingo is consistently funnier than their gags. It should interest the slang-fancier. And like much vivid jargon developed in specialised trades and sports, a few of the terms are making their way into general use. Gimmick, for instance, in the sense either of a trick devised or the point of a joke, is creeping into the vocabulary of columnists and feature writers.
Even apart from the trade lingo, gagmen's manoeuvres are of real concern to anyone who follows words with a fully awakened interest. For the very fact that gag writers often use a long and unusual word as the hinge of a joke, or as a peg for situation comedy, tells us something quite significant: they are well aware of the limitations of the average vocabulary and are quite willing to cash in on its shortcomings.
When Fred Allens' joke-smiths work out a fishing routine, they have Allen referring to the bait in his most arch and solemn tones: "I presume you mean the legless invertebrate." This is the old minstrel trick, using a long fancy term, instead of calling a worm a worm. Chico Marx can stretch a pun over 500 feet of film, making it funnier all the time, as he did when he rendered, "Why a duck?"
And even the high-brow radio writers have taken advantage of gagmen's technique. You might never expect to hear on the air such words as lepidopterist and entymologist. Both occur in a very famous radio play by Norman Corvine, ‘My client Curly’, about an unusual caterpillar which would dance to the tune ‘yes, sir, she's my baby’ but remained inert to all other music. The dancing caterpillar was given a real New York buildup, which involved calling in the experts on butterflies and insects which travel under the learned names above. Corvine made mild fun of the fancy professional titles, at the same time explaining them unobtrusively.
There are many similar occasions where any one working with words can turn gagmen's trade secrets to account. Just what words do they think outside the familiar range? How do they pick the words that they ‘kick around’? It is not hard to find out.
According to the writer, a large part of the American population
Refer to the following sentence: "Quite apart from the dollar sign on it,...word trade". From this, we can understand that a large part of the American population indulges in word trade. Option b) is the correct answer.
The hallmark of gag writers is that they
Throughout the passage, the author brings out various examples which show that the primary hallmark of a gag writer is that he/she has fun with words. Refer to the words 'hilarious', 'joke' etc. strewn throughout the passage. This is clearly brought out in option b).
According to the passage, the second level of language is important if
This fact is highlighted when the author talks about the gag writers in two aspects of the language. Refer to the following lines:"Gag writers' tricks with words point up the fact that we have two distinct levels of language: familiar, ordinary words that everybody knows; and more elaborate words that don't turn up so often, but many of which we need to know if we are to feel at home in listening and reading today." These line confirm option a as an answer.
According to the writer, gag writers thrive on
Refer to the following lines:"Gag writers' tricks with words point up the fact that we have two distinct levels of language: familiar, ordinary words that everybody knows; and more elaborate words that don't turn up so often, but many of which we need to know if we are to feel at home in listening and reading today. To be sure gagmen play hob with the big words, making not sense but fun of them. They keep on confusing bigotry with bigamy, illiterate with illegitimate, monotony with monogamy, osculation with oscillation." In this passage the author states that the gag writers make the use of double meaning language in order to make everyone feeling cozy.
In gag writers' trade
Refer to the following sentences: "This is a portmanteau word or 'combo'...", "For the very fact that gag writers often use a long and unusual word...". From these sentences, we can infer that gag writers combine parts of words to produce a hilarious effect and that long words play a major role. So, option d) is the correct answer.
When the writer says, "They don't get paid for ignorance, only for simulating it," he means to say
Refer to the following sentences: "To ring good punning changes, gag writers have to know their way around in a language. They don't get paid for ignorance, only for simulating it". So, the writer means to say that simulating ignorance is the trick that makes gag writers tick. Option c) is the correct answer.
Gag writers have influenced
The answer can be concluded directly from the given lines:"This is the old minstrel trick, using a long fancy term, instead of calling a worm a worm. Chico Marx can stretch a pun over 500 feet of film, making it funnier all the time, as he did when he rendered, "Why a duck?" And even the high-brow radio writers have taken advantage of gagmen's technique."
From ancient times, men have believed that, under certain peculiar circumstances, life could arise spontaneously: from the ooze of rivers could come eels and from the entrails of dead bulls, bees; worms from mud, and maggots from dead meat. This belief was held by Aristotle, Newton and Descartes, among many others, and apparently the great William Harvey too. The weight of centuries gradually disintegrated men's beliefs in the spontaneous origin of maggots and mice, but the doctrine of spontaneous generation clung tenaciously to the question of bacterial origin.
In association with Buffon, the Irish Jesuit priest John Needham declared that he could bring about at will the creation of living microbes in heat-sterilised broths, and presumably, in propitiation, theorised that God did not create living things directly but bade the earth and water to bring them forth. In his Dictionaire Philosophique, Voltaire reflected that it was odd to read of Father Needham's claim while atheists conversely should deny a Creator yet attribute to themselves the power of creating eels. But, wrote Thomas Huxley, 'The great tragedy of science — the slaying of a beautiful hypothesis by an ugly fact — which is so constantly being enacted under the eyes of philosophers, was played, almost immediately, for the benefit of Buffon and Needham.
The Italian Abbé Spallanzani did an experiment. He showed that a broth sealed from the air while boiling never develops bacterial growths and hence never decomposes. To Needham's objection that Spallanzani had ruined his broths and the air above them by excessive boiling, the Abbé replied by breaking the seals of his flasks. Air rushed in and bacterial growth began! But the essential conflict remained. Whatever Spallanzani and his followers did to remove seeds and contaminants was regarded by the spontaneous generationists as damaging to the 'vital force' from whence comes new life.
Thus, doubt remained, and into the controversy came the Titanic figure of Louis Pasteur. Believing that a solution to this problem was essential to the development of his theories concerning the role of bacteria in nature, Pasteur freely acknowledged the possibility that living bacteria very well might be arising anew from inanimate matter. To him, the research problem was largely a technical one: to repeat the work of those who claimed to have observed bacterial entry. For the one that contended that life did not enter from the outside, the proof had to go to the question of possible contamination. Pasteur worked logically. He found during the experiments that after prolonged boiling, a broth would ferment only when air was admitted to it. Therefore, he contended, either air contained a factor necessary for the spontaneous generation of life or viable germs were borne in by the air and seeded in the sterile nutrient broth. Pasteur designed ingenious flasks whose long S-shaped necks could be left open. Air was trapped in the sinuous glass tube. Broths boiled in these flask tubes remained sterile. When their necks were snapped to admit ordinary air, bacterial growth would then commence — but not in every case. An occasional flask would remain sterile presumably because the bacterial population of the air is unevenly distributed. The forces of spontaneous generation would not be so erratic. Continuous scepticism drove Pasteur almost to fanatical efforts to control the ingredients of his experiments to destroy the doubts of the most sceptical. He ranged from the mountain air of Montanvert, which he showed to be almost sterile, to those deep, clear wells whose waters had been rendered germfree by slow filtration through sandy soil. The latter discovery led to the familiar porcelain filters of the bacteriology laboratory. With pores small enough to exclude bacteria, solutions allowed to percolate through them could be reliably sterilised.
The argument raged on and soon spilled beyond the boundaries of science to become a burning religious and philosophical question of the day. For many, Pasteur's conclusions caused conflict because they seemed simultaneously to support the Biblical account of creation while denying a variety of other philosophical systems. The public was soon caught up in the crossfire of a vigorous series of public lectures and demonstrations by leading exponents of both views, novelists, clergymen, their adjuncts and friends. Perhaps the most famous of these evenings in the theatre — competing perhaps with a great debate between Huxley and Bishop Wiberforce for elegance of rhetoric — was Pasteur's public lecture at the Sorbonne on April 7, 1864. Having shown his audience the swan necked flasks containing sterile broths, he concluded, "And, therefore, gentlemen, I could point to that liquid and say to you, I have taken my drop of water from the immensity of creation, and I have taken it full of the elements appropriated to the development of inferior beings. And I wait, I watch, I question it! — begging it to recommence for me the beautiful spectacle of the first creation. But it is dumb, dumb since these experiments were begun several years ago; It is dumb because I have kept it from the only thing man does not know how to produce: from the germs that float in the air, from life, for life is a germ and a germ is life. Never will the doctrine of spontaneous generation recover from the mortal blow of this simple experiment." And it is not. Today these same flasks stand immutable: they are still free of microbial life.
It is an interesting fact that despite the ringing declaration of Pasteur, the issue did not die completely. And although far from healthy, it is not yet dead. In his fascinating biography of Pasteur, Rene Dubos has traced the later developments which saw new eruptions of the controversy, new technical progress and criticism, and new energetic figures in the breach of the battle such as Bastion, for, and the immortal Tyndall, against, the doctrine of spontaneous generation. There was also new 'sorrow' for Pasteur as he read years later, in 1877, the last jottings of the great physiologist Claude Bernard and saw in them the 'mystical' suggestion that yeast may arise from grape juice. Even at this late date, Pasteur was stirred to new experiments again to prove to the dead Bernard and his followers the correctness of his position.
It seems to me that spontaneous generation is not only a possibility, but a completely reasonable possibility which should never be relinquished from scientific thought. Before men knew of bacteria, they accepted the doctrine of spontaneous generation as the 'only reasonable alternative' to a belief in supernatural creation. But today, as we look for satisfaction at the downfall of the spontaneous generation hypothesis, we must not forget that science has rationally concluded that life once did originate on earth by spontaneous generation. It was really Pasteur's evidence against spontaneous generation that for the first time brought the whole difficult question of the origin of life before the scientific world. In the above controversy, what was unreasonable was the parade of men who claimed to have 'proved' or who resolutely 'believed in' spontaneous generation on the face of proof — not that spontaneous generation cannot occur — but that their work was shot through with experimental error. The acceptable evidence also makes it clear that spontaneous generation, if it does not occur, must obviously be a highly improbable event under present conditions. Logic tells us that science can only prove an event improbable: it can never prove it impossible — and Gamow has appropriately remarked that nobody is really certain what would happen if a hermetically sealed can were opened after a couple of million years. Modern science agrees that it was highly improbable for life to have arisen in the pre-Cambrian seas, but it concluded, nevertheless, that there it did occur. With this, I think, Pasteur would agree.
Aside from their theoretical implications, these researchers had the great practical result of putting bacteriology on a solid footing. It was now clear how precisely careful one had to be to avoid bacterial contamination in the laboratory. We now knew what 'sterile' meant and we knew that there could be no such thing as 'partial sterilization'. The discovery of bacteria high in the upper atmosphere, in the mud of the deep sea bottom, in the waters of hot springs, and in the Arctic glaciers established bacterial ubiquity as almost absolute. In recognition of this Lord Lister introduced aseptic technique into the practice of surgery. It was the revolution in technique alone that made possible modern bacteriology and the subsequent research connecting bacteria to phenomena of human concern, research, which today is more prodigious than ever. We are just beginning to understand the relationship of bacteria to certain human diseases, to soil chemistry, nutrition, and the phenomenon of antibiosis, wherein a product of one organism (e.g. penicillin) is detrimental to another. It is not an exaggeration then to say that the emergence of the cell theory represents biology's most significant and fruitful advance. The realisation that all plants and animals are composed of cells which are essentially alike, that cells are all formed by the same fundamental division process, that the total organism is made up of activities and inter-relations of its individual cells, opened up horizons we have not even begun to approach. The cell is a microcosm of life, for in its origin, nature and continuity resides the entire problem of biology.
Needham's theory that 'God did not create living things directly' was posited as
Refer to the following sentence: "In association with Buffon, the Irish priest...theorized that God did not create living things...to bring them forth". From this, we can infer that Needham's theory was posited as an attempt at propitiating a possibly offended God or the religious psyche of the time. Option c) is the correct answer.
It can be inferred from the passage that
Refer to the following sentences: "In association with Buffon, the Irish Jewish priest John Needham...But wrote Thomas Huxley... for the benefit of Buffon and Needham". From this, we can infer that Buffon, Needham, Voltaire and Huxley were contemporaries. Option b) is the correct answer.
According to the passage,
Refer to the following line:"To him, the research problem was largely a technical one: to repeat the work of those who claimed to have observed bacterial entry. For the one that contended that life did not enter from the outside, the proof had to go to the question of possible contamination. Pasteur worked logically." The author suggests that Pasteur worked logically unlike his predecessors.
Pasteur began his work on the basis of the contention that
Option b is the conclusion of the Pasteur's experiment. The contenntion was option A as expressed in the given lines "Therefore, he contended, either air contained a factor necessary for the spontaneous generation of life or viable germs were borne in by the air and seeded in the sterile nutrient broth."
The porcelain filters of the bacteriology laboratories owed their descent to
The answer is option b and it can be found from the given lines:"Continuous scepticism drove Pasteur almost to fanatical efforts to control the ingredients of his experiments to destroy the doubts of the most sceptical. He ranged from the mountain air of Montanvert, which he showed to be almost sterile, to those deep, clear wells whose waters had been rendered germfree by slow filtration through sandy soil. The latter discovery led to the familiar porcelain filters of the bacteriology laboratory."
What according to the passage was Pasteur's declaration to the world?
The given answer can be determined from the words which Pasteur said:"And, therefore, gentlemen, I could point to that liquid and say to you, I have taken my drop of water from the immensity of creation, and I have taken it full of the elements appropriated to the development of inferior beings. And I wait, I watch, I question it! — begging it to recommence for me the beautiful spectacle of the first creation. But it is dumb, dumb since these experiments were begun several years ago; It is dumb because I have kept it from the only thing man does not know how to produce: from the germs that float in the air, from life, for life is a germ and a germ is life. Never will the doctrine of spontaneous generation recover from the mortal blow of this simple experiment." Option C is stated in these lines.
What according to the writer, was the problem with the proponents of spontaneous generation?
In this passage the author states that the people who believed in the idea of spontaneous generation did not take into account the experimental error.Refer to the following lines for detail: "In the above controversy, what was unreasonable was the parade of men who claimed to have 'proved' or who resolutely 'believed in' spontaneous generation on the face of proof — not that spontaneous generation cannot occur — but that their work was shot through with experimental error"
One of the results of the theoretical cross fire regarding bacteriology was that
The answer can be deduced from the given lines:" It was now clear how precisely careful one had to be to avoid bacterial contamination in the laboratory. We now knew what 'sterile' meant and we knew that there could be no such thing as 'partial sterilization'. The discovery of bacteria high in the upper atmosphere, in the mud of the deep sea bottom, in the waters of hot springs, and in the Arctic glaciers established bacterial ubiquity as almost absolute."
One of the reasons for the conflict caused by Pasteur's experiments was that
Option b can be concluded directly from the given lines:"For many, Pasteur's conclusions caused conflict because they seemed simultaneously to support the Biblical account of creation while denying a variety of other philosophical systems. "
According to the author,
Option d can be directly referred from the following lines:"It is not an exaggeration then to say that the emergence of the cell theory represents biology's most significant and fruitful advance."
The end of mutual funds, when it came, was sudden but not unexpected. For over 10 years, mutual fund has been scripting its own growth demise, embarking on a reckless course of high risks, unhealthy pastimes, and unchecked maladies. Ironically but fittingly too, the very hand that had supported and sustained it through the turbulent early period of its existence was the one that, finally wielded the euthanasian syringe. The individual investor it was who had made the mutual fund post-liberalisation, India's most vibrant vehicle for individual investment. The individual investor it was who brought the curtain down on an act that had started with a virtuoso performance, only to putrefy into a show of ineptitude, imprudence, and irresponsibility.
The mutual fund, as we know it, may be dead. It died of many things. But, primarily, of a cancer that ate away at its innards. A cancer that destroyed the value of the investments, the mutual funds was made to service the Rs. 85,000 crore that India's investors had entrusted them with ever since they began life way back in 1964 as The Unit Trust Of India's (UTI), now disgraced Unit Scheme 64(US 64). A cancer that grew from the refusal of the men and women to manage the mutual fund to exercise a mixture of caution and aggression, but to adopt, instead, an indisciplined, unplanned, fire-from-the hip approach to investment. A cancer that ultimately, robbed the mutual funds of the resources they would have to use to pay back their investors, leaving them on Death Row. Indeed, the scandal that US 64 had been brewing for years, was only one, but not the first, of the warning bells that pointed to the near emptiness of many a mutual fund's coffers. In quick succession have emerged reports of more and more fund-schemes that have been laid bare, their corpuses empty, their ability to meet their promises of assured returns to investors demolished. At least 37 per cent of the 235 fund schemes in operation in the country have promised investors assured returns of over 15 per cent for 5 years, and repurchase-prices well above their Net Asset Values (NAVs).
According to a study conducted by the Delhi-based Value Research, at least 18 big schemes due for redemption over the next three years will be unable to service their investors, or even return their money at the time of redemption. The shortfall? Rs. 4,685.10 crore. Or 75.87 per cent of the amount handed over by trusting investors to fund managers. Worries Ajai Kaul, 38, president, Alliance Capital Asset Management: "When an assured-returns scheme runs into problems, investors view it as one more let-down by the mutual funds." Had they but known of the actual practices seen in the offices and hallways of the mutual funds, which have translated into these results, investors would have shown their disgust long ago.
Take the case of a mutual fund company that manages more than a dozen schemes. According to an unwritten, but formalised, principle, each scheme takes it in turn to sell some of its holdings to its sister-schemes, booking fat notional gains and posting NAVs. While investors responded by pouring in even more of their savings, the profits were clearly only on paper. In the offices of another asset management company half way across Mumbai, the demand for cellular-phones peaked six months ago. Its employees had, suddenly, realised that making their personal deals using information gathered in the course of their professional work, was best done over cell phones so that the company's records wouldn't show the call being made. Obviously, the hot tips went to fatten their — and not investors' — pockets. Earlier, quite a few merchant bankers entered the mutual funds industry to use the corpus to subscribe to the issues they were managing. It took a crash in the primary market — not ethics or investigations — for this practice to stop. Filled with fear and loathing — and righteous anger — the investor has, therefore, decided to adjure the mutual fund. According to Marketing And Development Research Associates (MDRA) opinion poll of 342 investors conducted last fortnight in the five metros — Bangalore, Kolkata, Chennai, Delhi and Mumbai — mutual funds as an investment instrument now ranks a lowly fourth on safety — after bank deposits, gold, and real estate — and fifth on returns — ahead only of bank deposits and gold. And only 14.20 per cent of the sample will even consider investing in a mutual fund in the future. Still, it is the species that has died, not its every member. The ones that have survived are the bright performers who beat the market benchmark — the 100 — scrip. The Bombay Stock Exchange (BSE) National Index — by the widest margins within their three genres: growth, income and balance. However, even their star turns have not been able to stave off the stench of death over the business. In fact, an autopsy of the late — and, at the moment not particularly lamented — mutual funds reveal a sordid saga of callousness and calumny. Sheer disaster stares the mutual funds in the face and a cataclysm could destroy the savings of lakhs of investors too. A Value Research estimate of probable shortfall that 18 assured-returns schemes will face at the time of their scheduled redemptions over the three years adds up to a sense-numbing Rs. 4,685 crore. An independent audit of the 60 assured-returns schemes managed by the public sector mutual funds conducted by Price Waterhouse Coopers at the behest of the Securities and Exchange Board of India (SEBI) estimated a shortfall of between Rs. 2,500 crore and Rs. 3,000 crore. In 1999 alone judging from their present NAVs, the four schemes due for redemption — Canbank Asset Management Company's Cantriple, IndBank Asset Management Company's IndPrakash, SBI Funds Management's Magnum Triple Plus, and BOI Mutual Fund's (BOIMF) Double Square Plus — are heading for a collective shortfall of Rs. 1,639.55 crore.
As of June 30, 1998, the country's 252 fund-schemes managed assets with a market value of Rs. 69,599 crore, with the UTI alone controlling the fate of Rs. 50,000 crore. That is Rs. 11,000 crore less than the money invested in these schemes as of June 30, 1997, which means that the mutual funds have wiped out Rs. 11,000 crore from the investors' hard earned money in the intervening 12 months. Of course, every fund is paying for the sins of the black sheep.
For, the villain of the piece was UTI and the 95 funds managed by the public sector banks and institutions, the value of whose corpuses fell from Rs. 66,748 crore to Rs. 57,350 crore in the past year. In fact, these funds contributed 85.40 per cent of the overall value-loss, with the private sector funds boosting their corpuses from Rs. 4,000 crore to Rs. 4,120 crore to lower the extent of the erosion. For investors, that has translated into an option of either exiting at a loss — or holding on in vain hope. On November 20, 1998, a depressing 77 per cent of the 58 listed fund schemes were quoting at discounts of between 5 per cent and 40 per cent to their NAVs. And what of the NAVs themselves? The units of a shoulder-slumping 15 per cent of the schemes were worth less than their par values. And US 64, of course continued to languish, with an estimated NAV of Rs. 9.68. Even if there are schemes that have performed individually well, that the mutual funds have collectively failed to deliver couldn't be more obvious. So investors' murderous mood can hardly be debated. Their genesis and growth reveals just what blinded the mutual funds to the possibility of failure. Forty per cent of the banks-and-insurance companies-promoted funds in operation were launched between 1987 and 1993, when the stock markets were bull-dominated. In a period that saw only one bear phase, the BSE Sensitivity Index (the Sensex) climbed by 346 per cent.
Being successful with equity investments required no skills; only investible funds. Nor was fund-raising a problem, as investors desperately sought ways to grab a piece of equity boom. Between 1984 and 1989, the mutual funds collected Rs. 13,455 crore as subscriptions, but, in the next five years, they picked up Rs. 45,573 crore. In January, 1994, the UTI's Mastergain mopped up a stunning Rs. 4,700 crore while the most awaited Morgan Stanley Growth — a showcase for the fabled fund-management metier of the foreign mutual funds — took in Rs. 1,000 crore in just three days. Low entry-barriers — a so called sound track-record, a general reputation of fairness and integrity, an application-fee of Rs. 25,000, a registration fee of Rs. 25 lakh and an annual fee of Rs. 2.50 lakh — made entering the business a snap. Explains Ajay Srinivasan, 34, CEO, Prudential ICICI Mutual Fund: "Mutual funds were misunderstood by investors. Everyone thought they were a one way ticket to a jackpot." Intoxicated, fund-managers poured in more and more of their corpuses into equity, ignoring the downsides, confident that the boom would last forever. In the process, they ignored the very concept of risk-management, blithely ignoring the safety net of fixed-income instruments, and accusing those who advised caution of being cowards. In 1995, for instance, ABN estimated 70 per cent of the money being managed by the mutual funds had been funnelled into equity.
Whether they knew it or not, they were breaking away from the trend set by the mutual funds in the US, where the industry began by investing primarily in the money market, with only 25 per cent of their corpus set aside for stocks. Only in the past 15 years, after operating for more than seven decades, have those funds ventured into equity. Unfortunately, their success blinded the fund-managers to the fact that they were riding a wave-not navigating the treacherous seas. As Vivek Reddy, 36, CEO, Kothari-Pioneer Mutual Fund, puts it: "It was the stock market conditions that helped the mutual funds deliver returns, not superior investment skills." Then, the stock markets collapsed and never quite recovered. Between July 1997 and October 1998, the Sensex free-fell from 4306 to 2812 finally nullifying the theory that if you wait long enough, share-prices are always bound to rise. And the mutual fund, unused to a diet of falling equity indices, collapsed too. The quantum of money mopped up by the mutual fund may suggest that the reports of its extinction have been greatly exaggerated. In 1997-98, Indians entrusted Rs. 18,701 crore to the mutual funds, with new schemes alone mopping up Rs. 12,279 crore. Questions R. G Sharma, 58, CEO, LIC Mutual Fund: "How do you explain that Dhanvarsha 12 and Dhanvarsha 13, floated in April and September 1998, managed to mop up Rs. 335 crore?" Not quite a loss of faith, would you say? Think again. In those 12 months, those very investors also took away Rs. 16,227 crore in the form of repurchases and redemptions, leaving only Rs. 2,474 crore more in the hands of fund-managers. What's more, since none of the withdrawals could have been made from the new schemes, the old schemes, obviously, gave it all up, effectively yielding Rs. 9,805 crore to angry investors who took away their money. It is the same story this year: in the first quarter of 1998-99, old schemes collected Rs. 2,340 crore, compared to the new schemes' Rs. 1,735 crore but they gave up Rs. 2,749 crore ending up Rs. 409 crore poorer. Sure, some people are still putting money into the mutual funds. The real reason: money is flowing in from two genres of investors — neither of whom is the quintessential urban. The first comprises people in the semi-urban and rural areas, for whom names like the LIC and GIC still represent safety and assured schemes of income. Importantly, this category investor isn't clued into the financial markets, and is not, accordingly, aware of the problems that confront the mutual funds. Confirms Nikhil Khatau, 38, Managing Director, Sun F & C Asset Management: "That market is fairly stable. "However, as soon as the fundamental problems hit their dividend-paying ability, even the die hard mutual fund investor from India's villages and small towns — who, don't forget, has already been singed by the disappearance of thousands of nonbanking finance companies — will swear off their favourite investment vehicle. The second genre of investor explains why the private sector funds have been successful in soaking up large sums: 31.10 per cent of the total takings in 1997-98, and 10.70 per cent in the first quarter of 1998-99. They are the so called high net worth players — corporates and individuals — who in Khatau's terms, ‘are aggressive about managing their wealth, and look closely at comparative performance’. While their fastidiousness has forced them to pick the private sector mutual funds, whose disclosures and performance has both been ahead of their public sector cousins, their interest does not represent every investor's disillusionment.
The amount of money entrusted to the care of the mutual funds was
The answer is option c which can be inferred from the given lines:" A cancer that destroyed the value of the investments, the mutual funds was made to service the Rs. 85,000 crore that India's investors had entrusted them with ever since they began life way back in 1964 as The Unit Trust Of India's (UTI), now disgraced Unit Scheme 64(US 64)" Here the author refers to the mutual fund industry as a cancer which catered to Rs 85,000 crore entrusted by Indian investors.
The end of mutual funds was carried out at the hands of
Option C can be deduced from the following lines:"The individual investor it was who had made the mutual fund post-liberalisation, India's most vibrant vehicle for individual investment. The individual investor it was who brought the curtain down on an act that had started with a virtuoso performance, only to putrefy into a show of ineptitude, imprudence, and irresponsibility. The mutual fund, as we know it, may be dead. It died of many things. "
Here the author states that the individual investors made it most vibrant vehicle and then started acting irresponsibly.
According to the passage, the flaws of the mutual funds lay in their
The answer can be concluded from the given lines:" The individual investor it was who had made the mutual fund post-liberalisation, India's most vibrant vehicle for individual investment. The individual investor it was who brought the curtain down on an act that had started with a virtuoso performance, only to putrefy into a show of ineptitude, imprudence, and irresponsibility. The mutual fund, as we know it, may be dead. It died of many things."
According to the passage, one of the reasons for the failure of the mutual funds was
The answer is option A which can be inferred from the given lines:"A cancer that grew from the refusal of the men and women to manage the mutual fund to exercise a mixture of caution and aggression, but to adopt, instead, an indisciplined, unplanned, fire-from-the hip approach to investment."
According to the writer, one of the fallouts of the end of mutual funds is that
The answer can be inferred from the given lines:"According to a study conducted by the Delhi-based Value Research, at least 18 big schemes due for redemption over the next three years will be unable to service their investors, or even return their money at the time of redemption."
It can be inferred from the passage that
The answer to this question can be deduced from the given lines:" Had they but known of the actual practices seen in the offices and hallways of the mutual funds, which have translated into these results, investors would have shown their disgust long ago."
The author states that if they had not indulged in malpractices than the investors would have withdrawn a long time ago.
The current rank of the mutual fund industry in terms of safety and returns on deposits respectively is
The given answer can be inferred from the given lines: "According to Marketing And Development Research Associates (MDRA) opinion poll of 342 investors conducted last fortnight in the five metros — Bangalore, Kolkata, Chennai, Delhi and Mumbai — mutual funds as an investment instrument now ranks a lowly fourth on safety — after bank deposits, gold, and real estate — and fifth on returns — ahead only of bank deposits and gold."
The increase in the number of cell phone subscriptions in the office of an asset management company was due to the fact that
The answer can be inferred from the given lines:" In the offices of another asset management company half way across Mumbai, the demand for cellular-phones peaked six months ago. Its employees had, suddenly, realized that making their personal deals using information gathered in the course of their professional work, was best done over cell phones so that the company's records wouldn't show the call being made."
According to the passage, mutual funds caused a loss of
The amount can be inferred from the given lines: "As of June 30, 1998, the country's 252 fund-schemes managed assets with a market value of Rs. 69,599 crore, with the UTI alone controlling the fate of Rs. 50,000 crore. That is Rs. 11,000 crore less than the money invested in these schemes as of June 30, 1997, which means that the mutual funds have wiped out Rs. 11,000 crore from the investors' hard earned money in the intervening 12 months."
On the basis of the passage, it may be said that, in terms of retrieving their money, the investors
The author highlight that after the collapse of Mutual Fund industry, the investors are in dilemma. "Caught between the devil and deep blue sea" means to be in dilemma.
According to the passage, one of the reasons for the euphoria in the mutual fund industry can be attributed to
The answer can be deduced from the following lines:". Being successful with equity investments required no skills; only investible funds. Nor was fund-raising a problem, as investors desperately sought ways to grab a piece of equity boom. Between 1984 and 1989, the mutual funds collected Rs. 13,455 crore as subscriptions, but, in the next five years, they picked up Rs. 45,573 crore."
Here the author highlights the fact that the boom in mutual find market was due to the boom in equity markets in mid-eighties.

Educational materials for CAT preparation
