Sign in
Please select an account to continue using cracku.in
↓ →
Answer the questions based on the following information. The following bar chart gives the growth percentage in the number of households in the middle, upper-middle and high-income categories in the four regions for the period between 1987-88 and 1994-95.
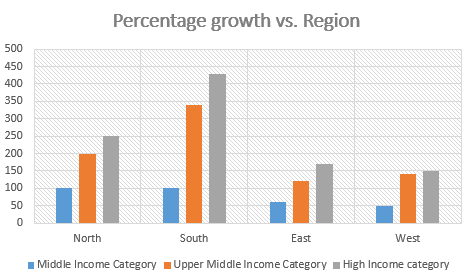
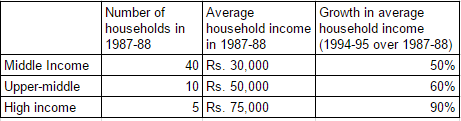
(Number of households in thousands)
Which region showed the highest percentage growth in number of households in all the income categories for the period?

Percentage growth of all households South region showed the maximum increase in all households in the given period. (100% + 340%+ 425% = 865%)
Create a FREE account and get:
Book Free CAT Mentorship
Get personalized CAT strategy from a 99%iler
500+ students mentored
OTP Verification
Enter the 6-digit code sent to your phone
Booking Summary
Enter OTP
Didn't receive the OTP?

Educational materials for CAT preparation

Ask our AI anything

AI can make mistakes. Please verify important information.
AI can make mistakes. Please verify important information.


