Sign in
Please select an account to continue using cracku.in
↓ →
Directions for the following three questions: Answer the questions based on the pie charts given below.
Chart 1 shows the distribution of 12 million tonnes of crude oil transported through different modes over a specific period of time.
Chart 2 shows the distribution of the cost of transporting this crude oil. The total cost was Rs. 30 million.
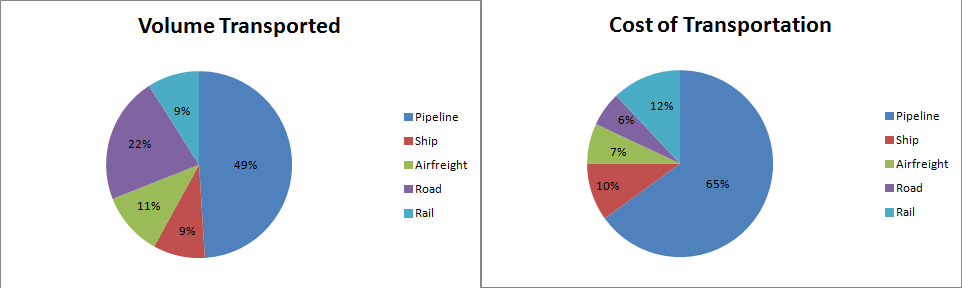
Cheapest mode of transport will be the one which will have highest transport volume and comparatively lowest cost. We can figure out from the graph that Road have wide gap with very less costs.
For Road, Cost = 6/22
For Rail, Cost = 12/9
For Pipeline, = 65/49
For Ship, Cost = 10/9
Lowest cost is for road.
Create a FREE account and get:
Book Free CAT Mentorship
Get personalized CAT strategy from a 99%iler
500+ students mentored
OTP Verification
Enter the 6-digit code sent to your phone
Booking Summary
Enter OTP
Didn't receive the OTP?

Educational materials for CAT preparation

Ask our AI anything

AI can make mistakes. Please verify important information.
AI can make mistakes. Please verify important information.