Sign in
Please select an account to continue using cracku.in
↓ →
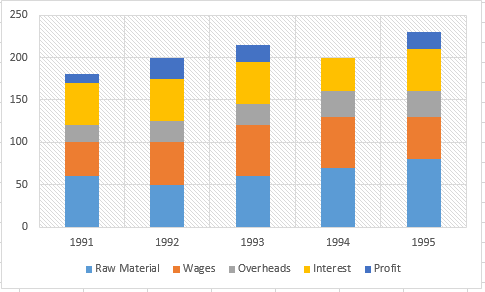
The profits of the company became zero only in one year (1994)
Hence, the change in profit is maximum in the period 1993-94 and equals 100%.
Note that there was a decrease in profits in other years also, but the maximum possible change is 100% and it was occurred in 1993-94
Create a FREE account and get:
Book Free CAT Mentorship
Get personalized CAT strategy from a 99%iler
500+ students mentored
OTP Verification
Enter the 6-digit code sent to your phone
Booking Summary
Enter OTP
Didn't receive the OTP?

Educational materials for CAT preparation

Ask our AI anything

AI can make mistakes. Please verify important information.
AI can make mistakes. Please verify important information.