91- 6303239042

Answer the following using Pie chart and the total chocolates are 350.
Sign in
Please select an account to continue using cracku.in
↓ →
Answer the following using Pie chart and the total chocolates are 350.
What is the difference between the person receiving highest and lowest number of chocolates ?
Number of chocolates with Ravi=(30/100)*350=105
Number of chocolates with Srujay=(10/100)*350=35
Difference between them=105-35=70 chocolates
What is the average number of chocolates received by Ravi,Praful and Srujay ?
Number of chocolates with Ravi=(30/100)*350=105
Number of chocolates with Srujay=(10/100)*350=35
Number of chocolates with Praful=(20/100)*350=70
Average of chocolates receive by these three=(105+35+70)/3
=70
Refer to the table and answer the following questions.
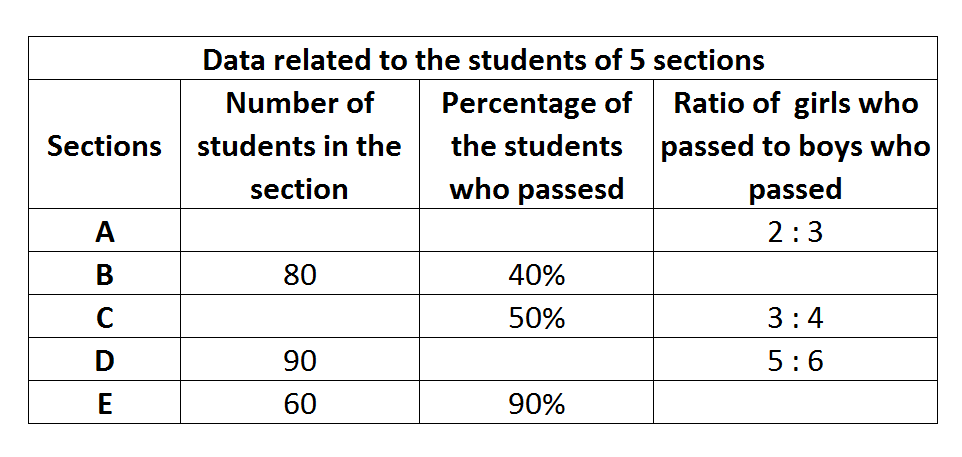
In section B, if 20 girls passed what is the ratio of the number of girls who passed to the number of boys who passed?
Given ,
There are 80 students.
40% of them passed, hence 32 students passed.
20 of the students who passed are girls so the rest 12 are boys.
The ratio = 20 : 12 = 5 : 3
A Movie theatre, J cinemas, screens four movies - W, X, Y and Z. The following table gives the data about the number of viewers of each movie for five days of a particular week.
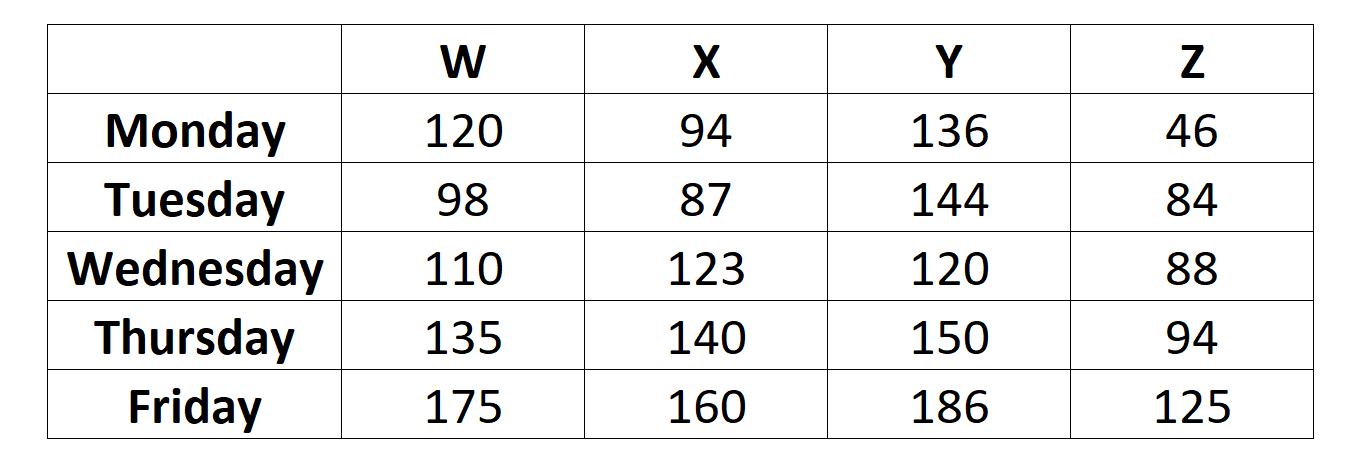
The total number of viewers on Friday is approximately what percent greater than the number of viewers on Monday?
The given table is:
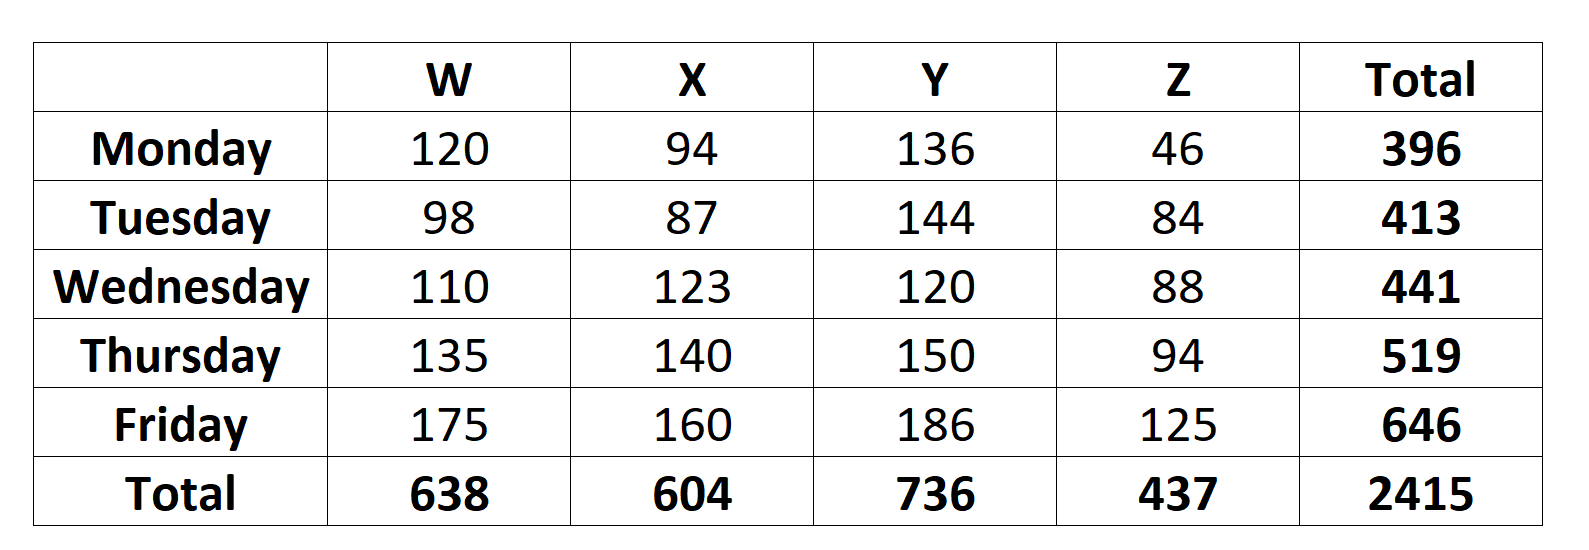
The total number of viewers on Monday = 396
The total number of viewers on Friday = 646
Difference = 250
The number of viewers in Friday is 250/396 * 100 = 63.13% greater than Monday, which is approximately 63%.
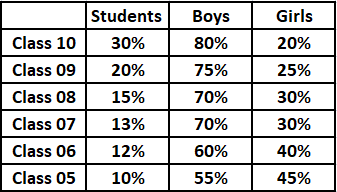
The table represents the data about the number of students studying in Delhi Public School. Further, it is known that a total of 2000 students are studying in the school from Class 5th to Class 10th.
What is the ratio of the number of boys studying in class 9th to the number of the girls studying in class 10th and class 5th combined?
Total number of students in Class 10th = $$\frac{30}{100}\times 2000$$ = 600
Out of these 600 students, the number of boys students in class 10th = $$\frac{80}{100}\times 600$$ = 480
The number of girls students in class 10th = $$\frac{20}{100}\times 600$$ = 120
In similar way we can calculate number of boys and girls in each class. Tabulating the same data
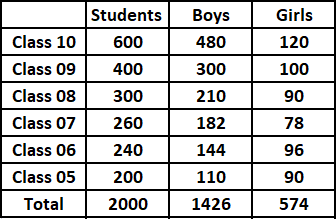
From the table we can see that,
The number of boys studying in class 9th = 300
Sum of the number of the girls studying in class 10th and class 5th = 120 + 90 = 210
Hence, the required ratio = 300 : 210 = 10 : 7
Therefore, option A is the correct answer.
The revenue and the operating expenses as a percentage of revenue of five companies - A, B, C, D and E is given in the following table. (The revenue is given in crores)
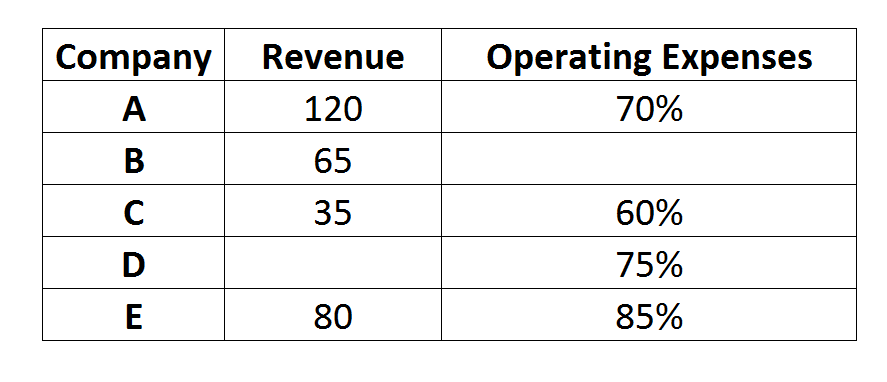
Profit = Revenue - operating expenses.
What is the average profit of companies A and E (in crores)?
From the given table,
Revenue of A = 120 crores
Operating expenses = 70% of 120 = 84 crores
Profit = 120 - 84 = 36 crores
Similarly, calculating and tabulating the values for other companies,
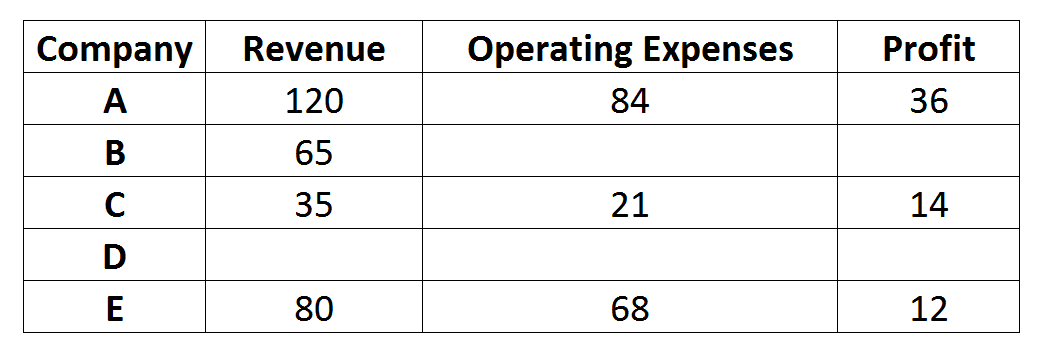
Average profit of companies A and E = 48/2 = 24 crores
In a school the periodical examinations are held every month. In a session during April 'X'- March 'X + 1', Rakesh a student of class IV, section B appeared for each of the periodical exams. The maximum total marks in each periodical exam is 50. The aggregate marks obtained by him in each periodical exam are given below.

The total marks obtained in December X is what per cent more than the total marks obtained in June X ?
Total marks obtained in December X = 46
The total marks obtained in June X = 38
Per cent increase= (46-38)/38= 21.05%
Option D
(In which periodical exams did Rakesh obtain the highest percentage increase in marks over the previous periodical exams?
The highest percentage increase in marks over the previous periodical exams:
May: 2/35
October:2/43
December:1/45
September:2/41
So may have the highest percentage increase.
Option A
Observe the chart and answer the following questions.

In the year 1994, the commission earned by salesman D was approximately what percent more of the commission earned by A?
Commission of A in 1994 = Rs.24600
Commission of B in 1994 = Rs.29800
B's commission is more than A's by:
((29800-24600)/24600) x 100 $$ \approx\ $$ 21%
In the year 1993, the commission of B was approximately what per cent of the total commission earned by five salesmen that year?
On adding up the total earnings of the 5 salesmen in 1993, we get the total amt. = Rs.146960
B's earning in 1993 = Rs. 28000
% of total earning that B earned = (28000/146960) x 100 $$\approx\ $$ 20%
The following questions are based on the pie-chart given below which gives the expenditure incurred in printing a magazine:

What is the angle for the sector representing paper cost?
If we consider the entire circle, it represents both 360$$^{\circ\ }$$ as well as 100%.
So, 360$$^{\circ\ }$$= 100%
=> 10%= 36$$^{\circ\ }$$
Paper's share is shown as 10%. therefore angle subtended by the paper's share is 36$$^{\circ\ }$$
For a given issue of the magazine, the 2% of the cost is Rs. 2,000 and the print-run is 12,500 copies. What should be the sale price if the publisher desires a profit of 5 percent?
It is given that 2% of C.P= Rs. 2000
=>$${\ \frac{\ 2}{100}}$$*CP= 2000
=>CP= $${\ \frac{\ 200000}{2}}$$.
.'. CP= Rs. 1,00,000
Profit required =5%
So, total SP= 1.05(1,00,000)= Rs. 1,05,000.
Copies sold= 12,500.
Therefore, SP of each copy= Rs. $${\ \frac{\ 1,05,000}{12,500}}$$= Rs.8.40- Option D
Refer to the chart below showing annual production and answer the questions that follow.

Which industry /industries contribute /contributes to company S?
Only B contributes to company S .
Industry B processes what percentage of the total production of listed elements?
25+40=65% of the total production of listed elements is processed by B
Of the listed elements processed by the Industry A, how many tons are produced annually?
% Production for industry A is = 10+10+15+20+40+5 = 100%
100% production corresponds to 100000 tons.
Following is a new plan called ‘Airtel One’, introduced by Airtel (GSM service Provider) for its post-paid customers.

If Mohan made STD calls (within 100 kms) for 30 min and spent 100 min on local calls with 30% on landline, 40% in GSM and 30% on Airtel, and Rohan spent 18 min on STD within 150 Kms and spent 120 mins on local calls with 30%, 40% and 30% on GSM, landline and Airtel respectively, then who spent more?
For Mohan,
There are 2 cases for STD calls:
1) Call rate of 1.5 which will give 30*1.5= Rs. 45
2) Call rate of 2, which will give 30*2= Rs. 60
For Local calls,
30% of 100min in landline= 30 min of landline will cost 30*2= Rs. 60
40% of 100 min in GSM = 40 min of GSM will cost 40*1= Rs. 40
30% of 100 min in Airtel= 30 min of Airtel costs 30*1= Rs. 30
Total money spent by Mohan for local calls= Rs. 130.
In total he spends either Rs. 130+ 45= 175 or Rs. 130+60= Rs. 190.
For Rohan,
The two cases for STD call rates will cost him:
1) 18*1.5= Rs. 27 with call rate of Rs.1.5/min
2) 18*2= Rs. 36 with call rate of Rs. 2/min
For Local calls,
30% of 120 min= 36 min with GSM will cost him Rs. 36.
40% of 120 min= 48 min with landline will cost him Rs. 48*2= Rs. 96
30% of 120 min= 36 min with Airtel will cost him Rs. 36.
Total money spent on local calls= Rs. (36+ 96+36)= 168.
Including the STD calls, he spends either Rs. 195 or Rs. 201.
Clearly, even the case where the maximum money spent by Mohan is less compared to the case where the minimum amount spent by Rohan is considered. Therefore, Rohan spends more of the two.
A new SMS scheme was introduced @60p/local SMS, with an additional monthly charge of Rs. 35. Who will not benefit from the scheme? A Person sending
We will try to find the breakeven point at which the money spent at old rate was higher than or equal to the money spent on the new scheme.
Let us consider x SMS being sent a month.
Bill amount because of old rates= 1.5x
For the new scheme, money payable= 0.6x+ 35.
So, for the new scheme to be profitable,
1.5x> 0.6x+35
=> 0.9x> 35
=> x>35/0.9
=>x>38.88
or, from 39 messages/ month onwards, the scheme is profitable.
.'. For a person sending 38 SMS a month will not be benefited from the scheme.
A bill of Rs 199/Month is definitely not possible when you make only
To get a total bill of Rs. 199, we need to somehow amount the outgoing calls to Rs. 100, as the plan price is Rs. 99
In Option A, 30 STD calls to Airtel (500 km+) will amount Rs. 30*1.5= Rs. 45
55 Local calls to Airtel/ GSM will cost Rs. 55*1= Rs. 55
So, total amount for the given option= Rs. 55+ Rs. 45= Rs. 100. This will amount to total bill of Rs. 199
In option B, 16 STD Airtel calls will amount to Rs. 16*1.5= Rs. 24
76 local calls will cost Rs. 76*1= Rs. 76
So, total amount for the given option= Rs. 76+ Rs. 24= Rs. 100. This will amount to total bill of Rs. 199
In option C, 10 STD calls (250 km) to Airtel, GSM and Landline will cost Rs. {(10*1.5) + (10*2.5) + (10*2.5)}= Rs. (15+25+25)= Rs. 65
The bill from local calls can vary from Rs. 30*1 to Rs. 30*2 i.e from Rs. 30 to Rs. 60
So, total amount can vary from Rs. 95 to Rs. 125. So, a bill of Rs. 100 is possible, which can amount to a total bill of Rs. 199
In option D, 8 STD calls on Airtel, 4 GSM STD and 7 Landline STD, all 500 km+ will cost Rs. {(8*1.5) + (4*3) + (7*3.5)} = Rs. (12+12+24.5)
= Rs. 48.5
Local call bill will vary from Rs. 55*1 to Rs. 55*2, which is from Rs. 55 to Rs. 110.
So, total amount can vary from Rs. 103.5 to Rs. 158.5. So, a bill of Rs. 100 is not possible. Therefore which a total bill of Rs. 199 is not possible in this case.
A person makes 12 minutes of ISD calls in a month. If 80% of his ISD bill came from calling the rest of the world, then the ISD calls for the minimum duration were made to which of the following group of countries?
Since, the amount of the total ISD bill is not mentioned, we cannot determine the required entity.
So, Cannot be determined.
These questions are based on the graph which shows the demand and production statistics of 5 T.V. companies

What is the difference between the average demand and the average production of the five companies taken together?
Total Demand= 3000+ 600+ 2500+ 1200+ 3300= 10600
So, average demand= $$^{\ \frac{\ 10600}{5}}$$= 2120.
Total Production= 1500+1800+1000+2700+2200= 9200
Average Production= $$^{\ \frac{\ 9200}{5}}$$= 1840.
Therefore difference in average production and average supply= 2120-1840= 280- Option C
The production of the company D is how many times of the production of the company A?
Production of Company D= 2700
Production of company A= 1500
So, D's production is $$^{\ \frac{\ 2700}{1500}}$$= 1.8 times that of A's production.
On the counter are six squares marked 1, 2, 3, 4, 5, 6. Players are invited to place as much money as they wish on any one square. Three dice are then thrown.
1 If your number appears on one die only, you get your money back plus the same amount.
1 If two dice show your number, you get your money back plus twice the amount you placed on the square.
1 If your number appears on all three dice, you get your money back plus three times the amount.
1 If the number is not on any of the dice, the operator gets your money.
For example, suppose that you bet one Rupee on square No. 6. If one die shows a 6, you get your Rupee back plus another Rupee. If two dice show 6, you get back your Rupee plus two Rupees. If three dice show 6, you get your Rupee back plus three Rupees.
From a player’s point of view, the chance of his number showing on one die is $$\frac{1}{6}$$, but since there are three dice, the chances must be $$\frac{3}{6}$$ or $$\frac{1}{2}$$, therefore the game is a fair one. Of course this is the way the operator of the game wants everyone to reason, for it is quite fallacious.
What is the probable story?
$$\ \ \frac{\ 5\times\ 5\times\ 5}{6\times6\ \times6\ \ }=\ \frac{\ 125}{216}$$Let the player bet Re 1 on any particular number.
If exactly 1 die shows the number, the player will get Rs 2. (Operator has to lose Re 1 from his side). Probability of it is $$\ \frac{\ 1\times\ 5\times\ 5\times\ 3}{6\times\ 6\times\ 6}=\ \ \frac{\ 75}{216}$$
If exactly 2 die shows the number, the player will get Rs 3. (Operator has to lose Rs 2 from his side). Probability of it is $$\ \frac{\ 1\times\ 1\times\ 5\times\ 3}{6\times\ 6\times\ 6}=\ \frac{\ 15}{216}$$
If all die shows the number, the player will get Rs 4. (Operator has to lose Rs 3 from his side). Probability of it is $$\ \ \frac{\ 1\times\ 1\times\ 1}{6\times6\ \times6\ \ }=\ \frac{\ 1}{216}$$
If no die shows the number, the player will get Rs 0. (Operator will gain Re 1). Probability of it is $$\ \ \frac{\ 5\times\ 5\times\ 5}{6\times6\ \times6\ \ }=\ \frac{\ 125}{216}$$
Overall expected earning of Operator will be = $$\left(-1\right)\times\ \ \frac{\ 75}{216}+\left(-2\right)\times\ \ \frac{\ 15}{216}+\left(-3\right)\times\ \ \frac{\ 1}{216}+\left(1\right)\ \frac{\ 125}{216}$$
Overall Earning Per rupee is $$\ \frac{\ 17}{216}=\ 0.078$$
His earning per rupee is 7.87%
Study the following two tables of data on Agriculture Import and Export of India during 1998-2001 and answer the following questions.

Which was the single largest contributor to the total agri exports in 2000-01? If the total agri exports were valued at US $ 6 billion, what is its contribution in dollar terms?
We see that the maximum value of export in 2000-01 belongs to Marine Products which is 1,394. and is 23.2% of total export.
Value of total export is US $ 6 billion.
Value of Marine Product will be $$23.2\%\ of\ 6\ billion$$ = US $ 1.39 billion
Which product has shown strong growth in exports during the 3-year period?
For Meat and Meat Preparation $$\%\ increase$$ = $$\ \frac{\ 322-187}{187}\times\ 100\%$$ = 72%
For Fruits and Vegetables $$\%\ increase$$ = $$\ \frac{\ 248-184}{184}\times\ 100\%$$ = 34%
For Processed Fruits and Vegetables $$\%\ increase$$ = $$\ \frac{\ 122-69}{69}\times\ 100\%$$ = 76.8%
Hence Option C is correct
Which was the dominant import commodity in 2000 2001 after the vegetable oil?
The Veg Oil value for the import is 1334.
Next, highest value is of Cashew Nut i.e. 211
From the import data about Sugar and Cereals it can be said that
For both the commodities we see the decline in the imports. This is possible if the production of these commodities go up or the consumption goes down. But we cannot exactly say which of the following is true. However it is evident that the gap has decreased. Hence Option C
In some circles concerns were expressed that liberalization of imports, resulting from lifting of quantitative restrictions on agri products, would lead to surge of agri imports affecting the Indian farmers. What does the data depict?
Even though India was importing the commodities the overall import has been coming down. Hence option A is not suitable.
Vegetable and Pulses form the majority of the import but it does not justify the statement as their import is also decreasing. Hence C is invalid.
Option D is incorrect as total export is less than the import
Option B states the correct scenario as we can see that overall import are coming down
Over the period under study both percentages of the total agri-exports to the total exports and that of the total agri-imports to the total imports show a downward trend. This indicates that
A country should always be looking to export as much as possible and import as less as possible. As the import is decreasing, it is a positive sign. But the export is also decreasing, which is not a good sign.
Option A doesn't issue the address in hand and shifts focus.
Option B is totally the opposite.
Option C is partially right but limiting exports is not a good choice.
Option D is the solution to the problem.
Terms of Service
Start your IIM journey with the right preparation and crack CAT 2026.

Educational materials for CAT preparation